

During the week of May 17-24, the Bitcoin price decreased considerably. It created a bearish engulfing candlestick that caused it to decrease all the way to an important support level.
A breakdown below this support could indicate that the price has begun a new bearish trend.
Bearish Bitcoin Weekly Close
The bearish weekly close has caused the price to be rejected below the long-term descending resistance line that has been in place since the December 2017 all-time high. However, the weekly close was at the same level as that during the week of May 3-10, reducing some of the bearishness by the candlestick. It seems that the previous breakout was not valid, and the price is likely to decrease in the near future. In the weekly time-frame. the closest support area is found at $6,550, while the closest resistance at $12,000.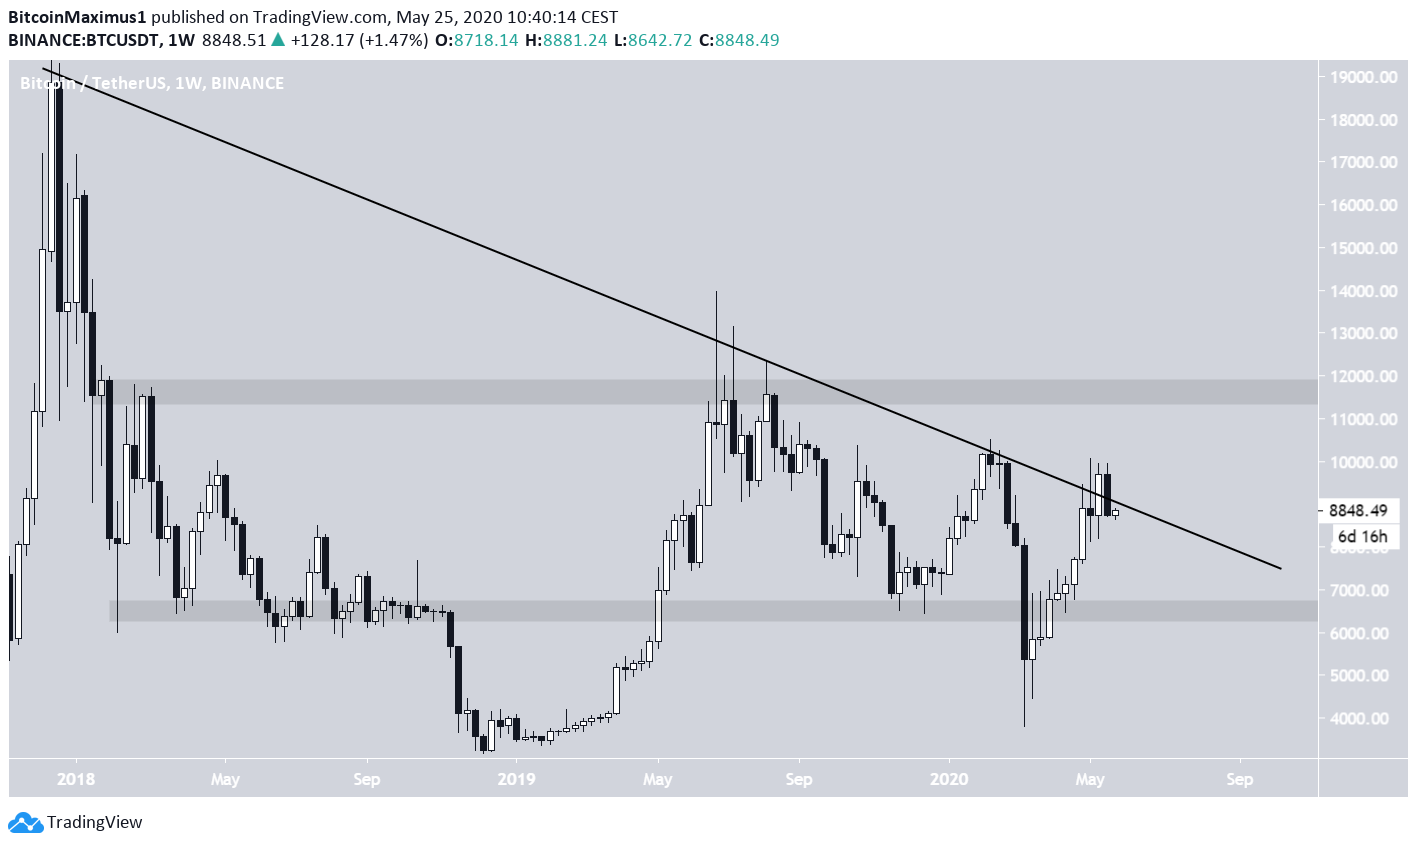
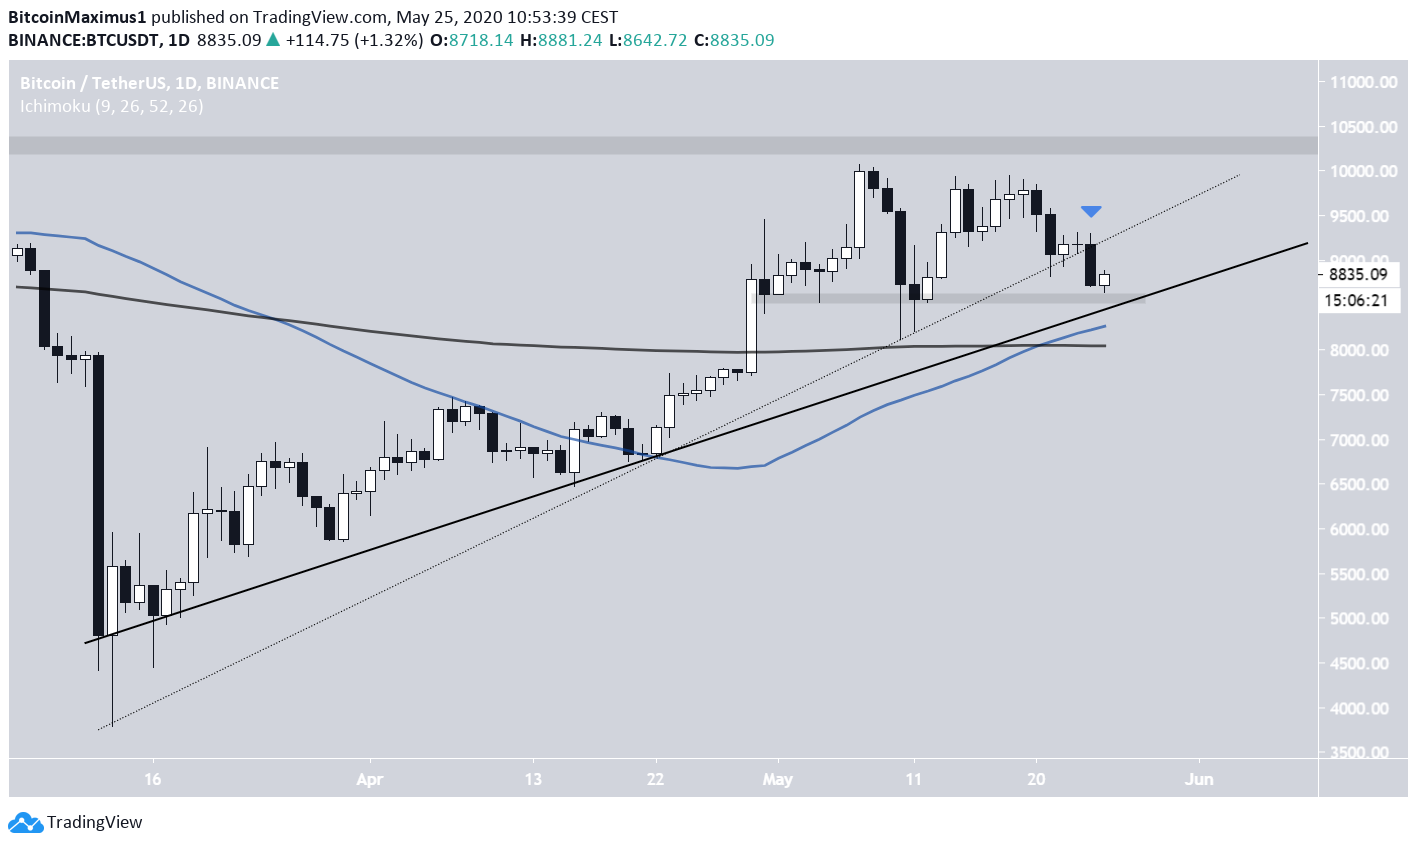
Ascending Support Line
Moving to a lower time-frame, the daily chart reveals that the price is fast approaching a confluence of support levels near the $8,500 area:- The long-term ascending support line that the price has been following since March 13.
- The $8,500 support level.
- The 50-day moving average (MA), which has just made a bullish cross with the 200-day MA.
Support Level
In the even shorter-term, we can see that BTC has just fallen below the 0.618 Fibonacci level of the entire upward move beginning on May 11. The $8,5550 level is an area that previously initiated upward moves, and also the 0.765 Fib level. Therefore, it is very likely that it initiates a bounce. However, there is no bullish divergence in the RSI just yet, so it is possible that the downward move might continue towards $8,000. A breakout above the descending resistance line (dashed) would indicate that the downward move is likely over.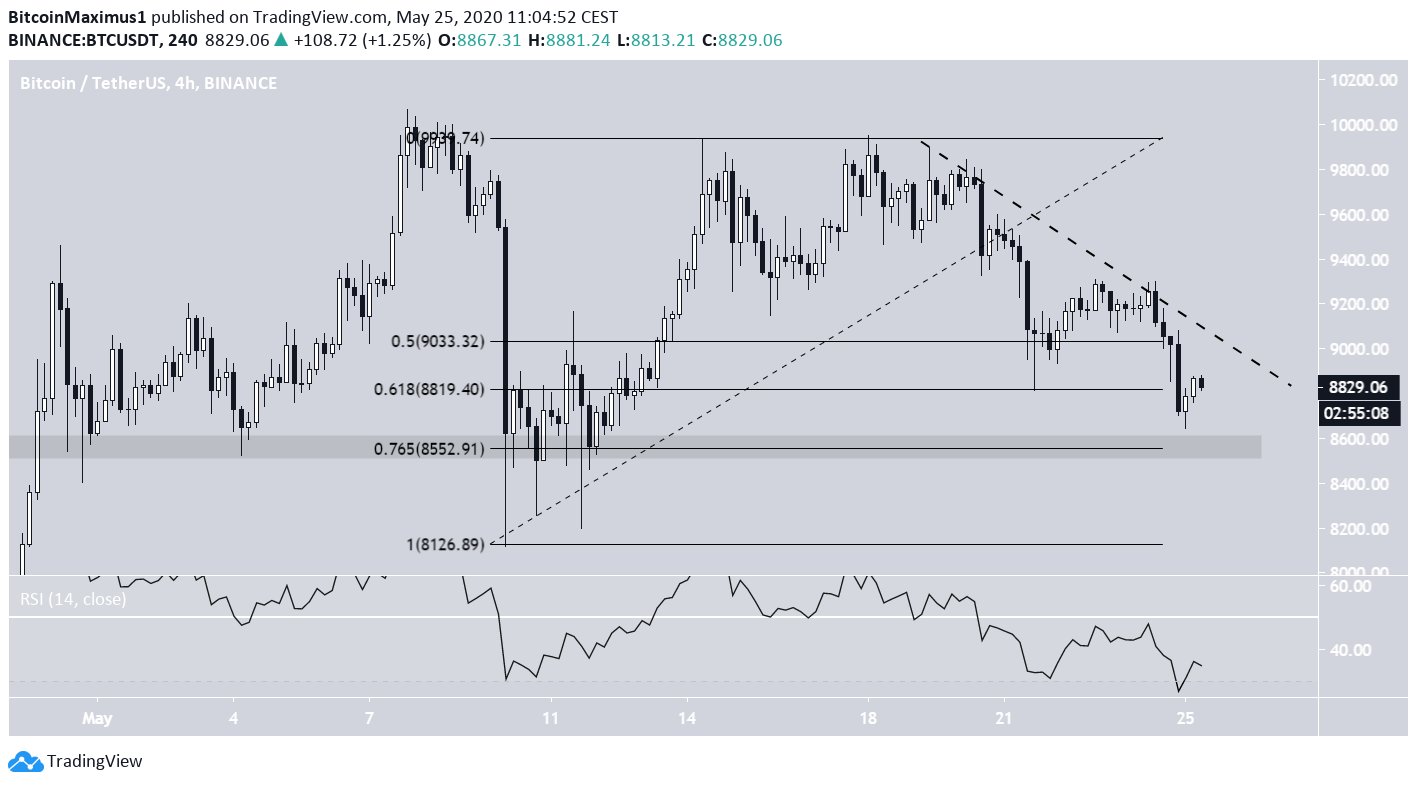
Top crypto projects in the US | April 2024
Trusted
Disclaimer
In line with the Trust Project guidelines, this price analysis article is for informational purposes only and should not be considered financial or investment advice. BeInCrypto is committed to accurate, unbiased reporting, but market conditions are subject to change without notice. Always conduct your own research and consult with a professional before making any financial decisions. Please note that our Terms and Conditions, Privacy Policy, and Disclaimers have been updated.

Valdrin Tahiri
Valdrin discovered cryptocurrencies while he was getting his MSc in Financial Markets from the Barcelona School of Economics. Shortly after graduating, he began writing for several different cryptocurrency related websites as a freelancer before eventually taking on the role of BeInCrypto's Senior Analyst.
(I do not have a discord and will not contact you first there. Beware of scammers)
READ FULL BIO
Sponsored
Sponsored