

The Wanchain (WAN) price has been retracing since a massive upward movement on Nov. 28 caused a 160% increase. Whether it holds above the $0.20 support area or breaks down will determine the direction of the future trend.
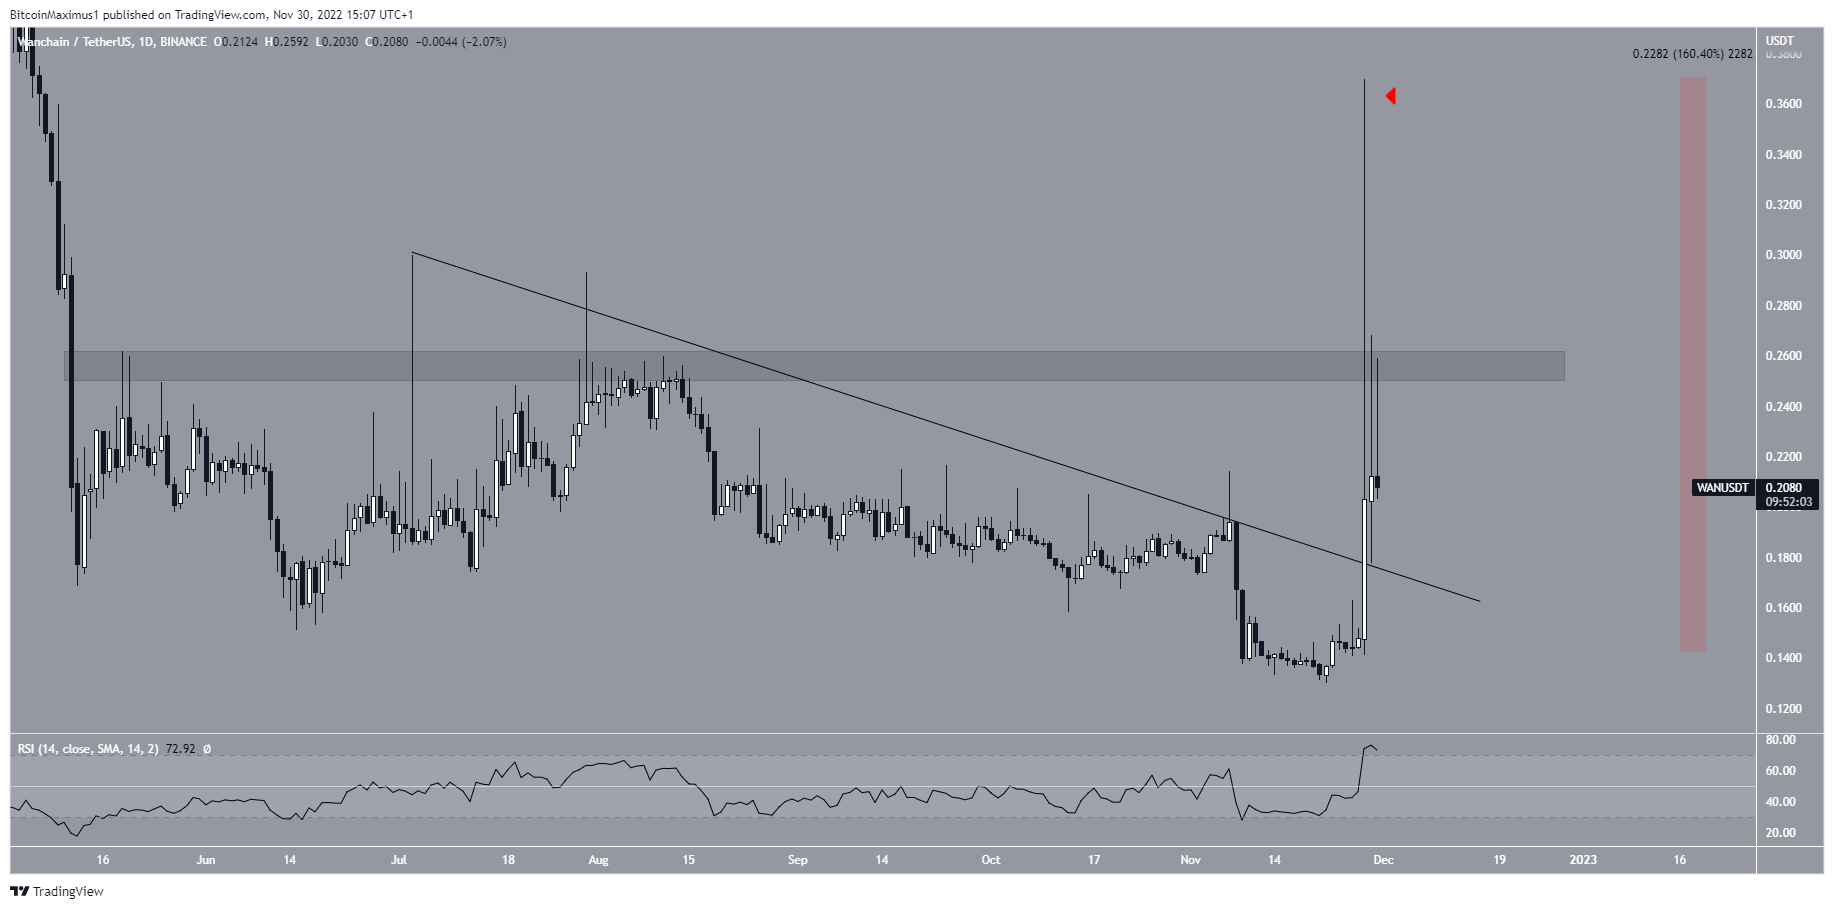
The WAN price decreased below a descending resistance line since July 3. The line rejected WAN on Nov. 8 and led to a new yearly low of $0.130 on Nov. 22.
Afterward, the Wanchain price initiated a very sharp upward movement and broke out from the line on Nov. 28. It reached a high of $0.370 the same day. This amounted to a 160% in a single day.
However, the upward movement could not be sustained, and the price created a very long upper wick (red icon), which is considered a sign of selling pressure. The ensuing drop validated the $0.255 area as resistance.
Despite being below resistance, there are no clear bearish signs besides the wick. The RSI has not generated bearish divergence even though it is overbought. As a result, another attempt at breaking out may follow.
Where Will WAN Price Find Support?
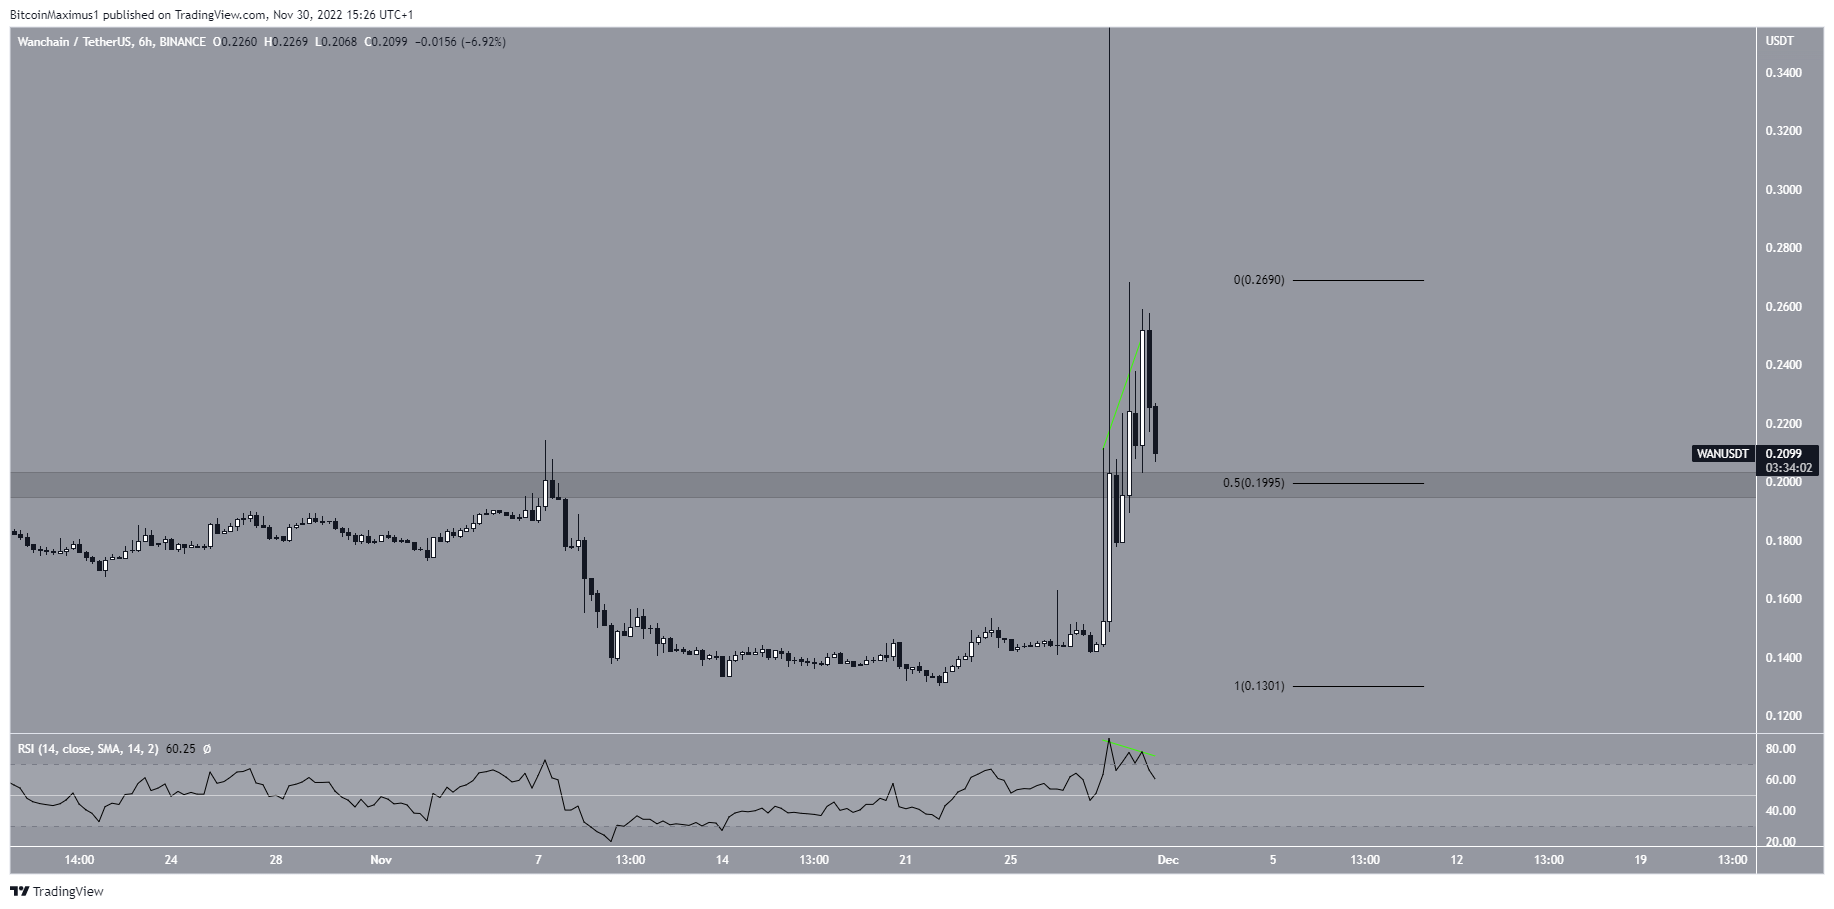
The short-term six-hour chart shows that the main horizontal resistance area is at $0.20. The area has been in place since Aug. 26. So, the breakout from the resistance line also caused a breakout from this area. Now, the $0.20 area is expected to provide support.
Another interesting development for the WAN price is the bearish divergence in the six-hour RSI (green line). Such divergences often precede downward movements, as was the case here.
If the WAN price bounces at the $0.20 area and validates it as support, another attempt at breaking out above $0.255 would be expected.
However, if it breaks down and validates the area as resistance, the WAN price could fall to new yearly lows.
For BeInCrypto’s latest crypto market analysis, click here.
Disclaimer: BeInCrypto strives to provide accurate and up-to-date news and information, but it will not be responsible for any missing facts or inaccurate information. You comply and understand that you should use any of this information at your own risk. Cryptocurrencies are highly volatile financial assets, so research and make your own financial decisions.
Trusted
Disclaimer
In line with the Trust Project guidelines, this price analysis article is for informational purposes only and should not be considered financial or investment advice. BeInCrypto is committed to accurate, unbiased reporting, but market conditions are subject to change without notice. Always conduct your own research and consult with a professional before making any financial decisions. Please note that our Terms and Conditions, Privacy Policy, and Disclaimers have been updated.
