
Since February 10, the WAVES price has made several unsuccessful attempts at breaking out above the 15,000 satoshi resistance area.
Waves (WAVES) Highlights
- There is resistance at 15,000 and 26,000 satoshis.
- The daily RSI has generated bearish divergence.
- The price is following an ascending resistance line.
- The price has possibly created a head and shoulders pattern.
- There is support at 10,000 satoshis.
Will the WAVES price be successful in breaking out above this resistance area? Continue reading below if you are interested in finding out.$WAVES
— Posty (@PostyXBT) February 21, 2020
If price can flip this weekly level, the next level of resistance gives us 50% runway pic.twitter.com/GyzFjyrix0
WAVES Weekly
The weekly waves chart shows the two resistance areas outlined in the tweet, found at 15,000 and 26,00 satoshis, respectively. The price is currently trading inside the first one. In addition, we can see that the weekly RSI has generated bullish divergence. The only time prior to this that it has done so, an upward move with a magnitude of 400% followed. If the same were to occur right now, the price would go all the way to 36,000 satoshis, way above the second resistance area. The RSI has already moved above 50, so if the price were to flip the resistance area, it would confirm that the price movement is bullish.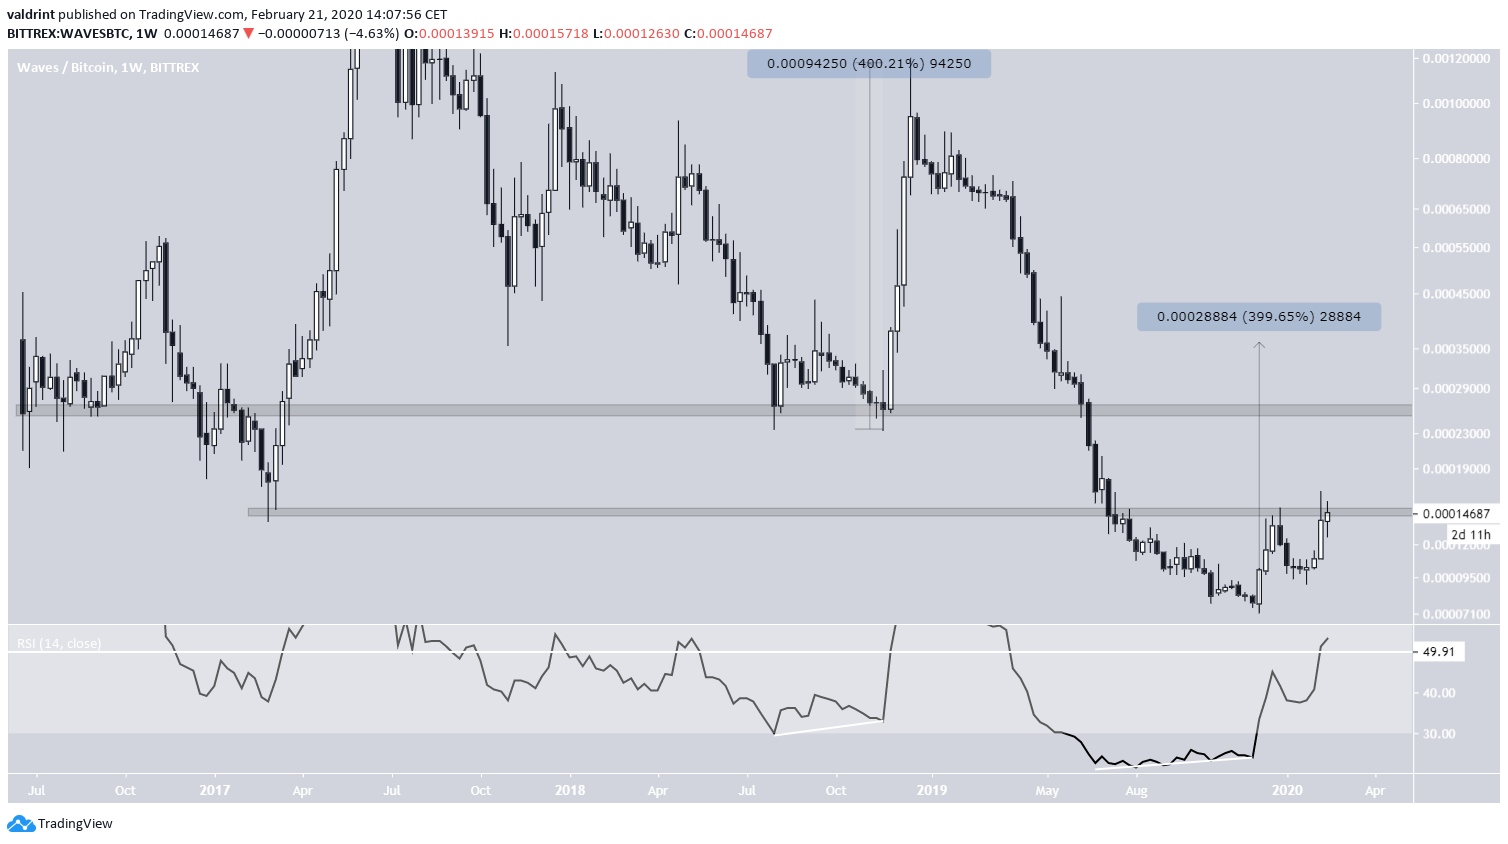
Possible Decrease
The daily chart reveals that the price has been following an ascending resistance line since December 17, 2019. The price has been unsuccessfully attempting to break out above this resistance line, most notably on February 15, when it created a long upper wick and a bearish shooting star candlestick prior to decreasing In addition, the daily RSI has generated strong bearish divergence and has completed a failure swing top. Therefore, this indicates that the price will not be successful in breaking out, rather it will decrease, at least in the short-term.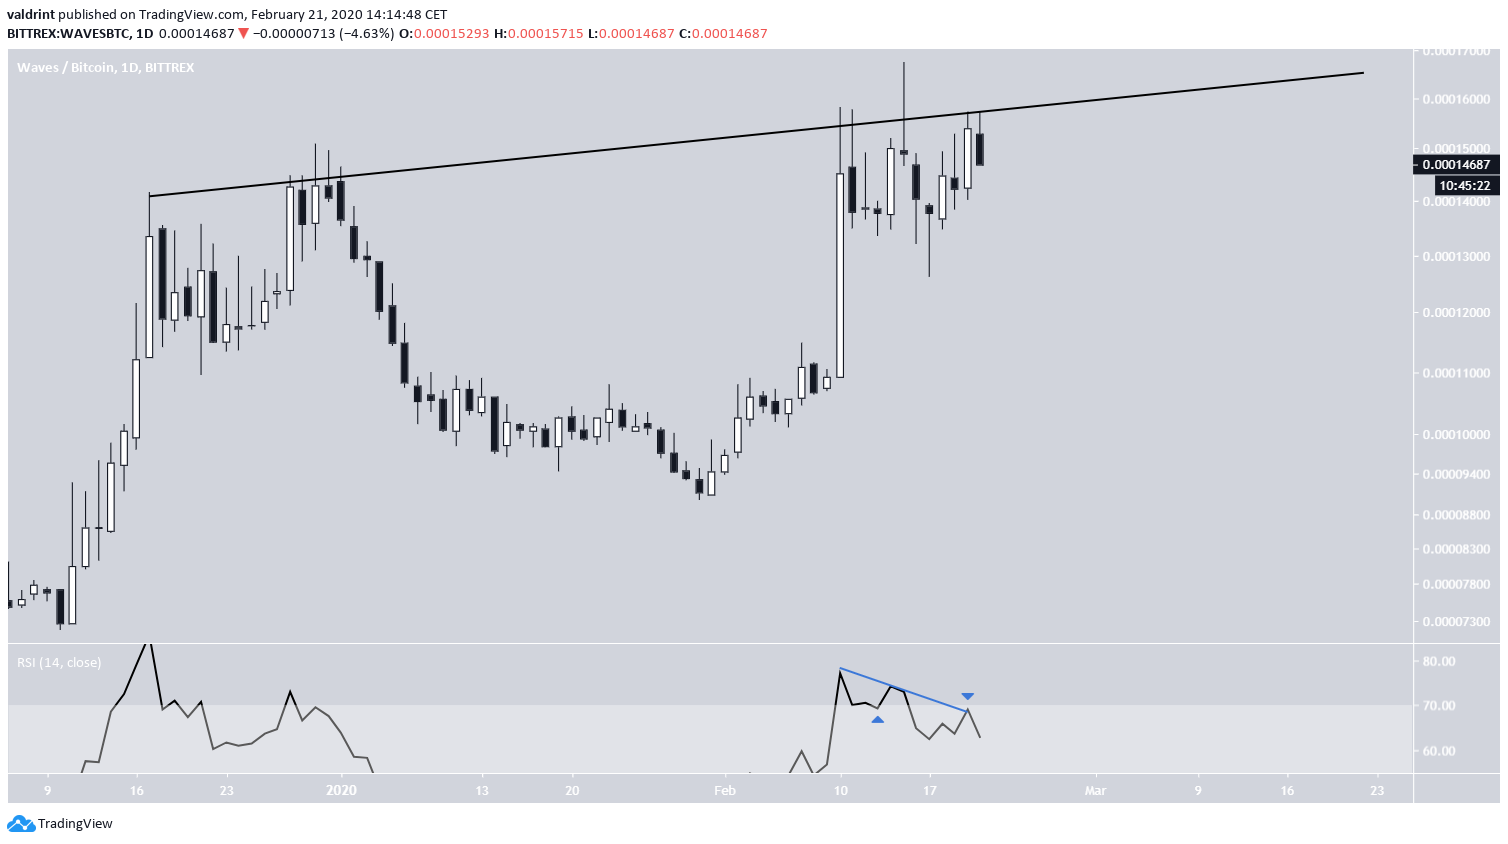 This decrease is also supported by the short-term head and shoulders pattern that has developed. The price seems to be in the process of creating the right shoulder of this pattern.
A breakdown from this pattern would take the price to the next support area which is found at 10,000 satoshis.
This decrease is also supported by the short-term head and shoulders pattern that has developed. The price seems to be in the process of creating the right shoulder of this pattern.
A breakdown from this pattern would take the price to the next support area which is found at 10,000 satoshis.
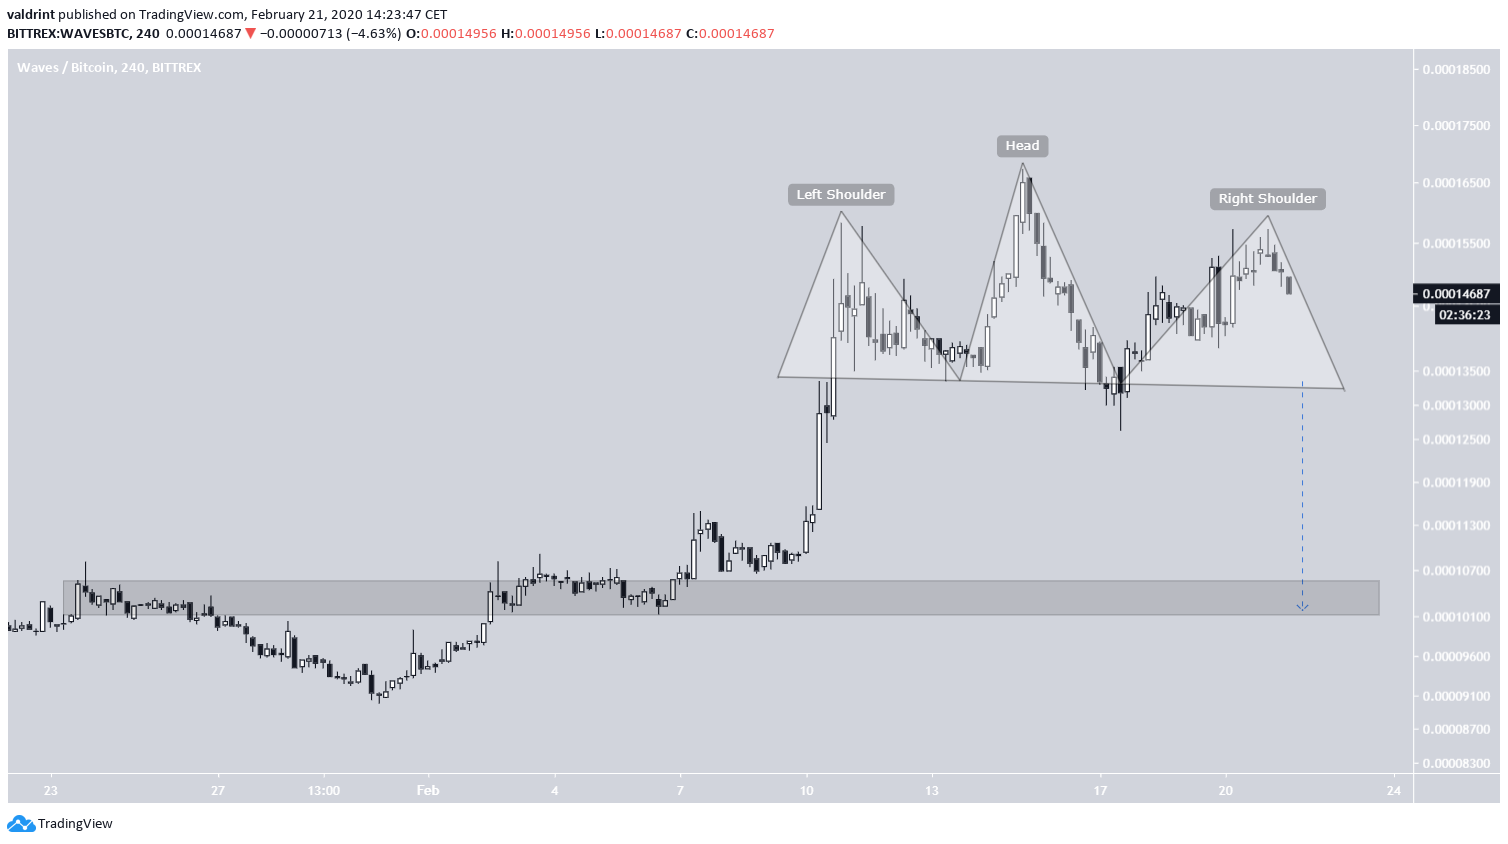 To conclude, the WAVES price has reached a significant resistance area. Technical indicators and the creation of a bearish pattern suggest that the price will not breakout, rather will decrease towards the support area outlined above.
Top crypto projects in the US | April 2024
Trusted
Disclaimer
In line with the Trust Project guidelines, this price analysis article is for informational purposes only and should not be considered financial or investment advice. BeInCrypto is committed to accurate, unbiased reporting, but market conditions are subject to change without notice. Always conduct your own research and consult with a professional before making any financial decisions. Please note that our Terms and Conditions, Privacy Policy, and Disclaimers have been updated.

Valdrin Tahiri
Valdrin discovered cryptocurrencies while he was getting his MSc in Financial Markets from the Barcelona School of Economics. Shortly after graduating, he began writing for several different cryptocurrency related websites as a freelancer before eventually taking on the role of BeInCrypto's Senior Analyst.
(I do not have a discord and will not contact you first there. Beware of scammers)
READ FULL BIO
Sponsored
Sponsored