
Verge (XVG) broke out from the $0.095 resistance area at the beginning of January and is currently in the process of retesting it as support.
While there are no clear reversal signs yet, the most likely outlook has Verge bouncing near the current level and resuming its upward movement.
Verge Retests Support
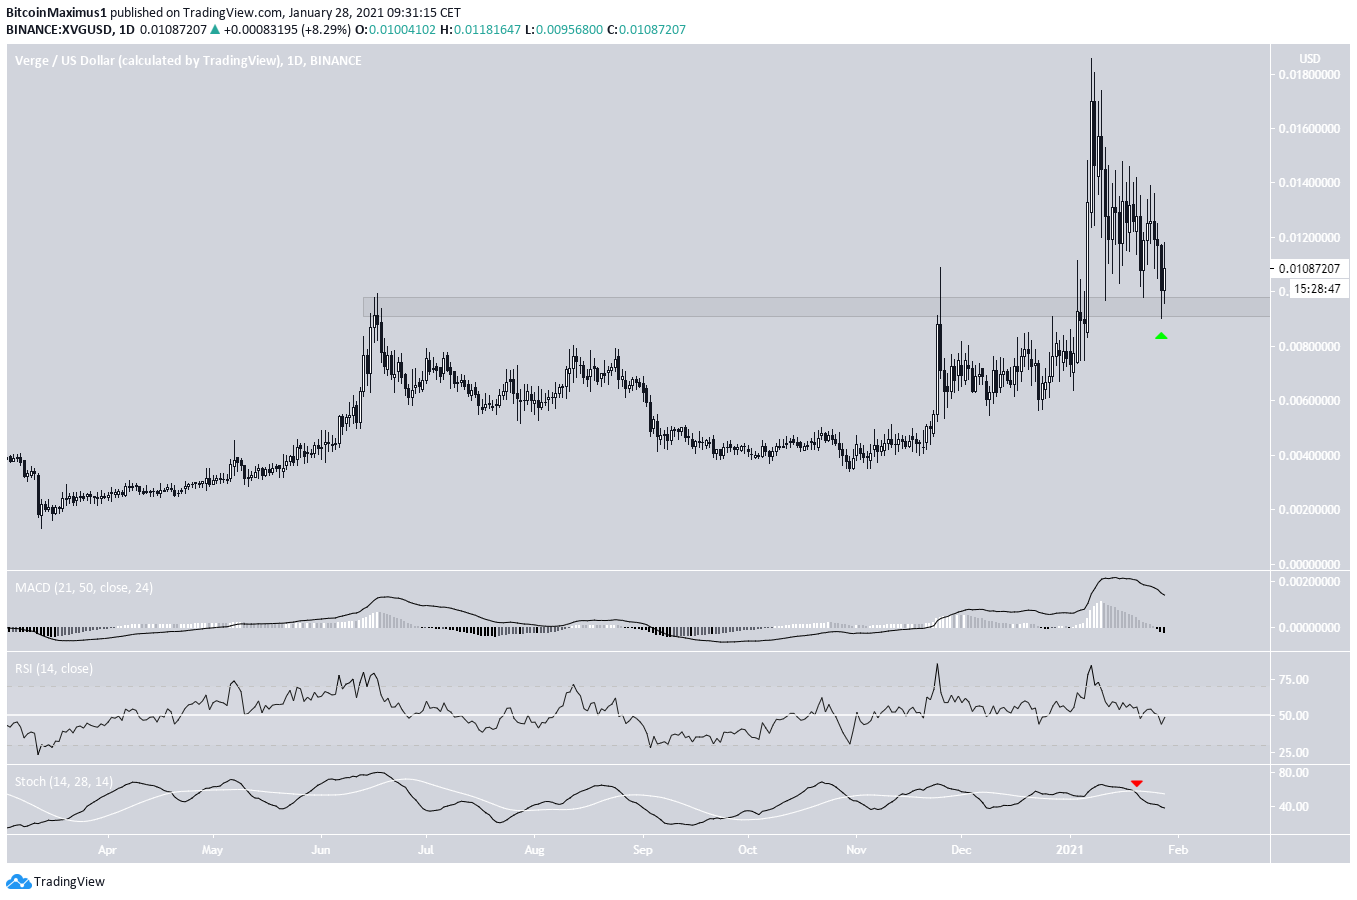
On Jan. 6, 2021, XVG moved above the $0.0095 resistance area. This is a resistance that has been in place since June 2020.
XVG proceeded to reach a high of $0.0185 the next day but has been decreasing since. It’s currently in the process of validating the breakout level.
Despite this being bullish price action, technical indicators are bearish. The RSI has fallen below 50, the Stochastic oscillator has made a bearish cross, and the MACD has turned negative.
Cryptocurrency trader @TheBull_Crypto outlined an XVG chart that shows a potential increase all the way to $0.25.
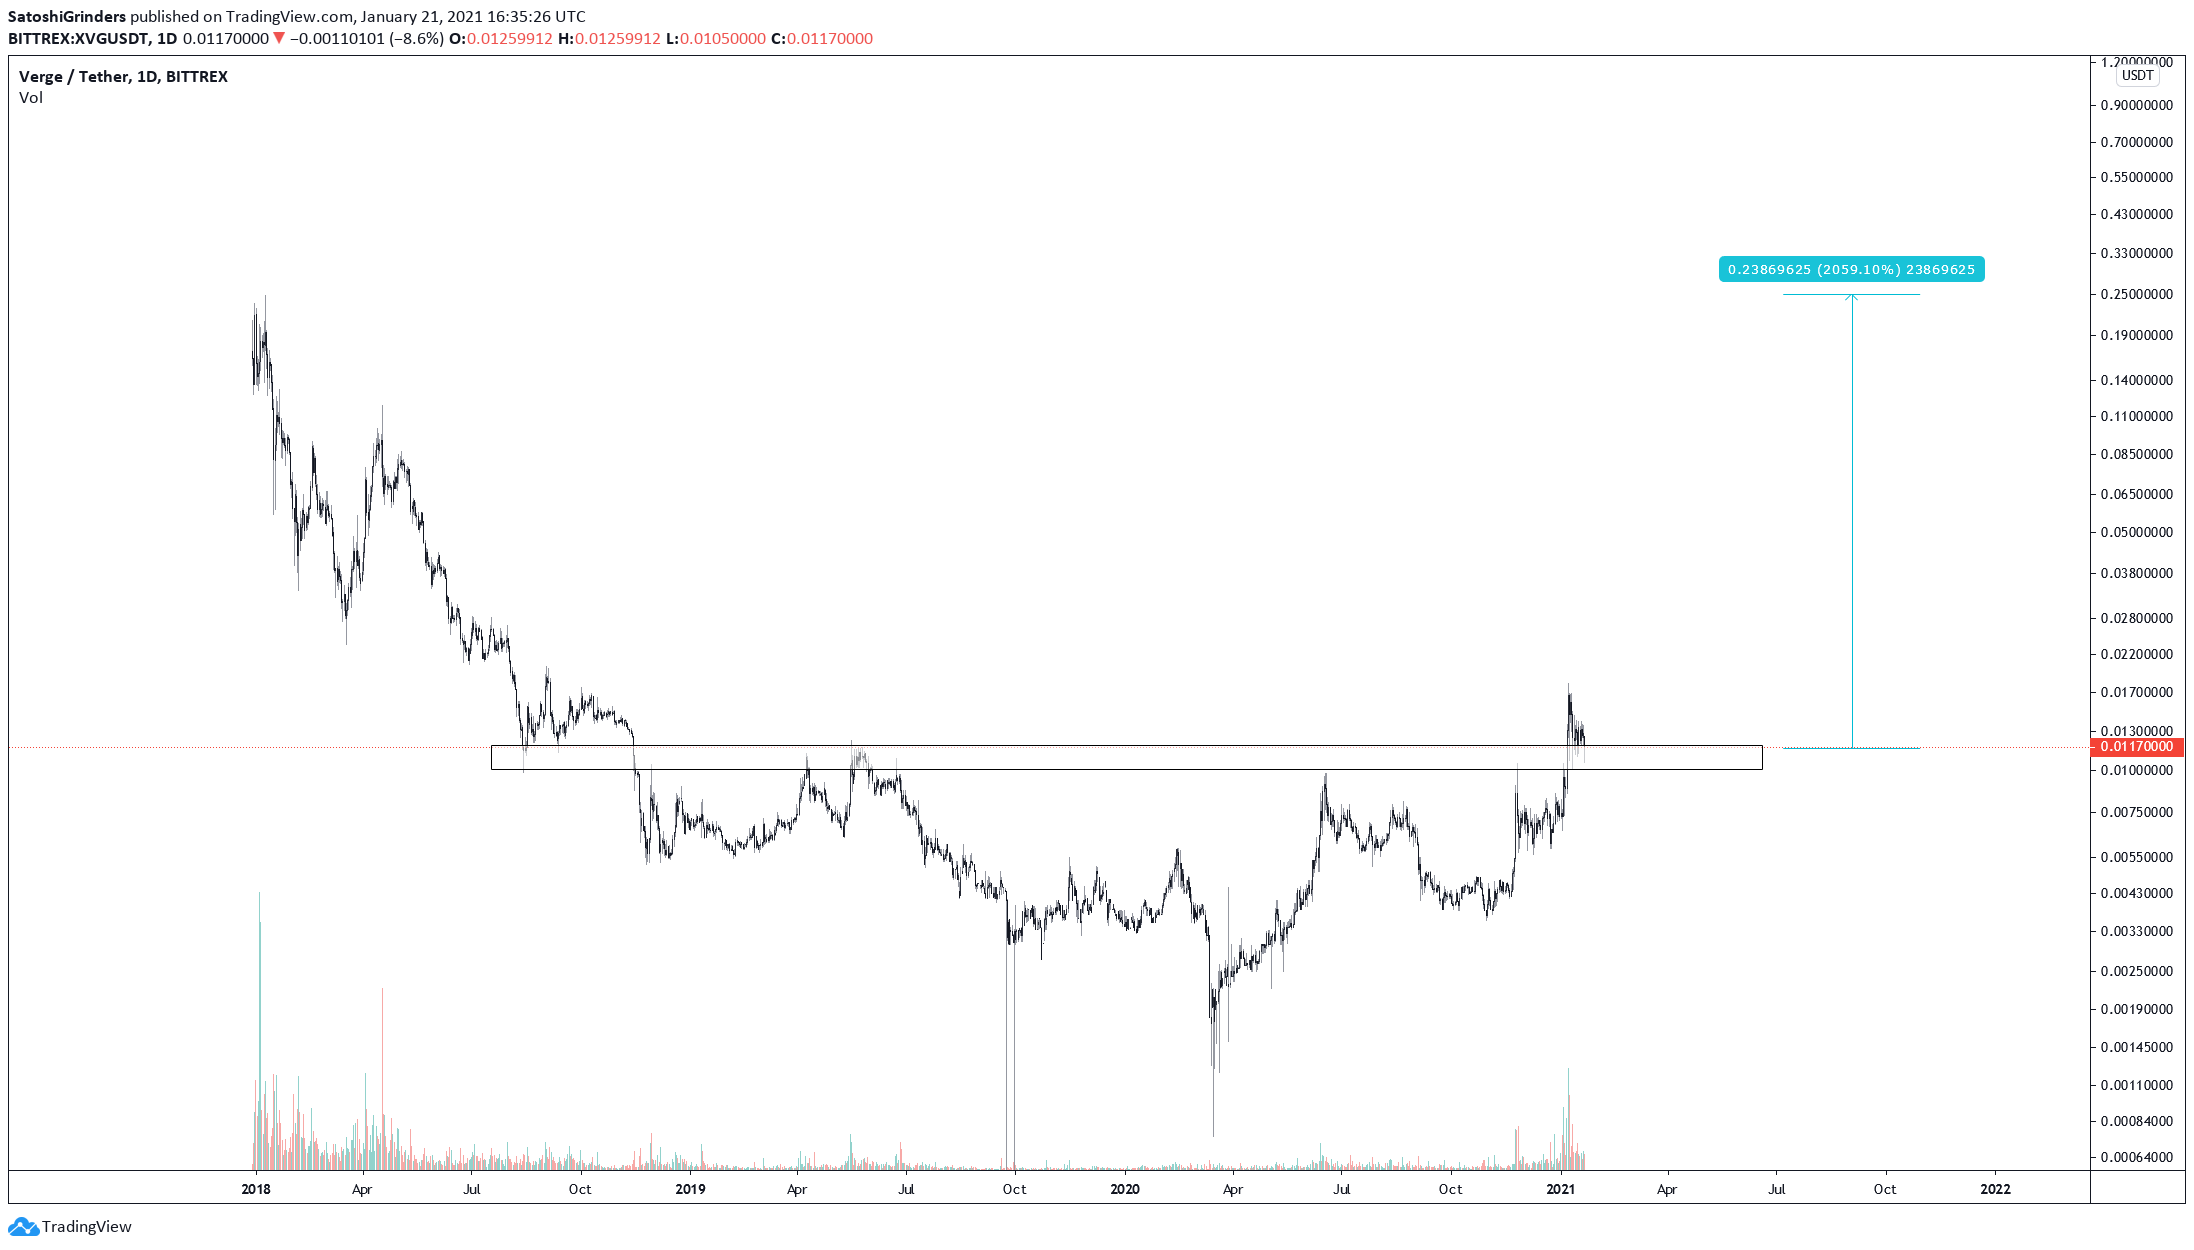
While this is certainly a possibility in the long-term, there are numerous resistance areas that it has to clear before potentially getting there.
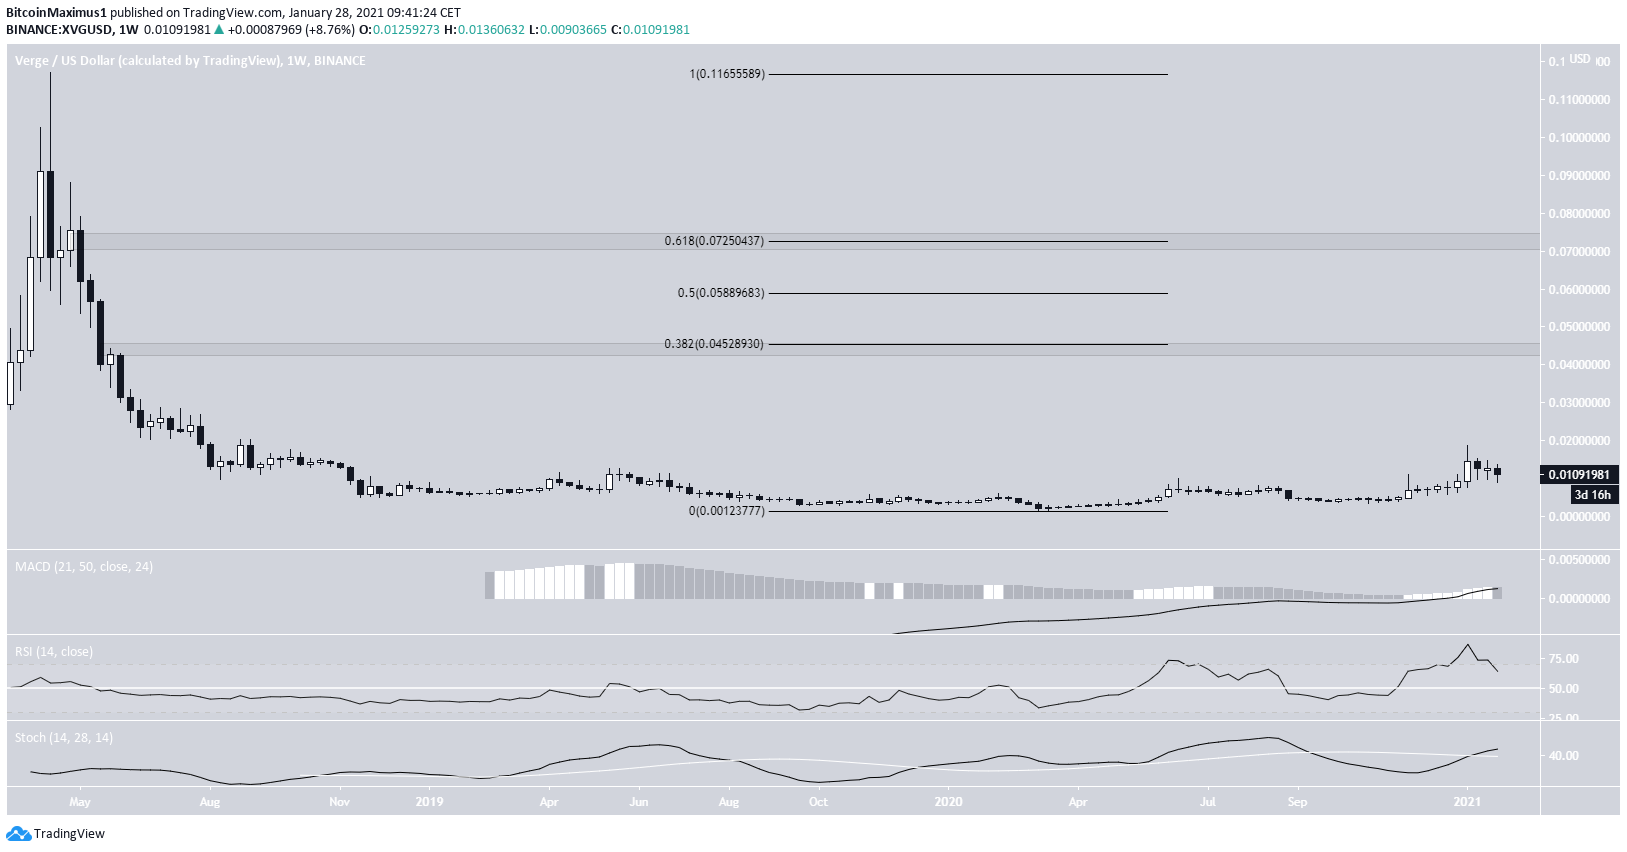
The most important resistances are at $0.045 and $0.072 (0.382 &and0.618 Fib retracement levels).
While technical indicators show a bullish trend, it will likely take time if XVG is to reach these resistance areas.
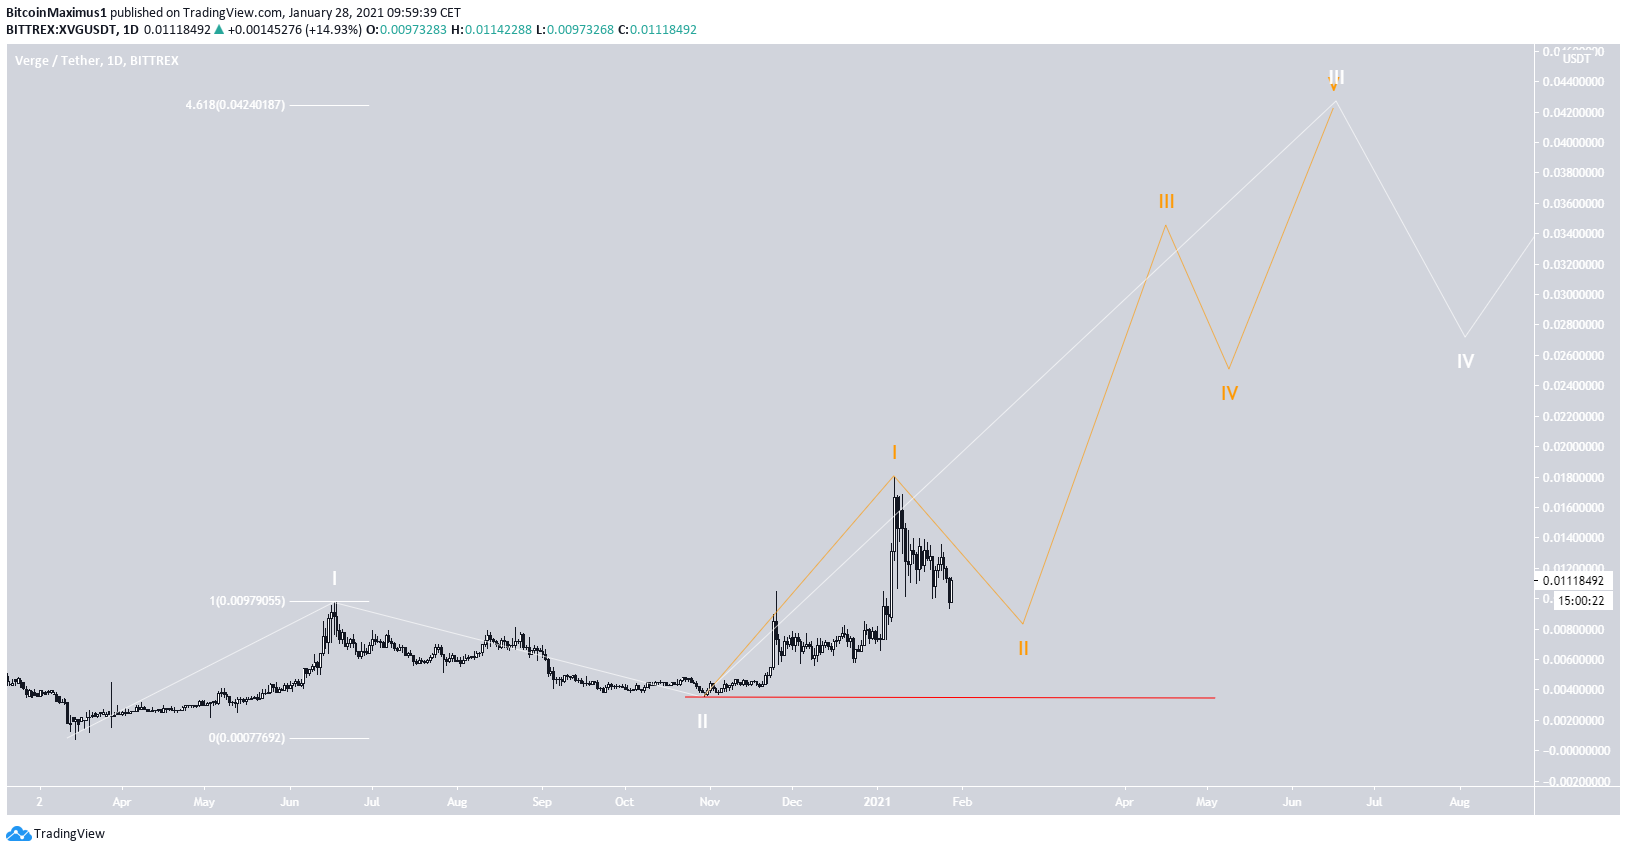
Wave Count
The wave count indicates that XVG could be in a large 1-2/1-2 wave count, though it’s not yet confirmed. It’s still too early to call this formation and the invalidation level is quite far away at the bottom of wave 2 (white) near $0.035 (red line).
In order for the formation to be confirmed, XVG would need to make a low near the current level and then break the aforementioned $0.018 high.
A possible target for the top of the longer-term wave 3 (white) is found at $0.042, coinciding with the aforementioned $0.045 resistance area.
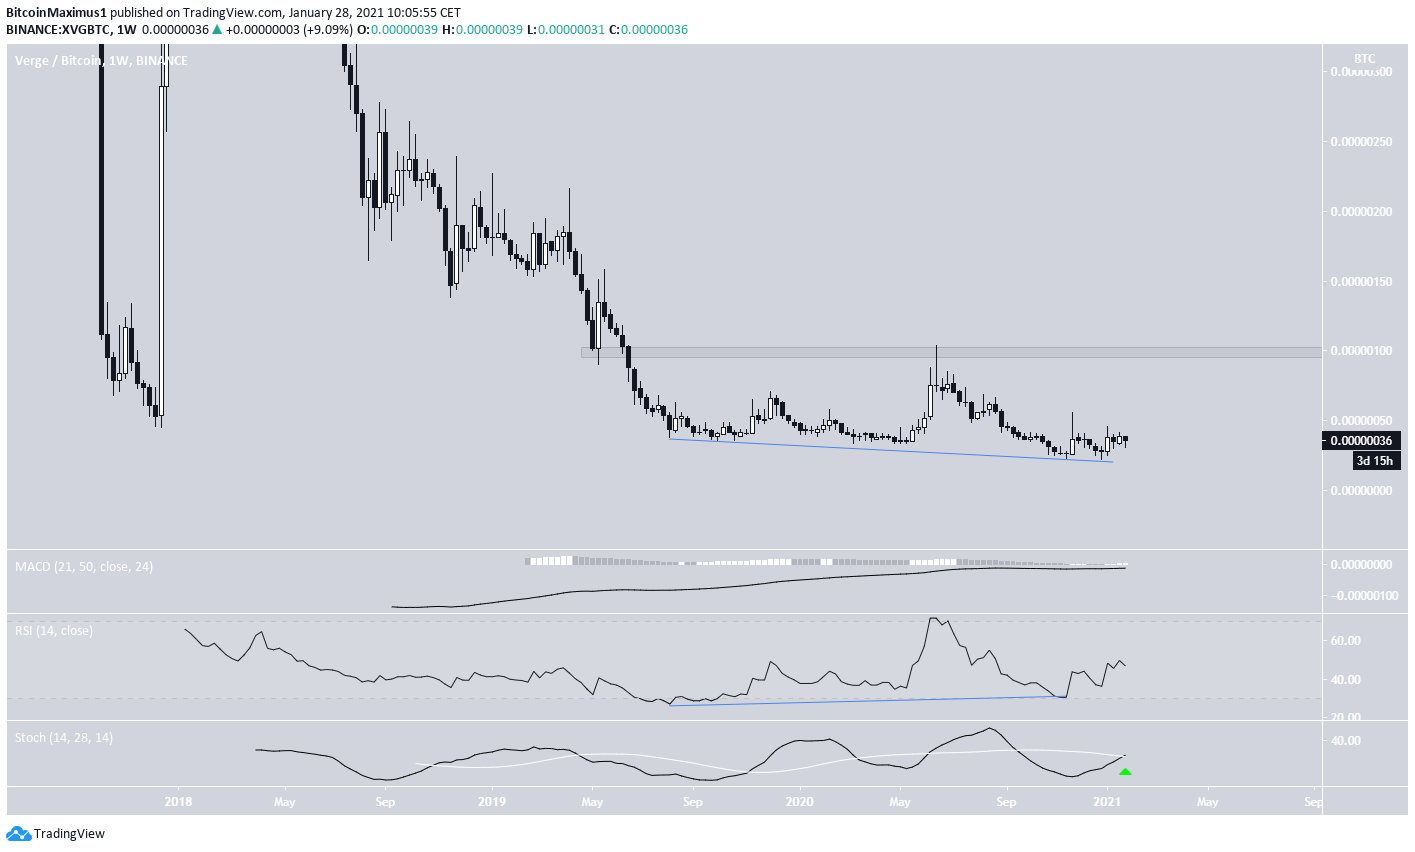
XVG/BTC
The XVG/BTC pair shows that despite being at an all-time low, there is a very considerable bullish divergence developing in the weekly RSI.
Alongside the bullish cross in the Stochastic oscillator and the increasing MACD, this suggests that a trend reversal is expected. Its first target would be the 100 satoshi resistance area.
Conclusion
Both XVG/USD and XVG/BTC are expected to move upwards toward their closest respective resistance areas. XVG/USD is expected to do so after retesting the breakout level, while it’s unclear when the move for XVG/BTC will begin.
For BeInCrypto’s latest Bitcoin (BTC) analysis click here
Trusted
Disclaimer
In line with the Trust Project guidelines, this price analysis article is for informational purposes only and should not be considered financial or investment advice. BeInCrypto is committed to accurate, unbiased reporting, but market conditions are subject to change without notice. Always conduct your own research and consult with a professional before making any financial decisions. Please note that our Terms and Conditions, Privacy Policy, and Disclaimers have been updated.
