

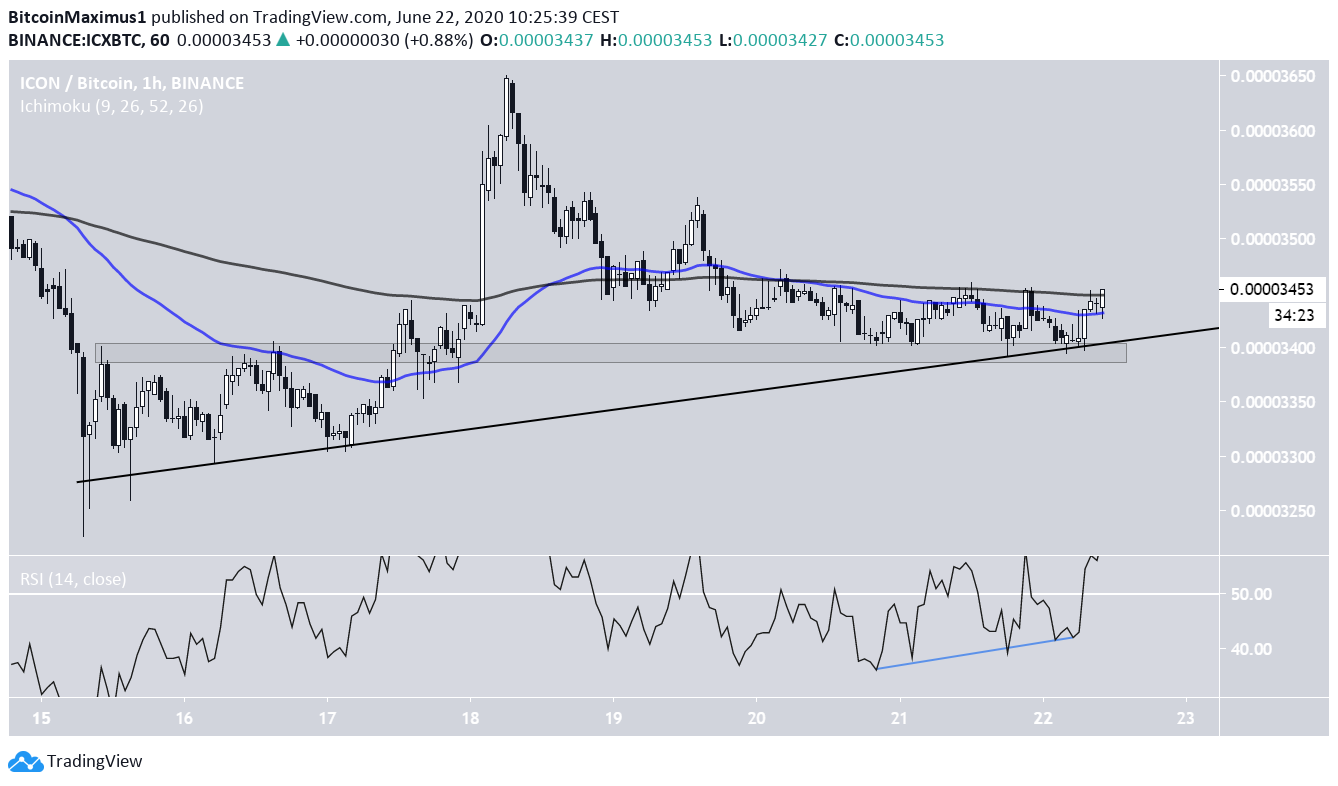
Both ICON (ICX) and Dusk Network (DUSK) have been retracing after completing upward moves.
The short-term patterns suggest a further reversal and continuation of the previous upward movements.
ICON (ICX)
The daily ICX chart shows that the price has been decreasing since reaching a high of 4,046 satoshis on May 26. However, it is possible that the price has finished correcting, as is evidenced by the bounce on the 0.618 Fib level on June 15, and the subsequent reclaim of the 0.5 Fib level along with the 100-day moving average (MA). The reclamation of the latter is especially important since this MA has intermittently been offering support and resistance to the price since the beginning of April.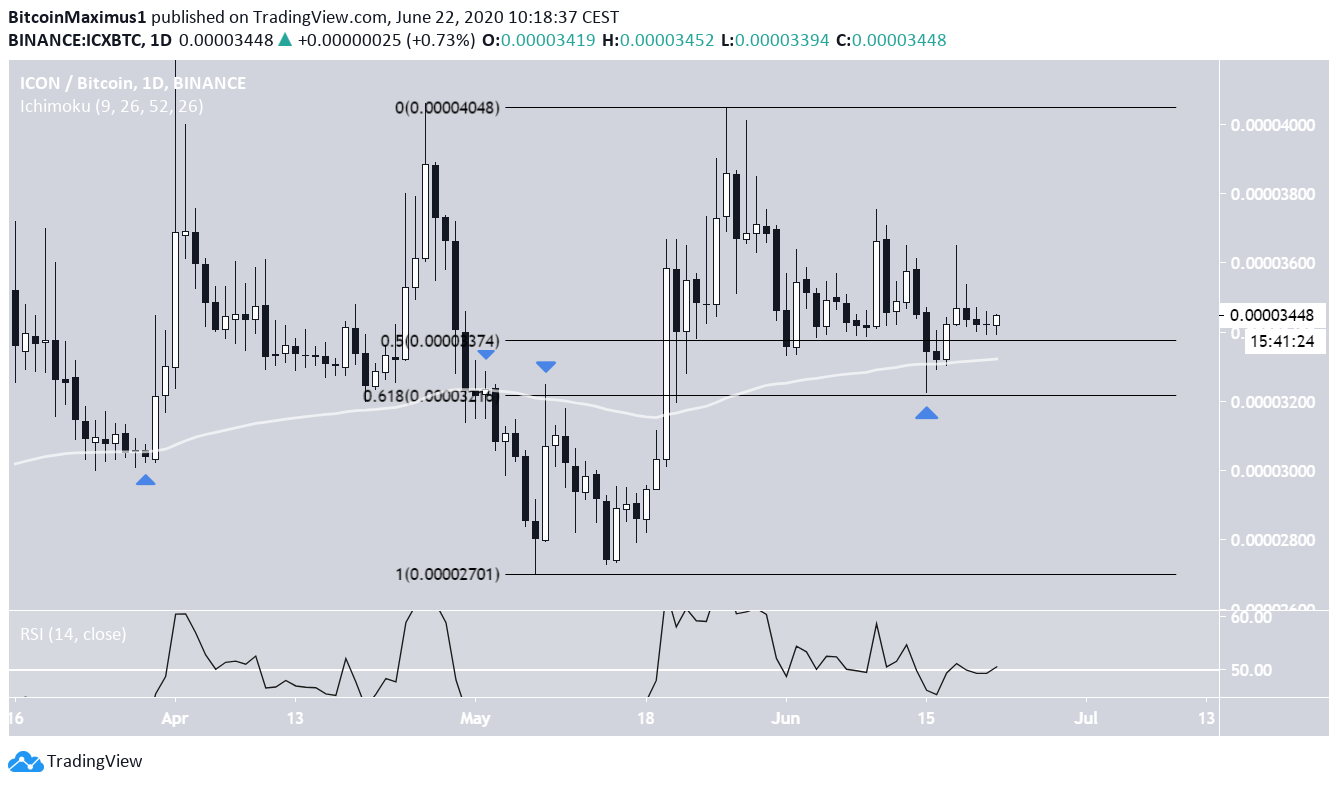
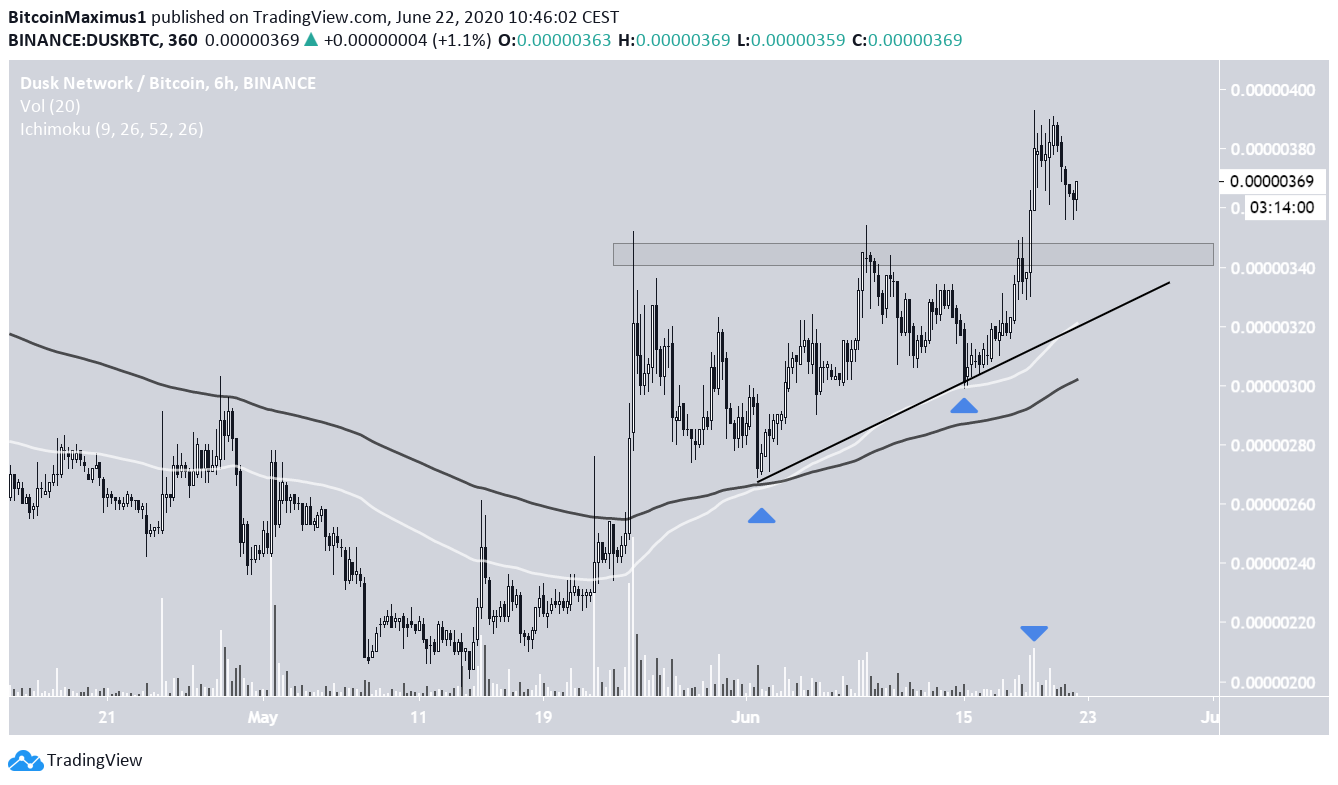
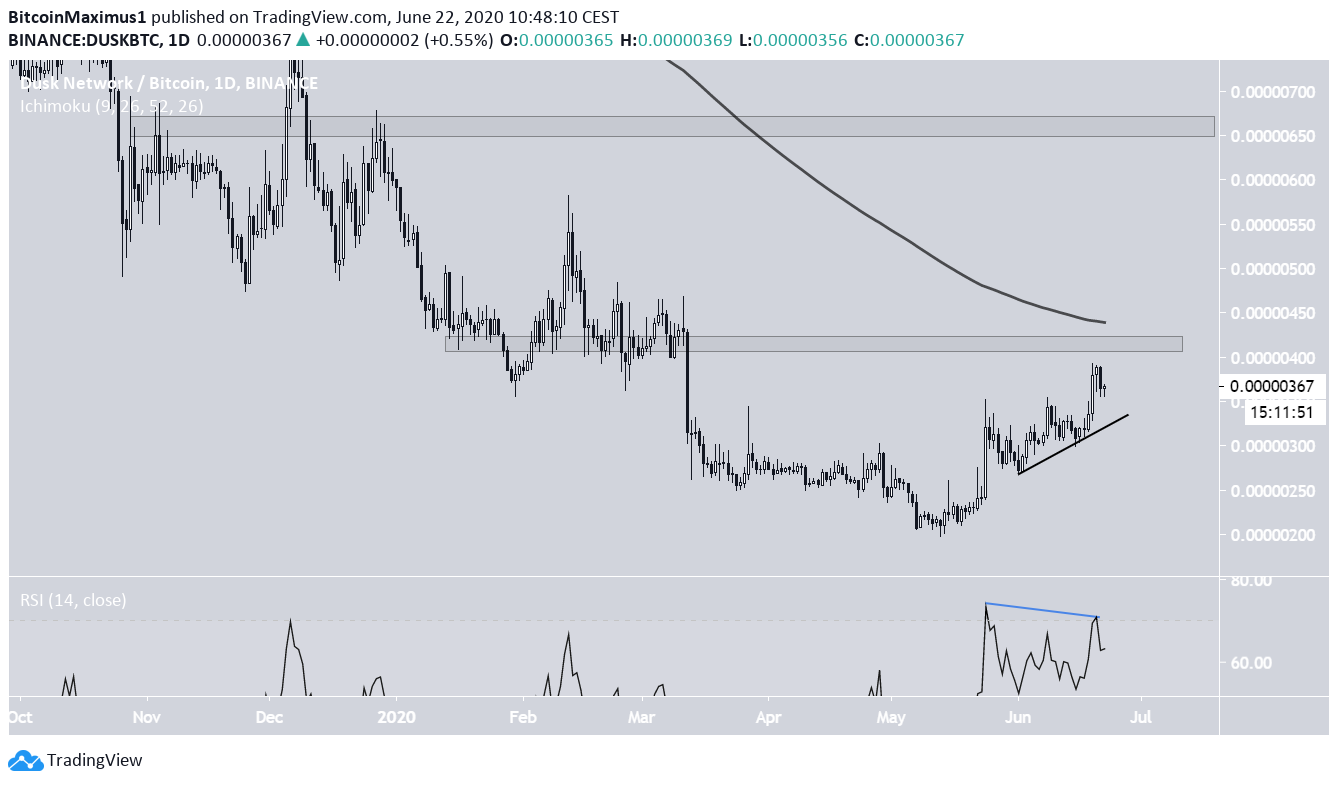
Dusk Network (DUSK)
Another coin with a similar setup to ICX is DUSK. Well-known trader @PostyXBT stated that the coin has completed its correction and is ready to continue its upward movement.We’ve been given the opportunity for a good entry here. Happy with my position. Much more relaxing with a clear invalidation level! R:R is ~5 here.Indeed, DUSK has previously broken out from the 345 satoshi resistance level, nearly reaching a high of 400 sats. The price has been decreasing since, however, and this 345 satoshi level is now likely to act as support. This theory is strengthened by the presence of the 100-day MA and the ascending support line.
Top crypto projects in the US | April 2024
Trusted
Disclaimer
In line with the Trust Project guidelines, this price analysis article is for informational purposes only and should not be considered financial or investment advice. BeInCrypto is committed to accurate, unbiased reporting, but market conditions are subject to change without notice. Always conduct your own research and consult with a professional before making any financial decisions. Please note that our Terms and Conditions, Privacy Policy, and Disclaimers have been updated.

Valdrin Tahiri
Valdrin discovered cryptocurrencies while he was getting his MSc in Financial Markets from the Barcelona School of Economics. Shortly after graduating, he began writing for several different cryptocurrency related websites as a freelancer before eventually taking on the role of BeInCrypto's Senior Analyst.
(I do not have a discord and will not contact you first there. Beware of scammers)
READ FULL BIO
Sponsored
Sponsored