

Let’s take a closer look at the movement of both these coins and determine if they will reach their targets.Current ACTIVE #altcoin trades right now: $WAVES and trying to enter in $OMG. I'm also in many big cap $ALTS that I haven't really touched a ton for weeks now and am up comfortably on all of them. Still believe the alt market is bullish and plan on hodling for a bit longer. pic.twitter.com/GT8kKrFXvN
— Altcoin Sherpa (@AltcoinSherpa) February 17, 2020
OmiseGO (OMG)
The OMG price has been increasing since January 9, at one point having done so by 79%. The current price is 46% higher than that on January 9. The price is trading above both the 50- and 200-day moving averages (MA), which are very close to making a bullish cross. In the future, it is expected that the price will use them as support. The main support area is found at 11,000 satoshis. Once the price reached it on February 17, it created a bullish hammer, which is considered a reversal candlestick.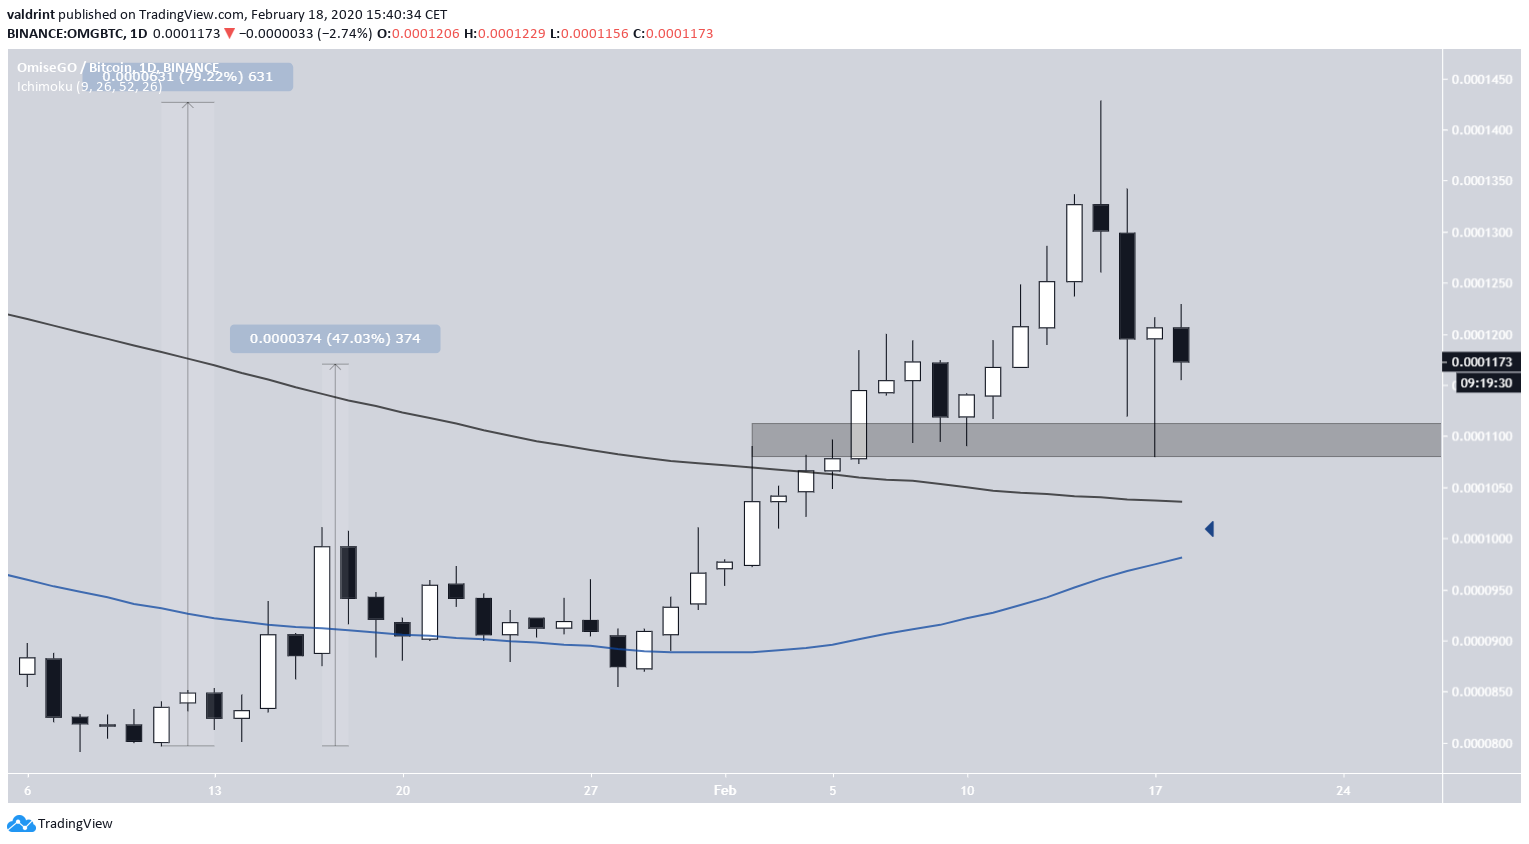 As long as the price stays above this support area, its future outlook remains bullish.
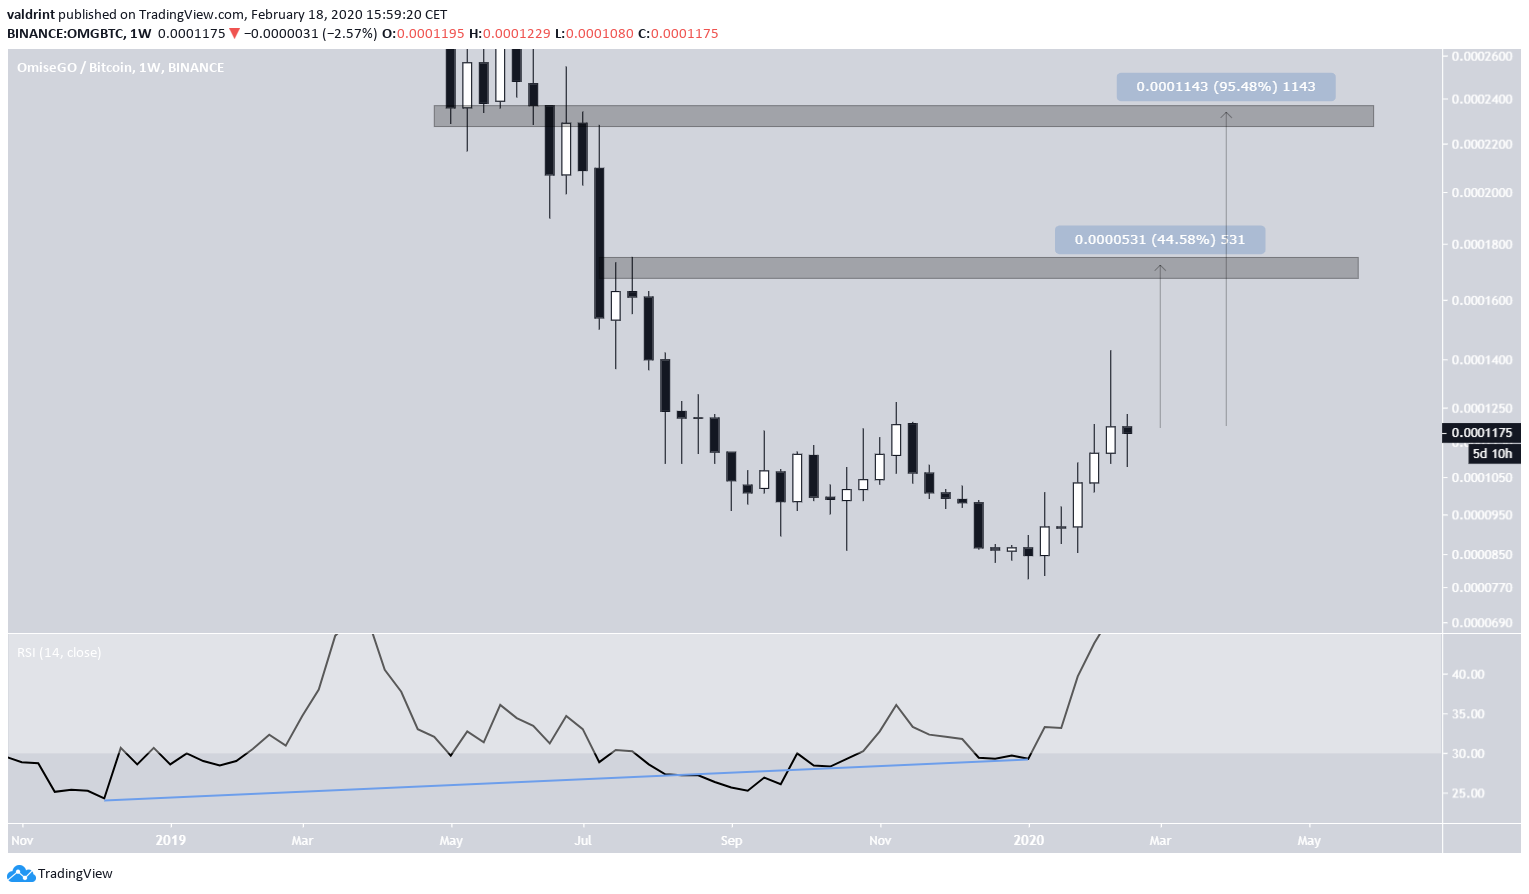
This is because the long-term chart looks extremely bullish. The weekly RSI has been generating bullish divergence for more than a year.
If the price continues moving upwards, the first target is found at 17,500 satoshis, as stated in the tweet, while the second one at 23,000 satoshis. Therefore, the ensuing price increase could cause OMG to post gains of 95%, if the price reaches the second target.
As long as the price stays above this support area, its future outlook remains bullish.
This is because the long-term chart looks extremely bullish. The weekly RSI has been generating bullish divergence for more than a year.
If the price continues moving upwards, the first target is found at 17,500 satoshis, as stated in the tweet, while the second one at 23,000 satoshis. Therefore, the ensuing price increase could cause OMG to post gains of 95%, if the price reaches the second target.
OmiseGO (OMG) Highlights
- There is support at 11,000 satoshis.
- The price is trading above significant daily moving averages.
- There is resistance at 17,500 and 23,000 satoshis.
- The weekly RSI is bullish.
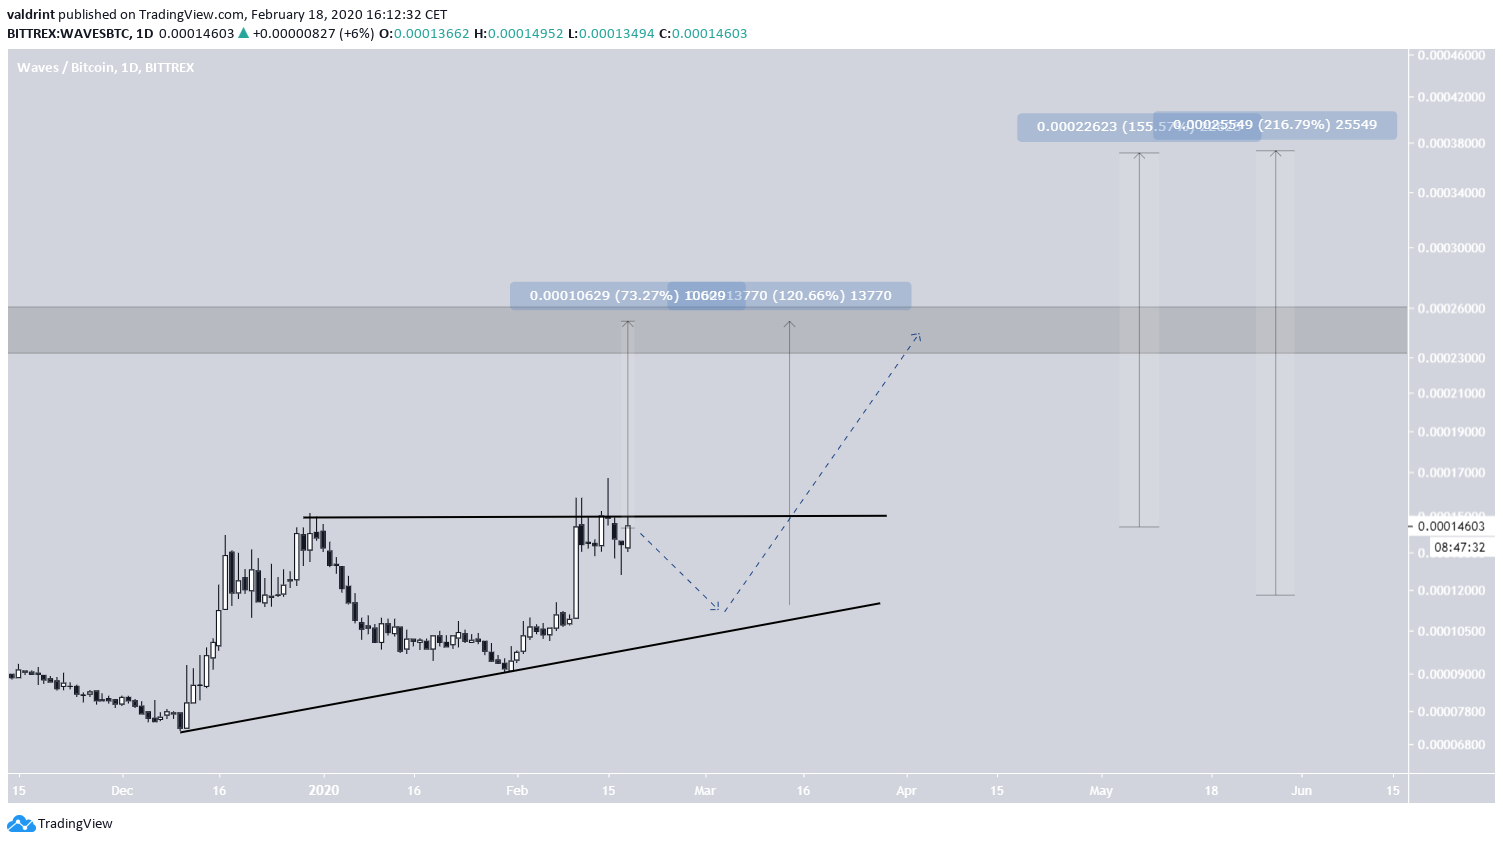
Waves (WAVES)
The most important area for the WAVES price is found at 25,000 satoshis. Once the price broke down from this area in June 2019, the rate of decrease greatly accelerated, leading to the all-time low price of 7185 satoshis reached in December 2019. However, there are strong reversal signs. The weekly RSI has generated bullish divergence. It has only done so once prior, and an upward move with a magnitude of 433% followed. If the same were to happen now, the price would break out above the 25,000 satoshi resistance and reach 37,000 satoshis.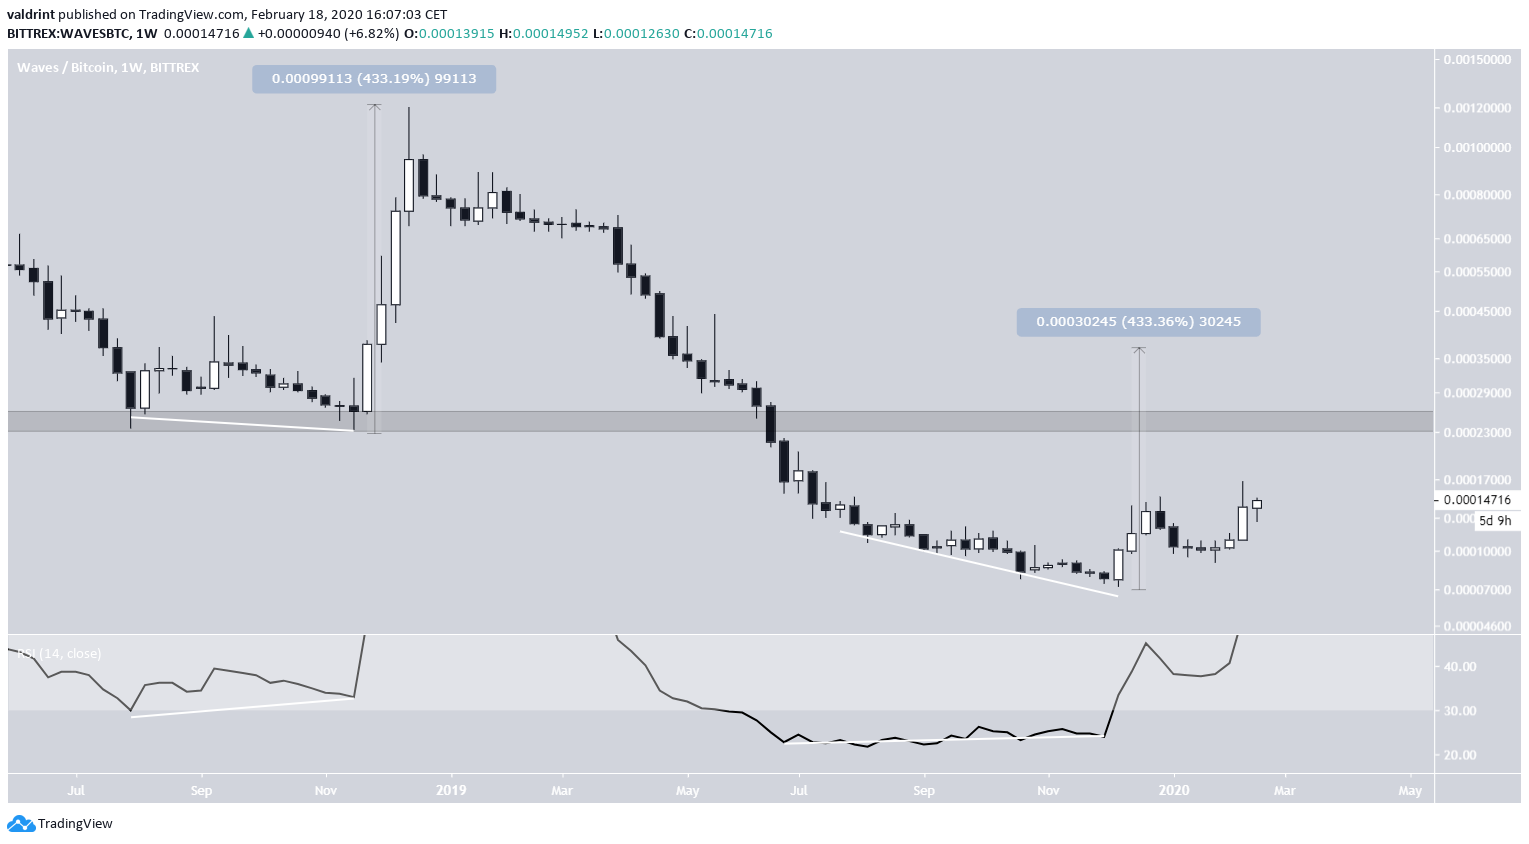 The daily chart shows that the WAVES price is possibly trading inside an ascending triangle, having currently reached the resistance area of this pattern.
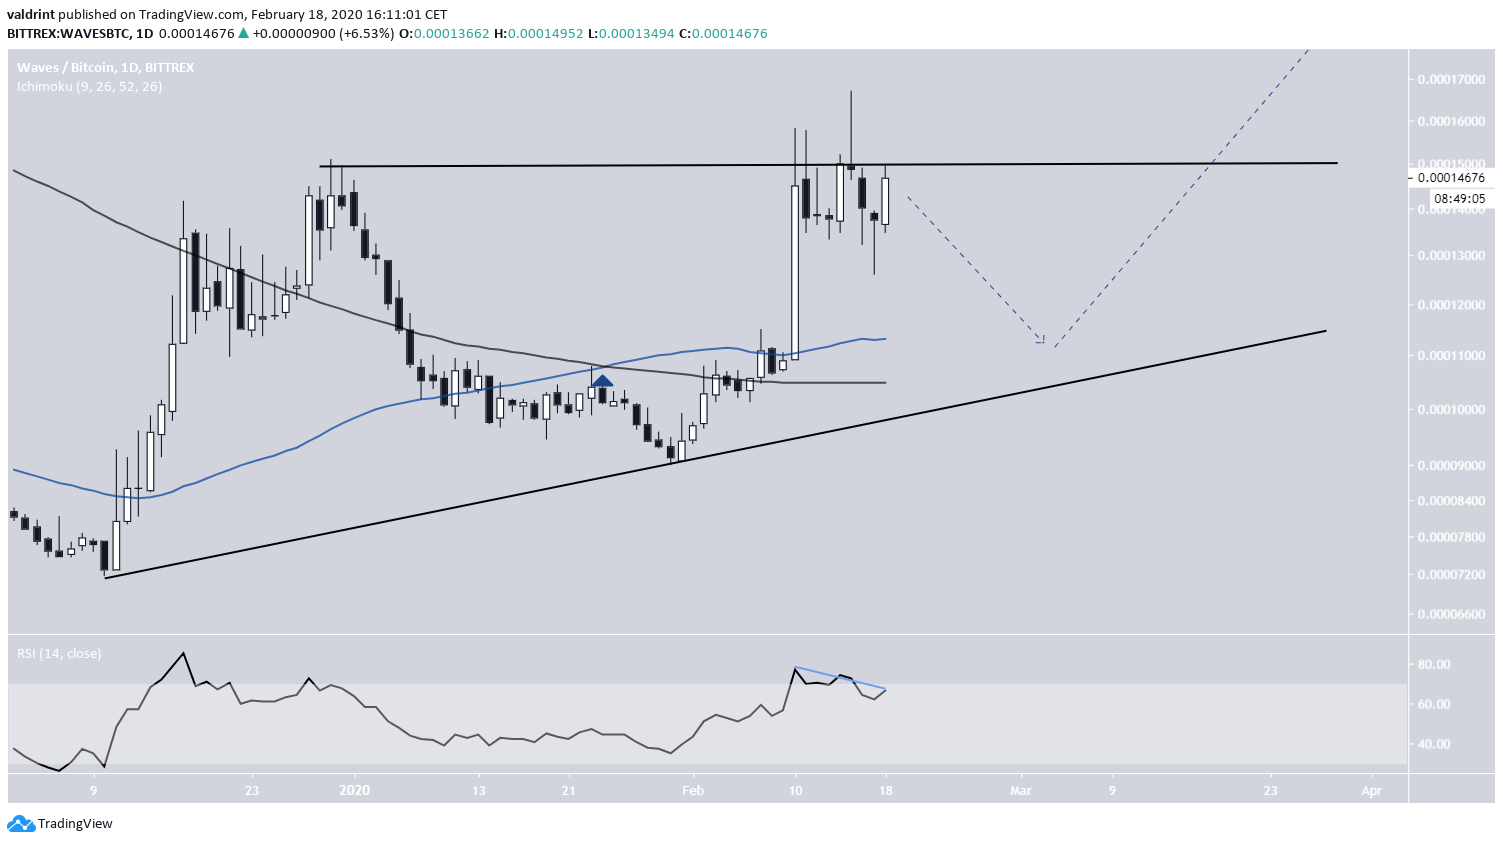
While a bullish cross has transpired between the 50- and 200-day MAs, the price is above these MAs, thus being unable to use them as support unless it decreases substantially.
There is some bearish divergence being generated in the daily RSI, which is into oversold territory. This makes a price decrease towards the MAs/Support line the most likely scenario. Afterward, a breakout is expected.
The daily chart shows that the WAVES price is possibly trading inside an ascending triangle, having currently reached the resistance area of this pattern.
While a bullish cross has transpired between the 50- and 200-day MAs, the price is above these MAs, thus being unable to use them as support unless it decreases substantially.
There is some bearish divergence being generated in the daily RSI, which is into oversold territory. This makes a price decrease towards the MAs/Support line the most likely scenario. Afterward, a breakout is expected.
 An upward move to the first target would be an increase of 73% from the current price and 125% if the price decrease to the support line first then breaks out, which would present the optimal level to enter the trade.
The second target would be an 155% increase from the current price and an increase of 216% if the price first decreases to the support line.
An upward move to the first target would be an increase of 73% from the current price and 125% if the price decrease to the support line first then breaks out, which would present the optimal level to enter the trade.
The second target would be an 155% increase from the current price and an increase of 216% if the price first decreases to the support line.
Waves (WAVES) Highlights
- There is resistance at 25,00 satoshis.
- The weekly RSI has generated bullish divergence.
- The price is trading inside an ascending triangle.
- A golden cross has transpired.
Trusted
Disclaimer
In line with the Trust Project guidelines, this price analysis article is for informational purposes only and should not be considered financial or investment advice. BeInCrypto is committed to accurate, unbiased reporting, but market conditions are subject to change without notice. Always conduct your own research and consult with a professional before making any financial decisions. Please note that our Terms and Conditions, Privacy Policy, and Disclaimers have been updated.
