

Tron (TRX) vs. Binance Coin (BNB): Price Outlook
On Dec 17, 2018, the price of TRX began a rapid upward movement. It reached a high of $0.035 on Jan 10, 2019. A gradual decrease followed. A horizontal support line is traced at $0.0217 and while a horizontal resistance line is traced at $0.315. Together, these generate the horizontal channel outlined in the graph below: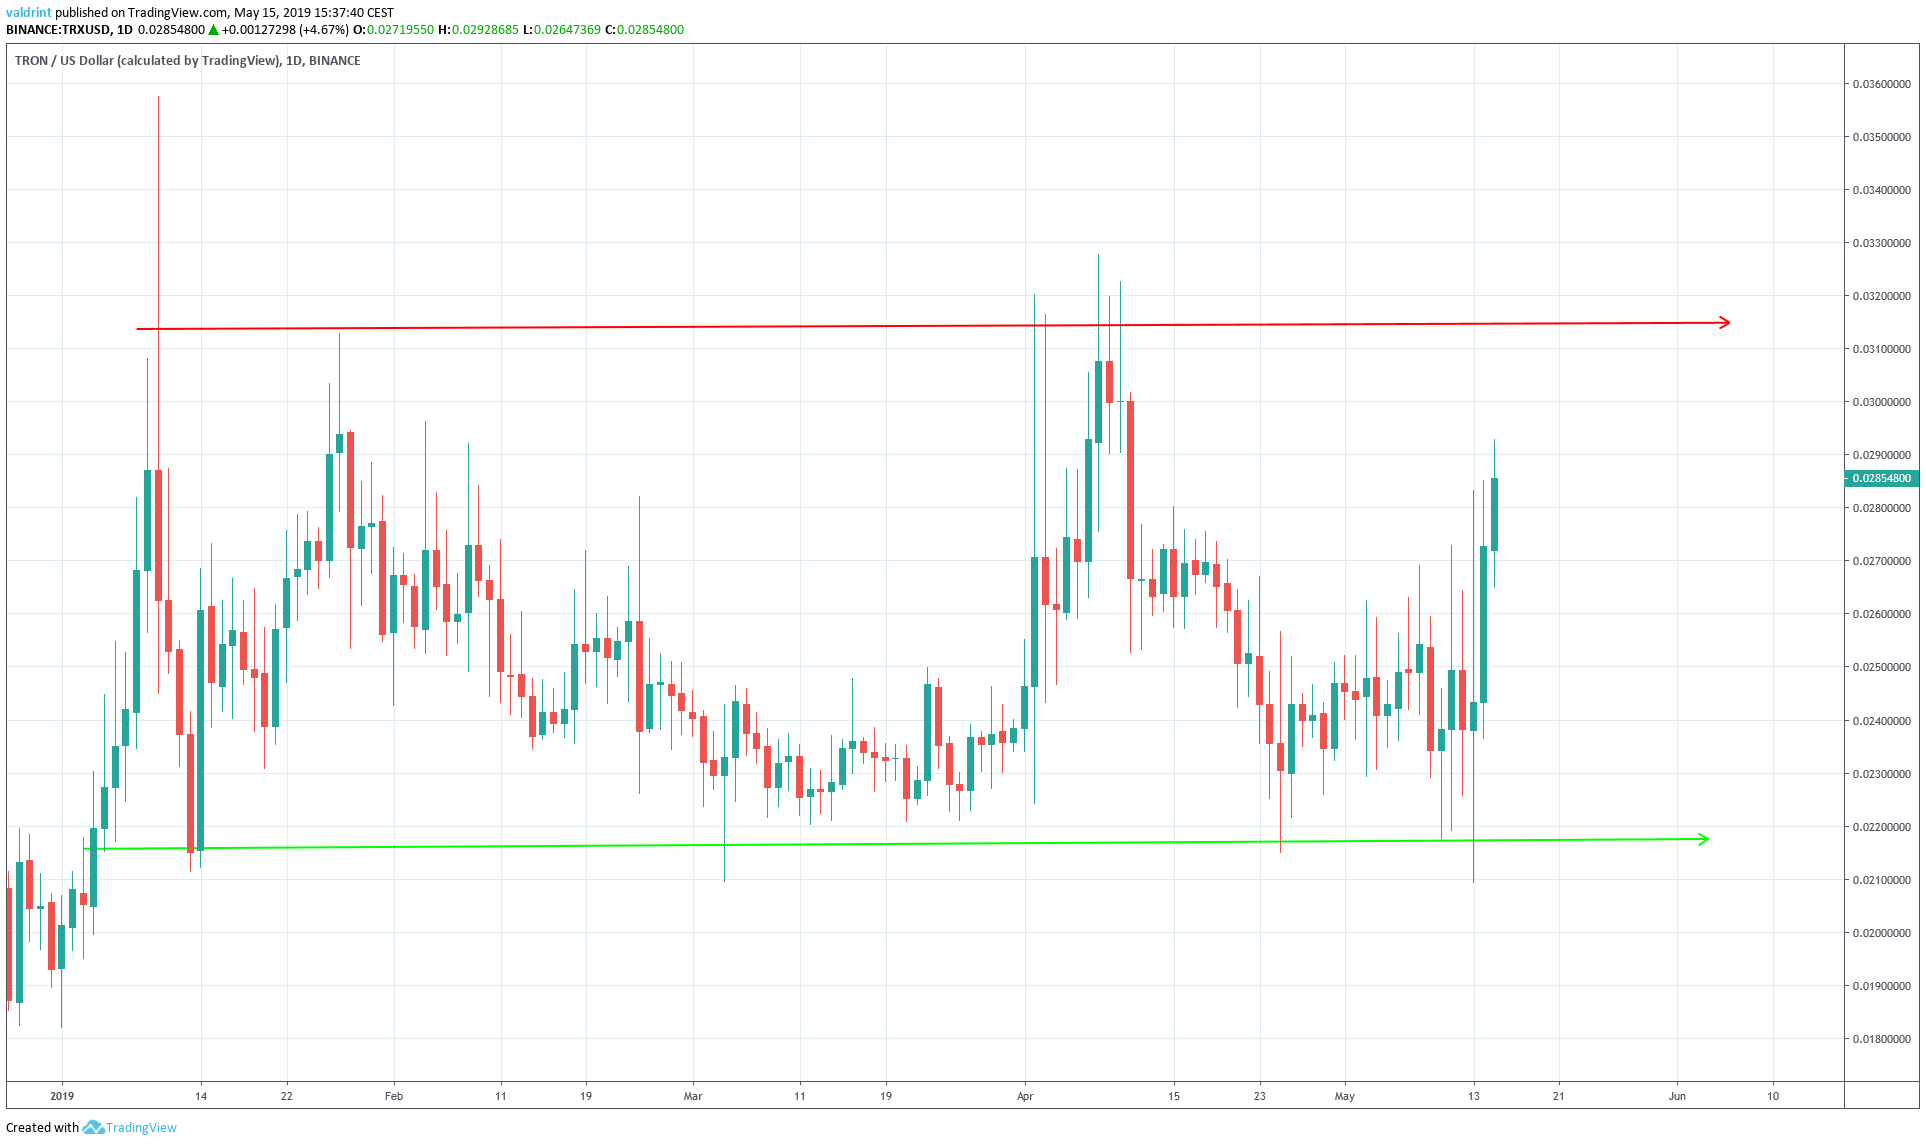 The price has touched the resistance and the support lines of the channel three and four times respectively.
On May 11, after touching the support line, the price began an increase towards the resistance line of the channel.
Last week we initiated a long trade with an average entry of $0.023 and a target of $0.03. The price is very close to reaching our target. We will analyze this trade in more detail in the sections below.
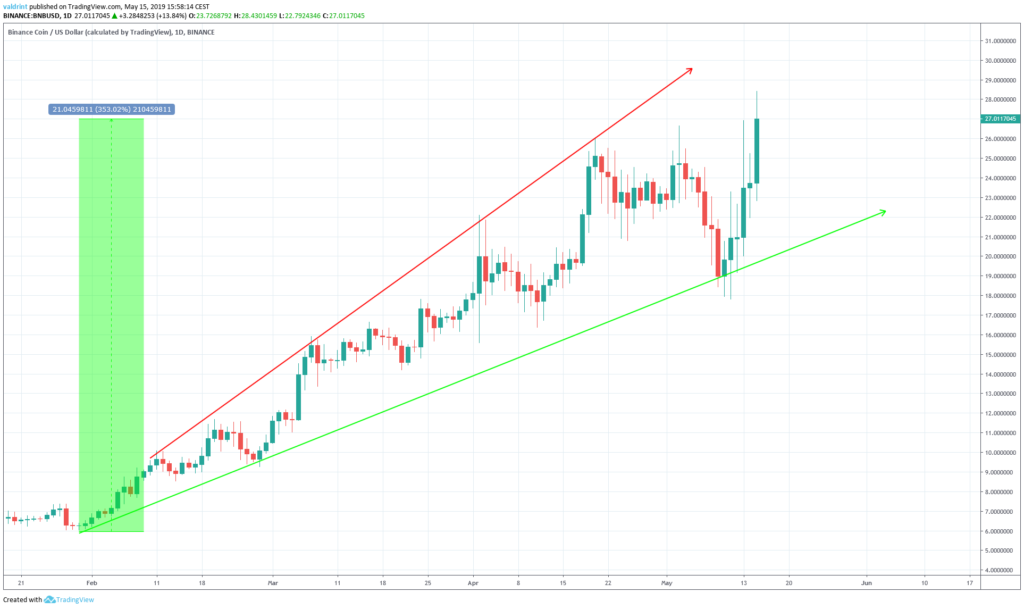
The price of BNB, however, is trading in a different pattern. After reaching a low of $6.03 on Jan 10, Binance Coin began an upward movement.
It has since been trading inside a broadening ascending wedge:
The price has touched the resistance and the support lines of the channel three and four times respectively.
On May 11, after touching the support line, the price began an increase towards the resistance line of the channel.
Last week we initiated a long trade with an average entry of $0.023 and a target of $0.03. The price is very close to reaching our target. We will analyze this trade in more detail in the sections below.
The price of BNB, however, is trading in a different pattern. After reaching a low of $6.03 on Jan 10, Binance Coin began an upward movement.
It has since been trading inside a broadening ascending wedge:
Tron’s Short-Term Ascending Channel
In the case of TRX, the price is trading inside a short-term ascending channel. It has been doing so since May when a high of $0.025 and a low of $0.023 were reached. The channel is shown in the graph below: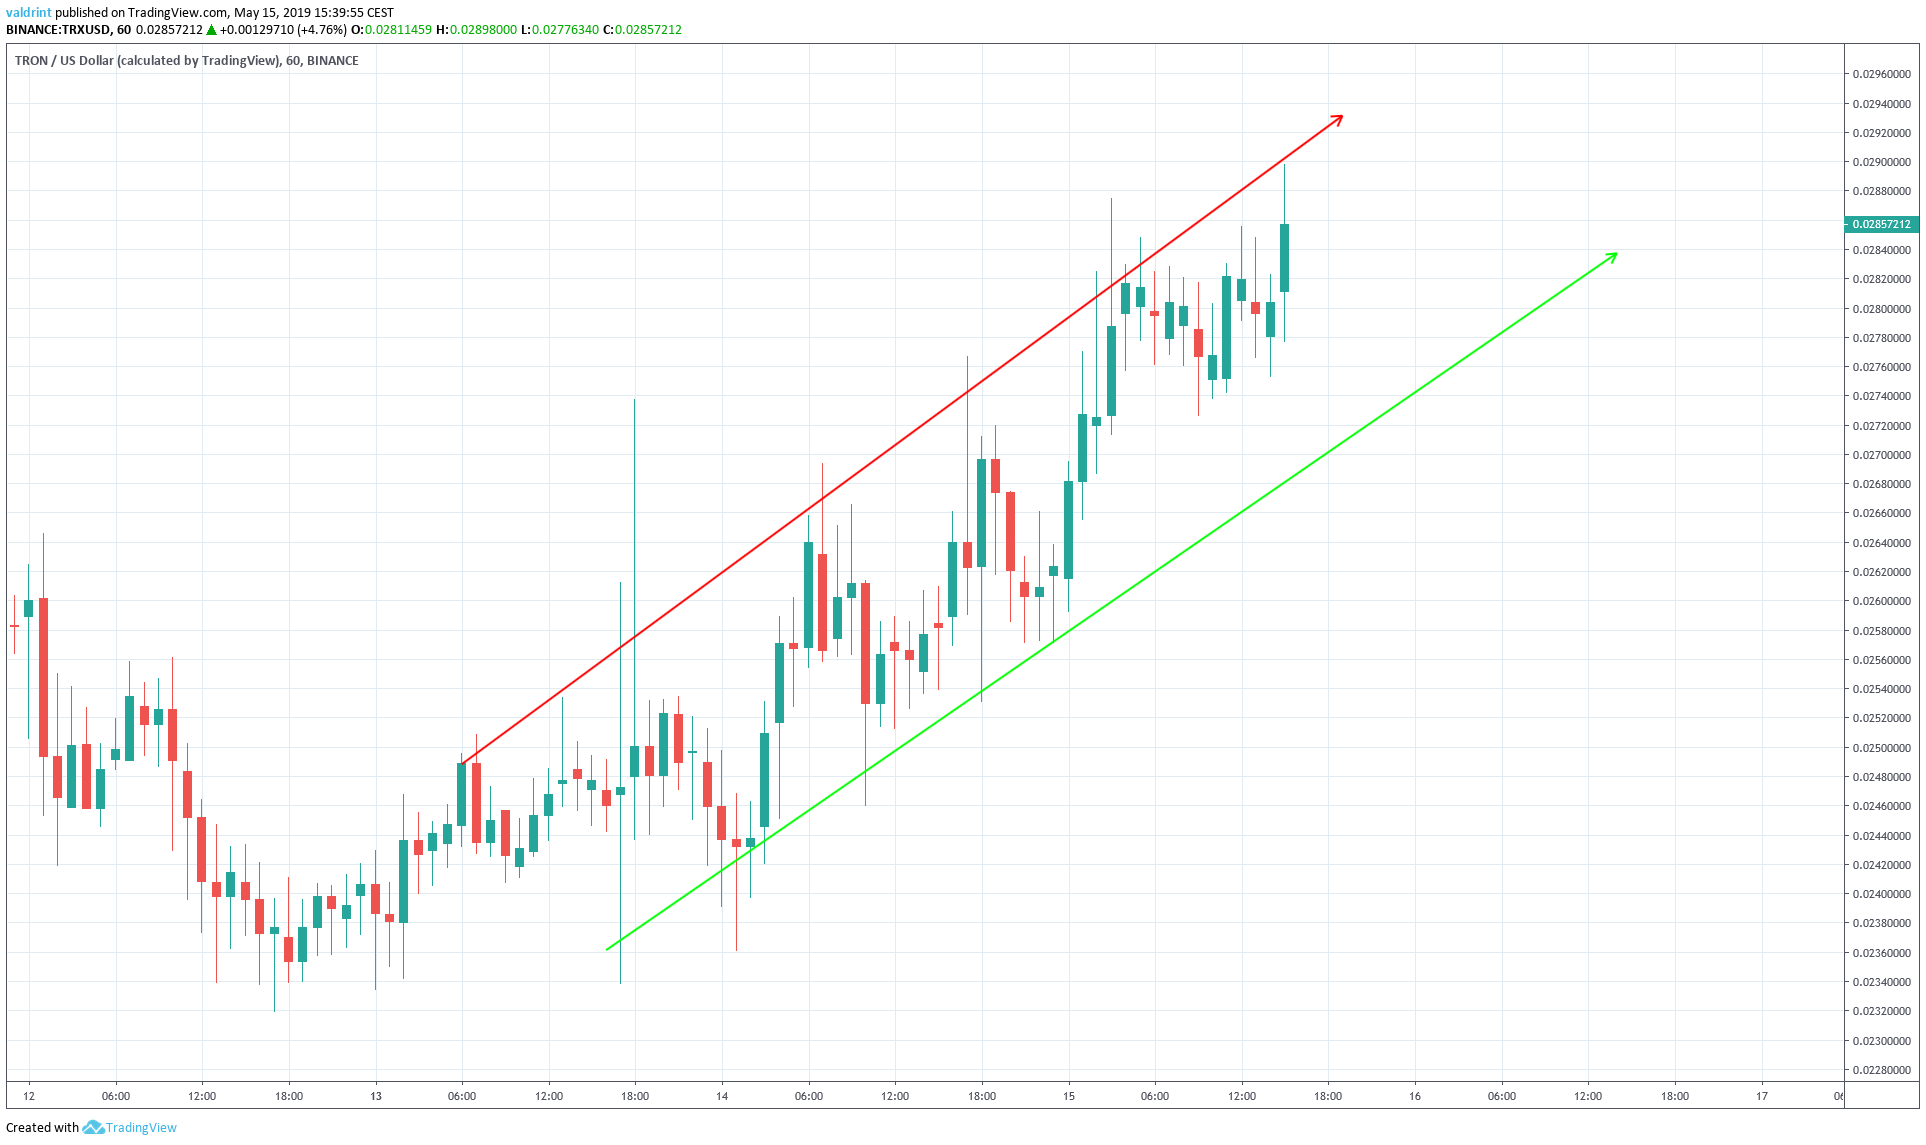
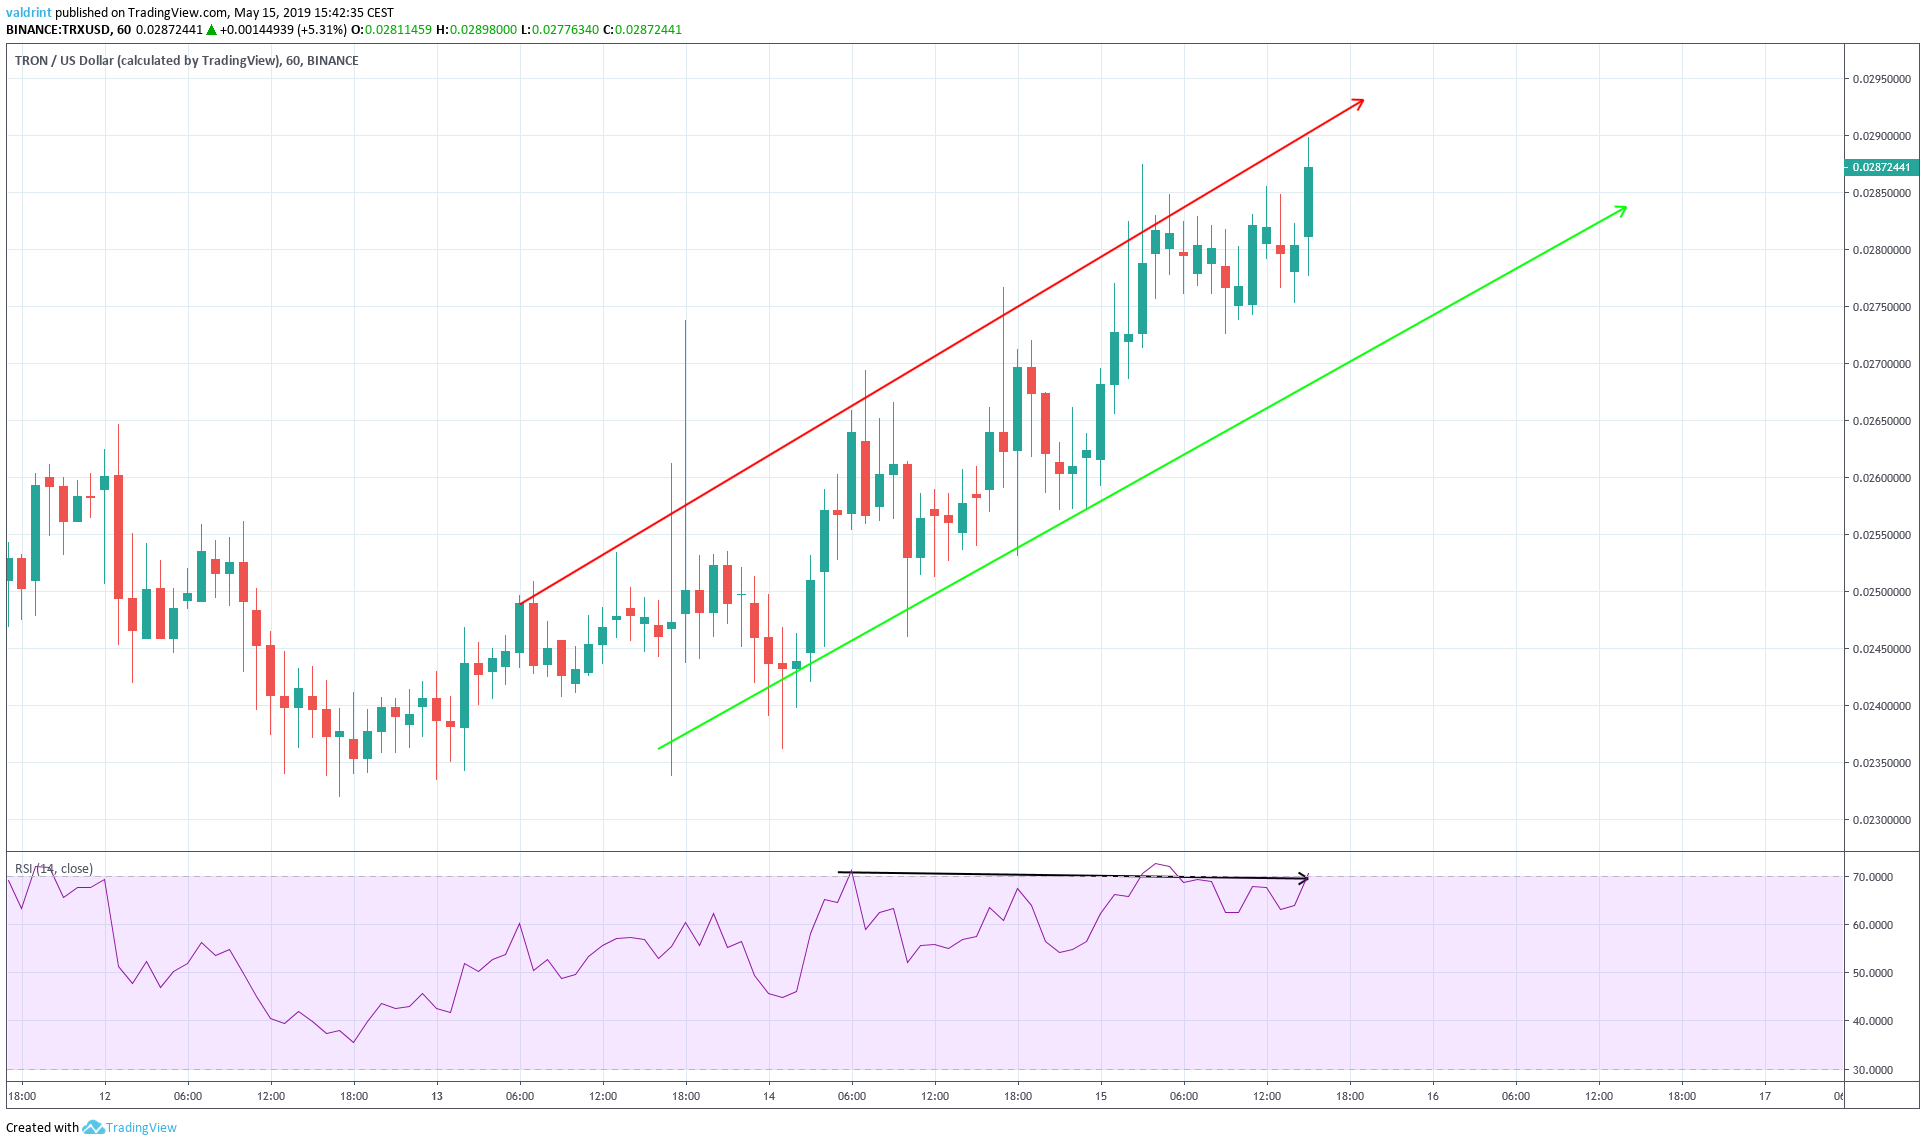 On May 14, the price reached a high of $0.0265. It continued to increase and reached a high of $0.0288 the next day.
Since reaching a high on May 14, however, the RSI has generated lower values.
This is known as bearish divergence and often precedes price decreases, but the decrease is not very significant in value and is only occurring in short-term timeframes.
Nonetheless, we are able to move the stop loss defined in our analysis further upward.
In our long trade setup, we stated that :
On May 14, the price reached a high of $0.0265. It continued to increase and reached a high of $0.0288 the next day.
Since reaching a high on May 14, however, the RSI has generated lower values.
This is known as bearish divergence and often precedes price decreases, but the decrease is not very significant in value and is only occurring in short-term timeframes.
Nonetheless, we are able to move the stop loss defined in our analysis further upward.
In our long trade setup, we stated that :
“We are going to analyze a possible trade setup with an average entry of $0.023. The stop-loss is placed well below the support line and slightly below the Mar 4 wick low at $0.0207. This is a stop loss of 10%. “Because of recent market movement, we can move the stop loss below $0.026, for a profit of 10%. Our main target is set at $0.03. Since the price is close to reaching our target and the stop loss also presents a profit, we will consider this trade closed and will not refer to it in future analyses. Now, let’s take a look at the short-term trading pattern for Binance Coin.
Binance Coin’s Descending Channel
On May 10, the price of BNB reached an hourly high of $19.8. A decrease ensued, and the price reached a low of $18.4 the next day. Since then, it has been trading inside the ascending channel outlined below: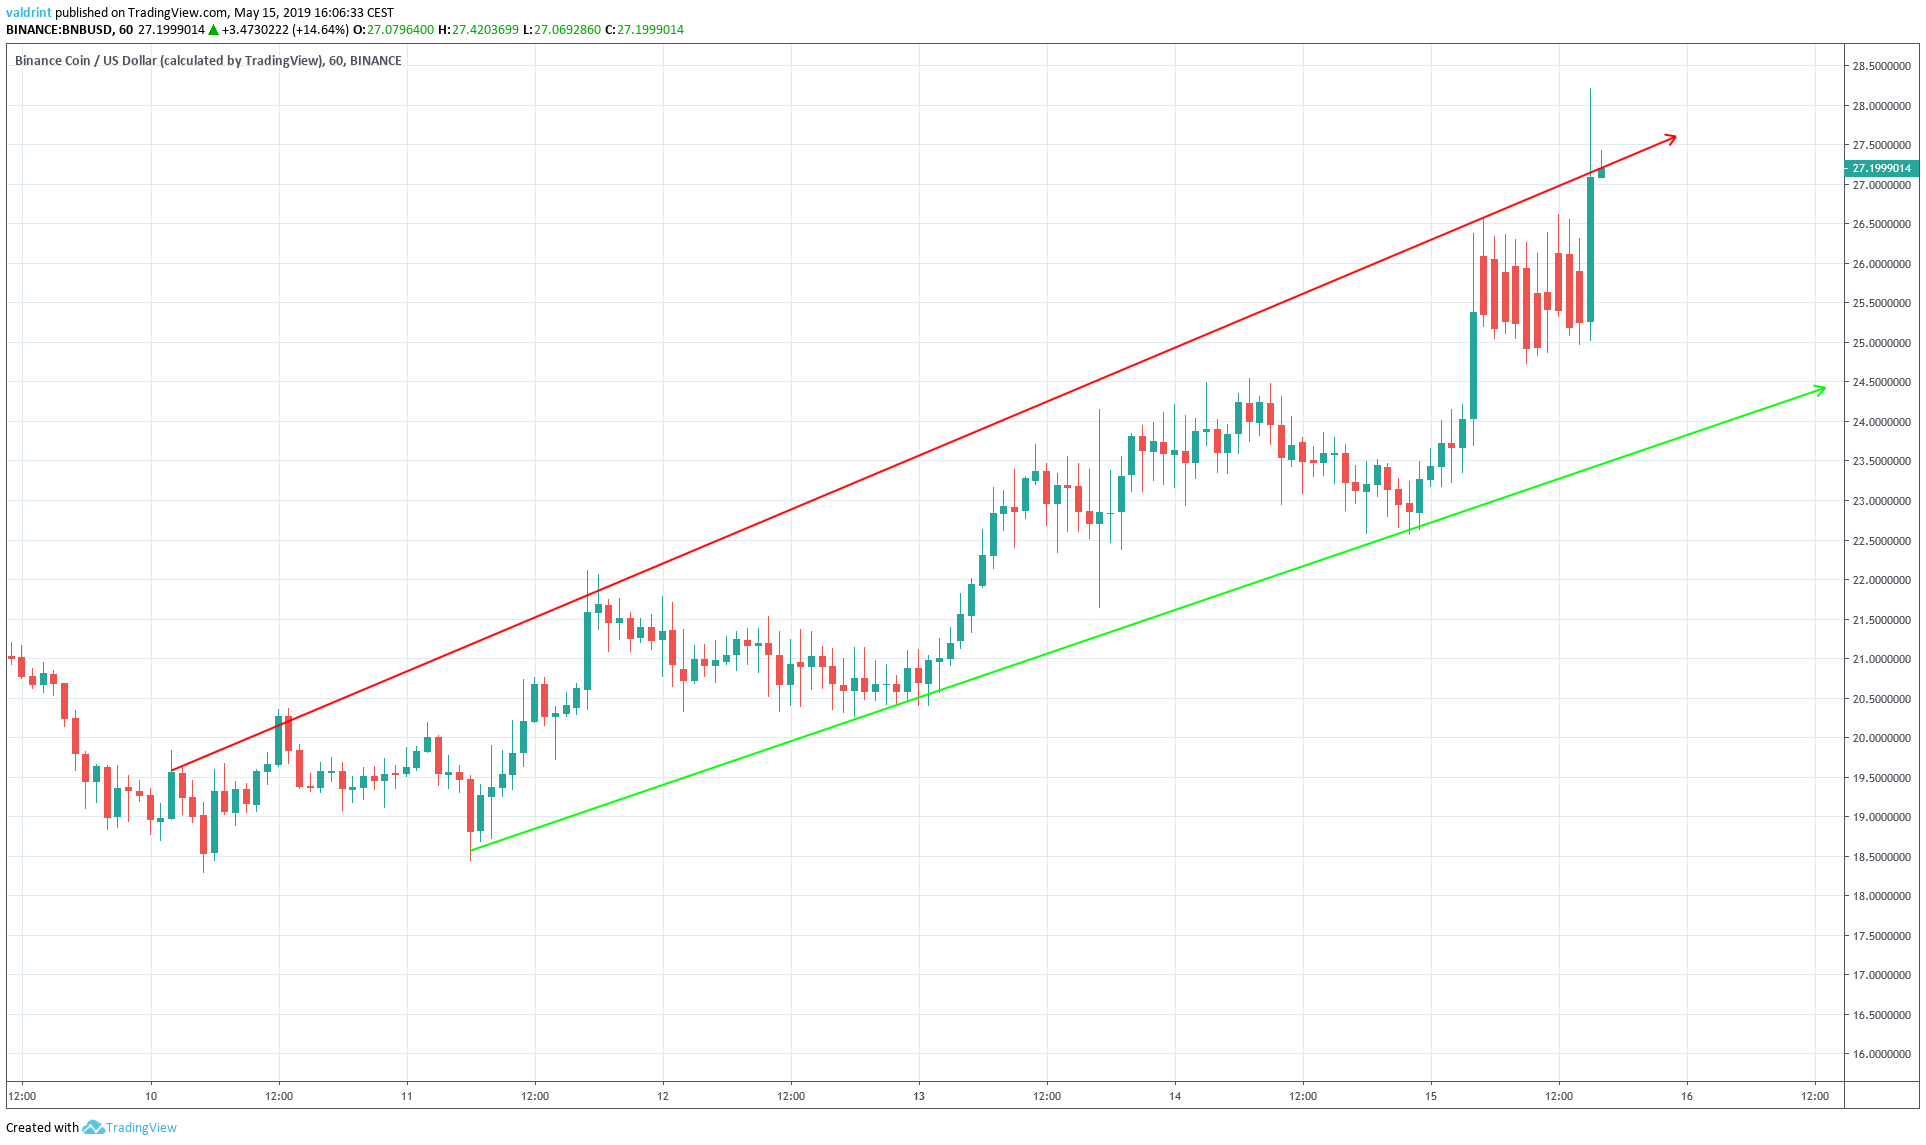
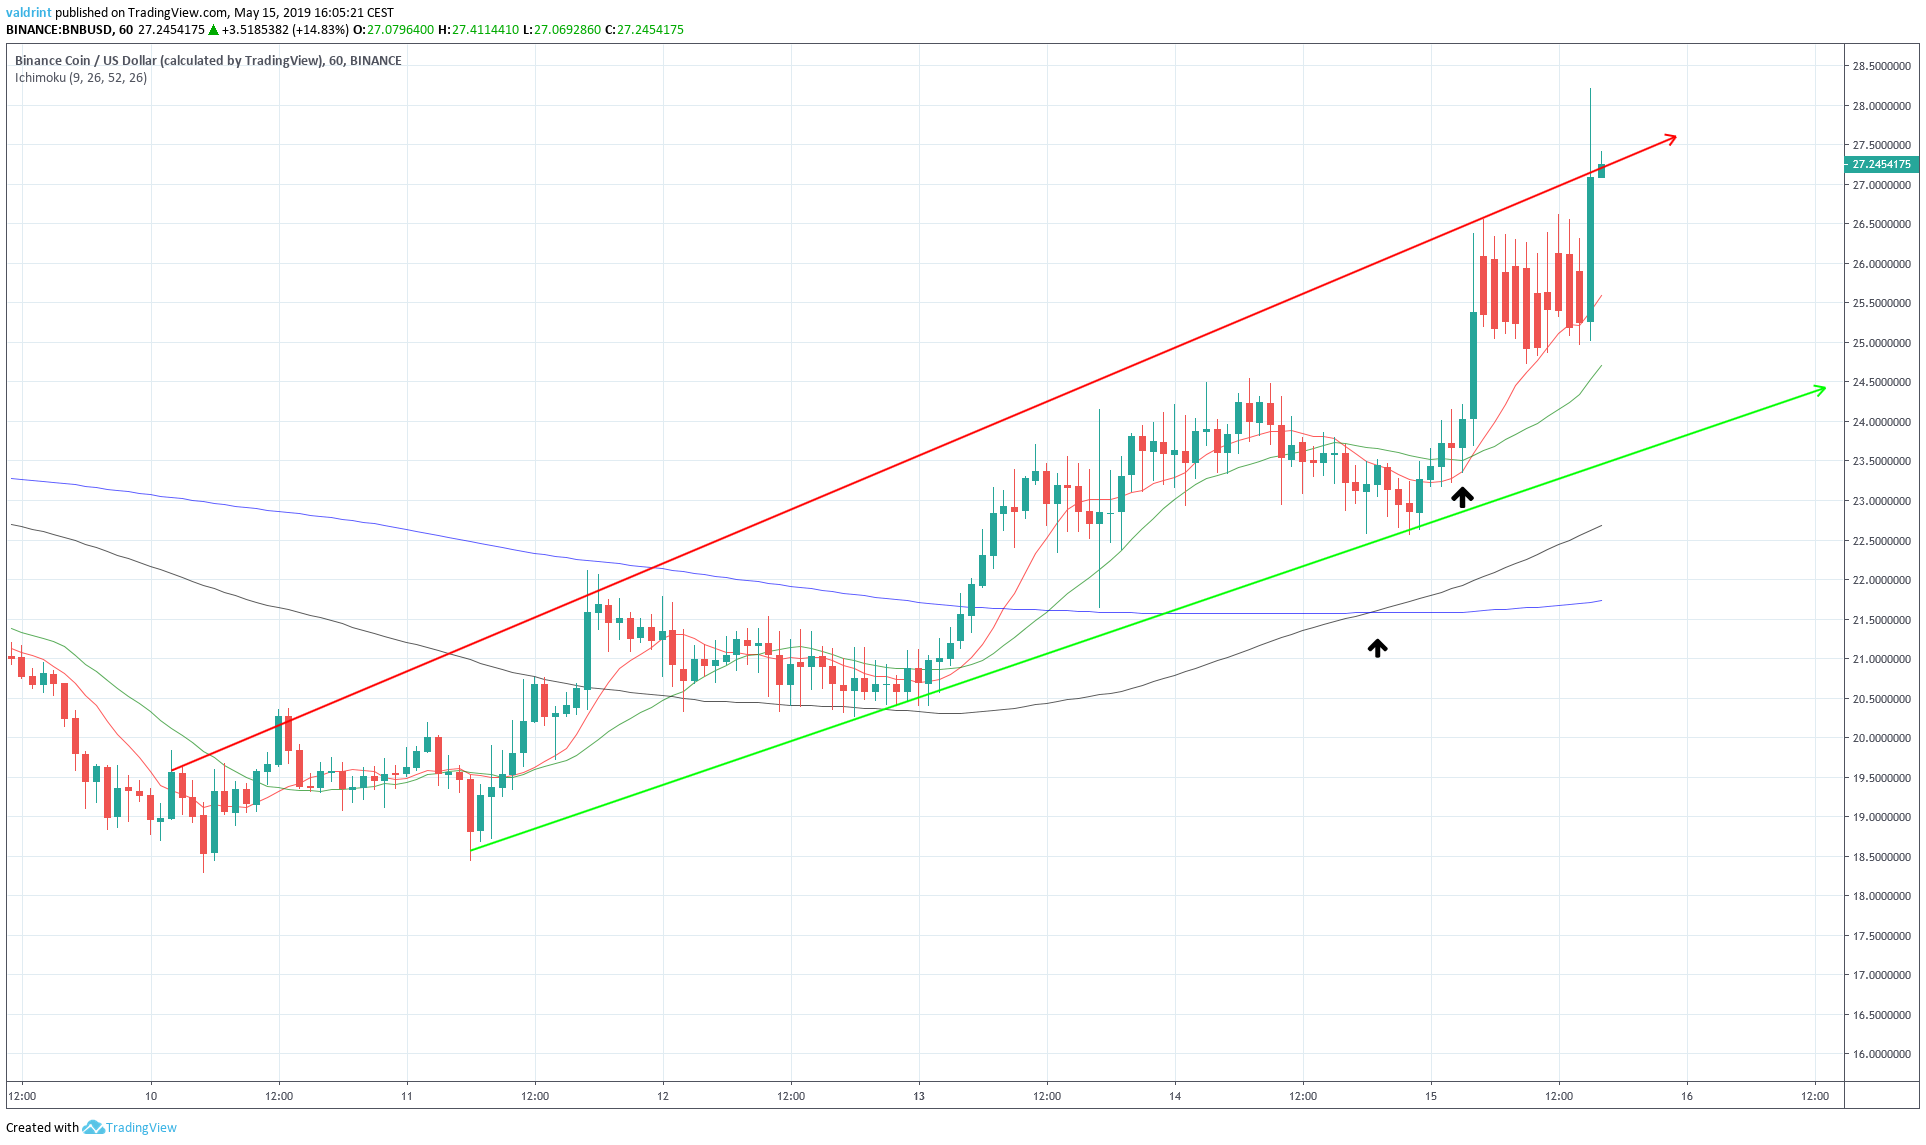
We can see that the price is trading above all four of the MAs. A bullish cross between the 100- and 200-period MAs occurred on May 14, and one between the 10- and 20-period ones the next day.
This might indicate that an uptrend has begun. The use of these indicators makes it more likely that the price will break out of the channel. It is possible that the price will increase towards the resistance line of the broadening wedge outlined in the first section. If the price reaches the resistance line, we will assess a possible short trade setup. Until then, we do not see any profitable trade setups.Conclusion
To conclude, TRX is trading inside a long-term neutral pattern while BNB is trading inside a bearish one. The technical indicators give a neutral outlook for TRX and a slightly bullish one for BNB.
Furthermore, we initiated a long trade setup for TRX last week, which we amended today by moving our stop loss to a higher point of 10% profit and closed the trade.
In the case of BNB, the price is trading inside a short-term ascending channel. Furthermore, the technical indicators support price increases.
Therefore, we believe that both BNB and TRX will see price increases during the upcoming days. We believe that both coins have a similar outlook and there is no clear winner in today’s comparison.
A summary is presented in the table below:
|
TRX |
BNB |
WINNER |
|
|
Outlook |
Trading inside a horizontal channel |
Ascending Broadening Wedge (Bearish) |
TRX |
|
Pattern & Indicators |
Slight bearish divergence in an ascending channel. |
Bullish cross between moving averages |
BNB |
| Trade Setup | Stop loss moved higher, target almost reached. Trade closed | N/A | TRX |
Disclaimer: This article is not trading advice and should not be construed as such. Always consult a trained financial professional before investing in cryptocurrencies, as the market is particularly volatile.
Trusted
Disclaimer
In line with the Trust Project guidelines, this price analysis article is for informational purposes only and should not be considered financial or investment advice. BeInCrypto is committed to accurate, unbiased reporting, but market conditions are subject to change without notice. Always conduct your own research and consult with a professional before making any financial decisions. Please note that our Terms and Conditions, Privacy Policy, and Disclaimers have been updated.
