

THORChain (RUNE) has been trading inside a corrective pattern since June 18 but is currently making an attempt at breaking out from it.
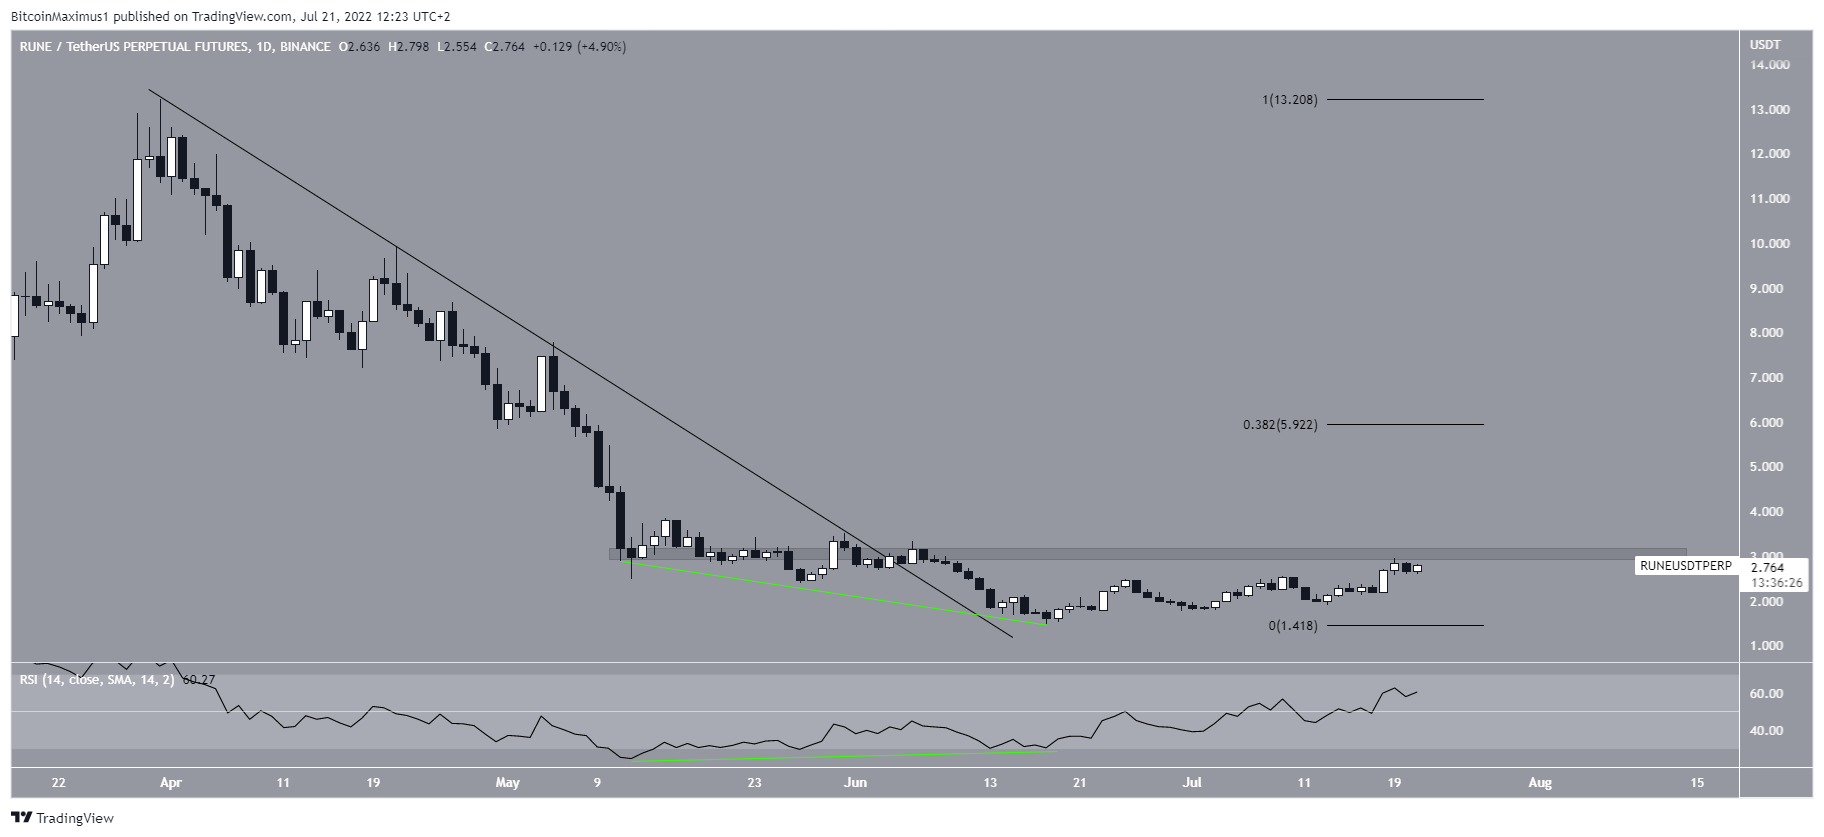
RUNE has been falling since reaching an all-time high price of $21.30 in May 2021. Since then, it has created three lower highs (red icons).
Initially, the price managed to hold on above the $3.70 horizontal support area. The area had been providing support since Feb. 2021, initiating several bounces (green icons). However, the price broke down in May 2022 and proceeded to reach a low of $1.43 in June.
While RUNE has been moving upwards since, it has yet to reclaim the $3.70 horizontal area, which is now expected to provide resistance. Until it does, the trend cannot be considered bullish.

RUNE breaks out
The daily chart provides a more bullish outlook relative to the weekly one, mostly because of the RSI reading.
The RSI has been generating bullish divergence in the period between May 11 and June 18. It has been increasing since and is now above 50.
Additionally, the price has broken out from a descending resistance line. While it is currently struggling with the $3 resistance area, a movement above it could trigger the acceleration of the upward movement towards $5.90, which is the 0.382 Fib retracement resistance level.
Wave count analysis
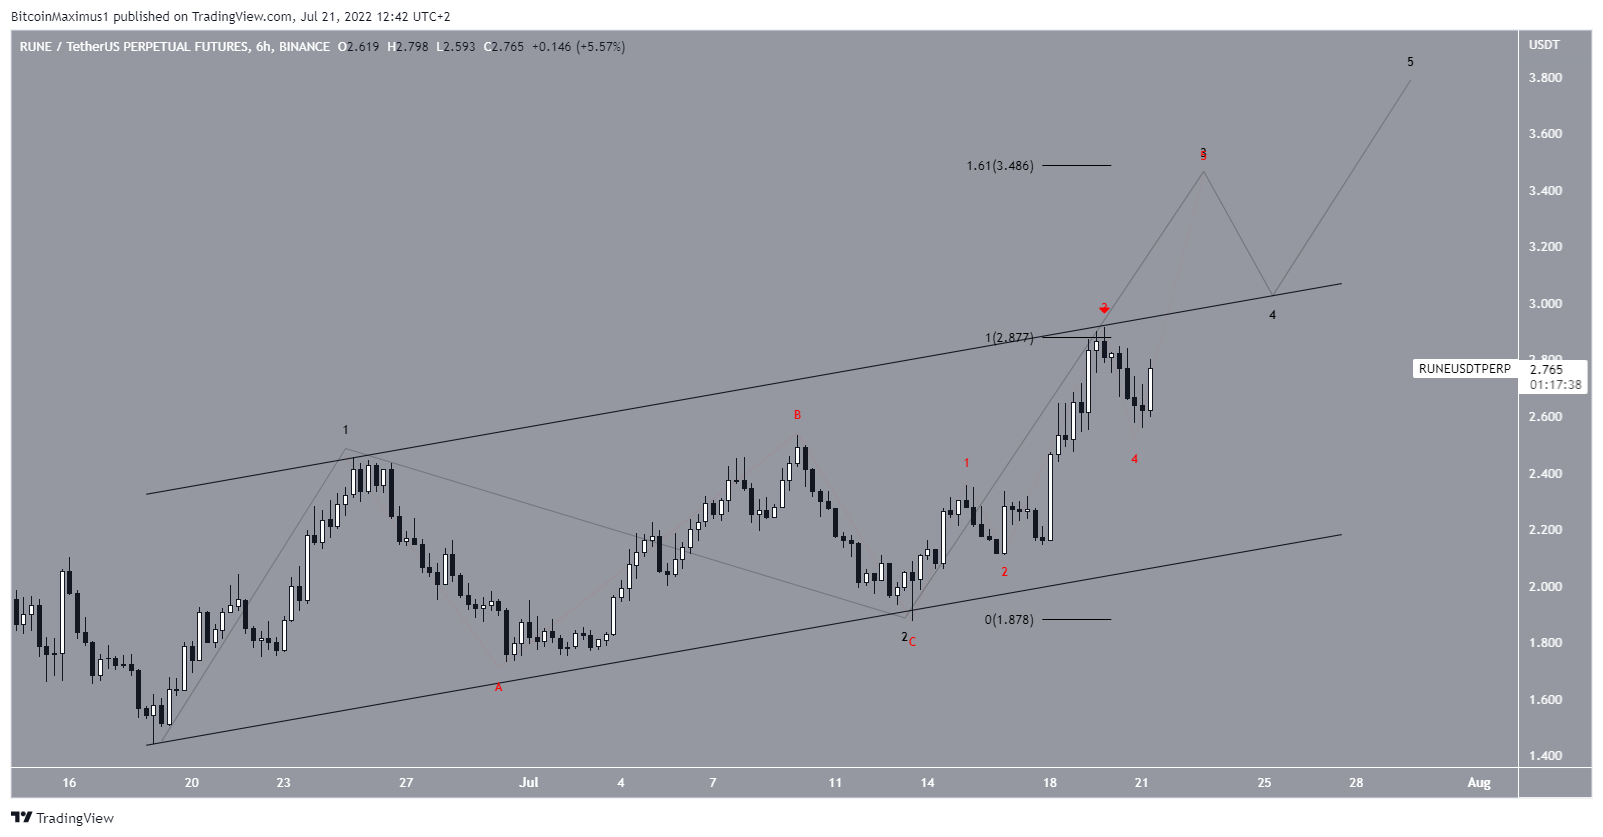
Technical analyst @Altstreetbet tweeted a chart of RUNE, stating that the price has begun a new upward movement and a bullish impulse towards at least $3.50.
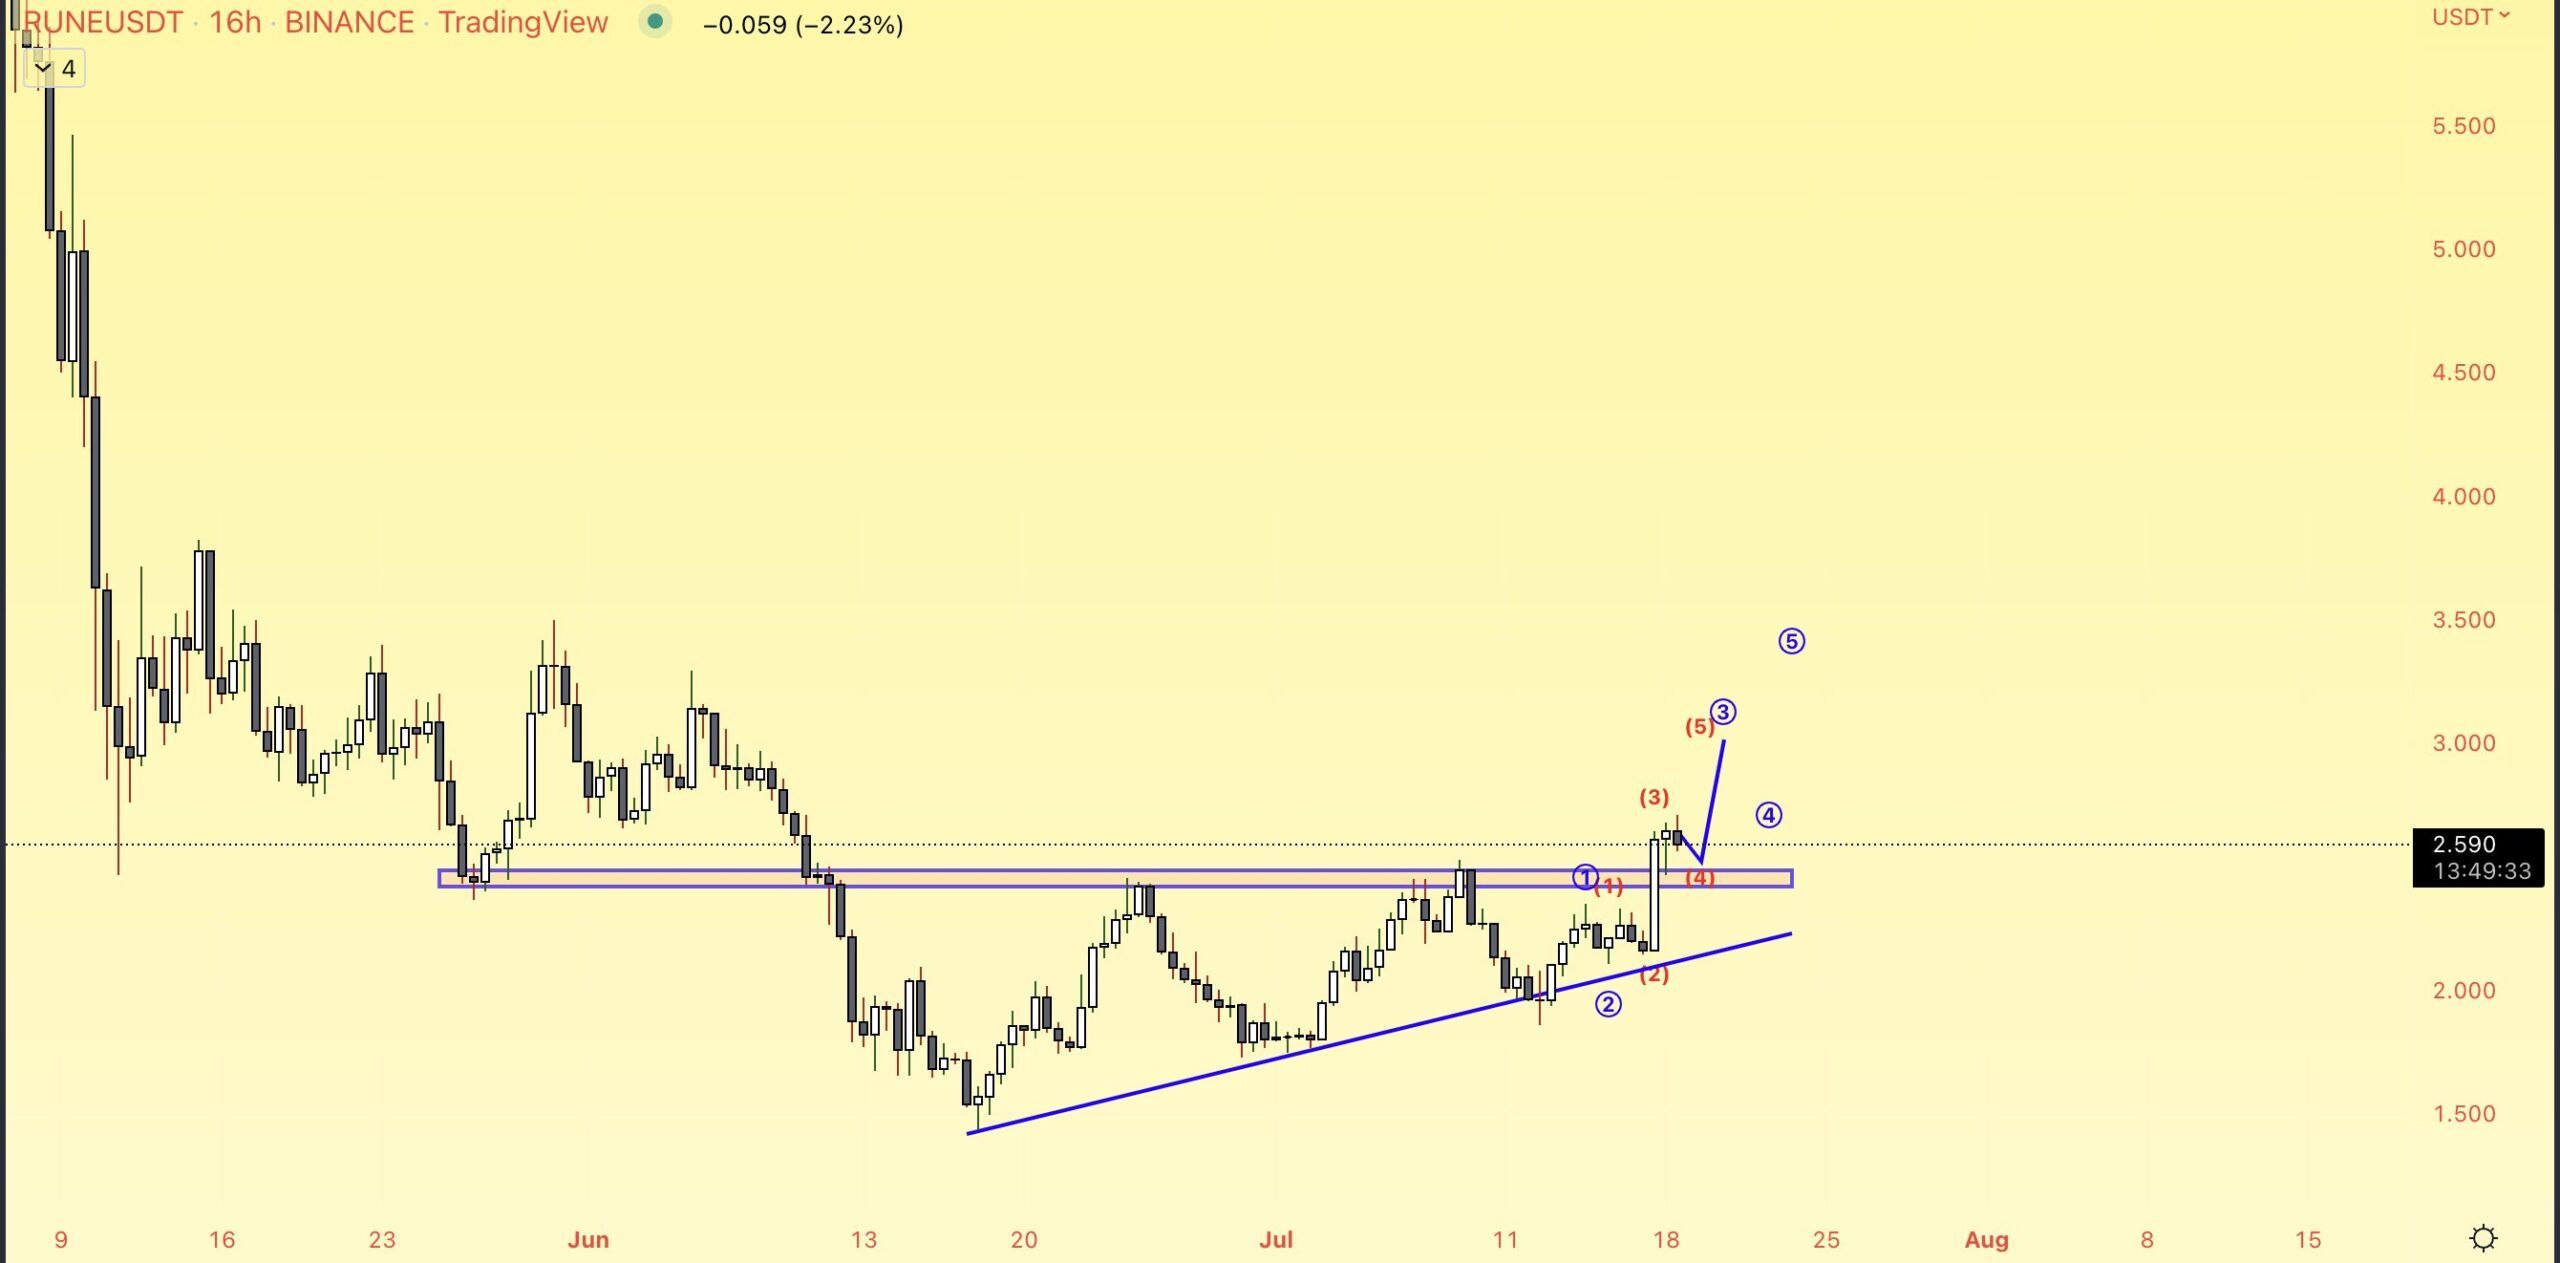
Since the June 18 bottom, RUNE has been trading inside an ascending parallel channel and is currently at its resistance line. Such channels usually contain the corrective pattern, meaning that a breakdown from it would be the most likely scenario.
Despite this, the wave count suggests that the price is in wave three (black) of a five-wave upward movement, and will soon break out from the channel. This is also in alignment with the readings from the daily time frame.
If the price manages to break out from the channel, it would confirm that it has initiated a bullish trend reversal, since it would also break out from the $3 horizontal resistance area.
As it stands, waves one and three have had an exactly 1:1 ratio. So, if the price gets rejected from the resistance line instead (red icon), it would mean that the entire upward movement was corrective instead. In this case, new lows would follow.
For Be[in]Crypto’s latest bitcoin (BTC) analysis, click here
Trusted
Disclaimer
In adherence to the Trust Project guidelines, BeInCrypto is committed to unbiased, transparent reporting. This news article aims to provide accurate, timely information. However, readers are advised to verify facts independently and consult with a professional before making any decisions based on this content. Please note that our Terms and Conditions, Privacy Policy, and Disclaimers have been updated.
