

Will the BTC price be able to successfully close above this MA? Continue reading below if you are interested in finding out.One hour to go for bulls to reclaim H4 200 EMA, still running the show here.
— Pierre (@pierre_crypt0) April 3, 2020
FYI last time we reclaimed it was on Jan 5th, and only lost it on Feb 25th
Would be an encouraging sign for bulls, but still a lot of fight to win this area. I guess another crazy day for us.#Bitcoin https://t.co/kHlnSAo6AP pic.twitter.com/7JgT2Zsxap
Moving Average
At the time of writing, the BTC price has already moved above this moving average (MA). In addition, it has moved above the $6,850 area that previously acted as resistance and is seemingly in the process of validating it as support. If the price were to reach a close above this MA/support area, it would have major bullish implications for the direction of the future trend. However, there are more than two hours left until the candlestick closes, so it is entirely possible that the close will be below this area. However, there is no bearish divergence to suggest that such a movement will transpire.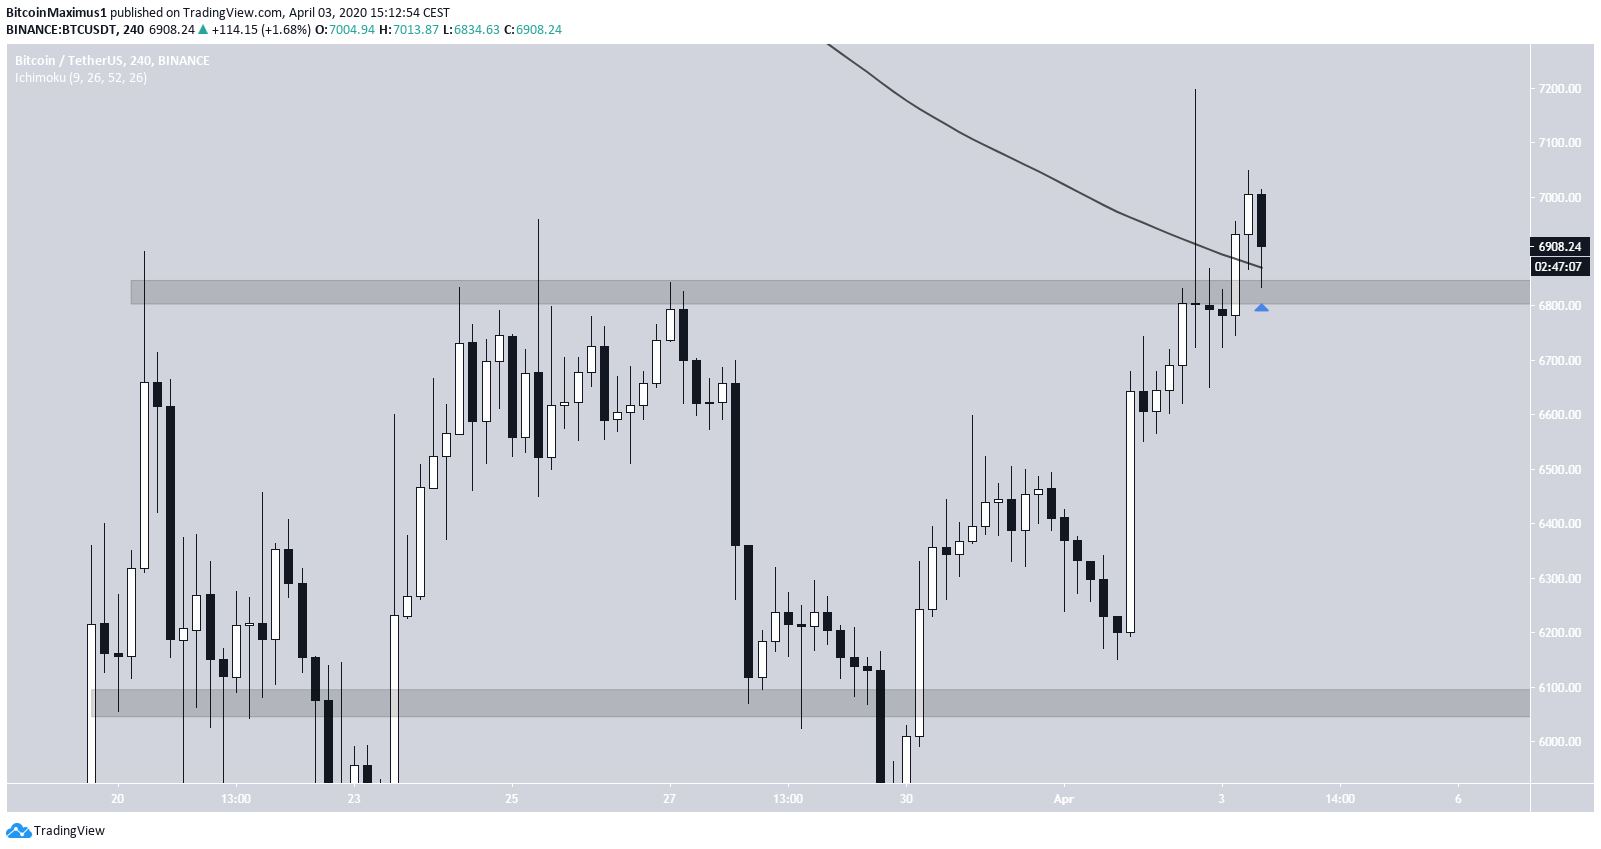
Previous Movement
When we look at the price movement in relation to the same MA since the beginning of the year, the MA turns out to be a very reliable predictor of the trend’s direction. It moved above this MA on Jan. 3 and began an upward move that led to the yearly high of $10,500. Afterwards, it began to decrease and touched it on Feb. 19, finding support above it and initiating a bounce. However, the price decreased below this MA on Feb. 25. Until now, the price had yet to touch this MA.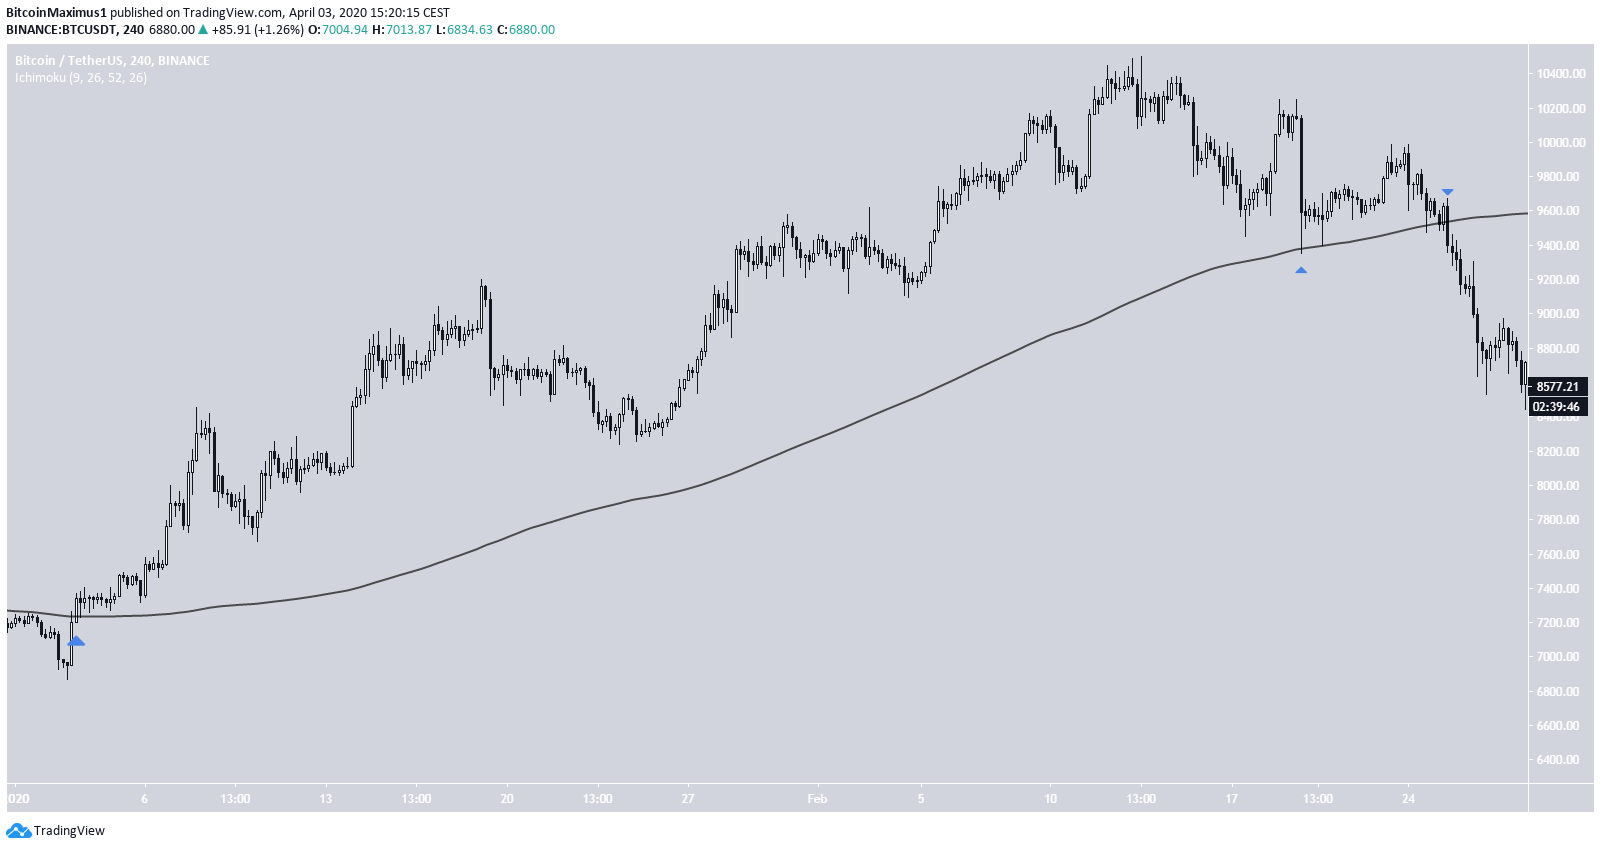
Trusted
Disclaimer
In line with the Trust Project guidelines, this price analysis article is for informational purposes only and should not be considered financial or investment advice. BeInCrypto is committed to accurate, unbiased reporting, but market conditions are subject to change without notice. Always conduct your own research and consult with a professional before making any financial decisions. Please note that our Terms and Conditions, Privacy Policy, and Disclaimers have been updated.
