
![The Dash Price Is in an Interesting Place [Premium Analysis]](https://beincrypto.com/wp-content/uploads/2019/06/bic_dash.jpg.optimal.jpg)
The DASH price has reached a significant support area that is expected to act as a bottom. However, the lack of a trading structure does not allow us to predict a date for the beginning of the next market cycle.
The price has been decreasing since reaching a high of ₿0.029 on April 2nd, having lost 80 percent of its value. While it made an attempt at a reversal at the beginning of September, it fell flat on September 19 and the price continued its downward movement.
Nevertheless, the decrease could be coming to an end. Cryptocurrency trader @imbagsy outlined the DASH price movement over that past month, stating that it has reached a long-term support area — piquing his interest at initiating a long trade.
He believes that the market will soon show its hand, either by creating a bearish engulfing candlestick that breaks down below the support area or by creating a trading range that would allow for the initiation of a long trade. Which one of these scenarios is more likely? Keep reading below if you are interested in finding out.$DASH update:
— Bagsy (@imBagsy) December 25, 2019
Almost one month later, and we're at my level of interest.
I'm waiting for either some type of capitulation candle, or a range to form over the next months. Either way, patience. pic.twitter.com/BNUr9mEcfg
Important DASH Price Levels
Looking at the DASH price, we can see that it has been decreasing since the middle of November. The most important resistance areas are found at ₿0.0105 and ₿0.009 while support areas are at ₿0.0055 and ₿0.0045. The price is currently trading inside the ₿0.0055 support area.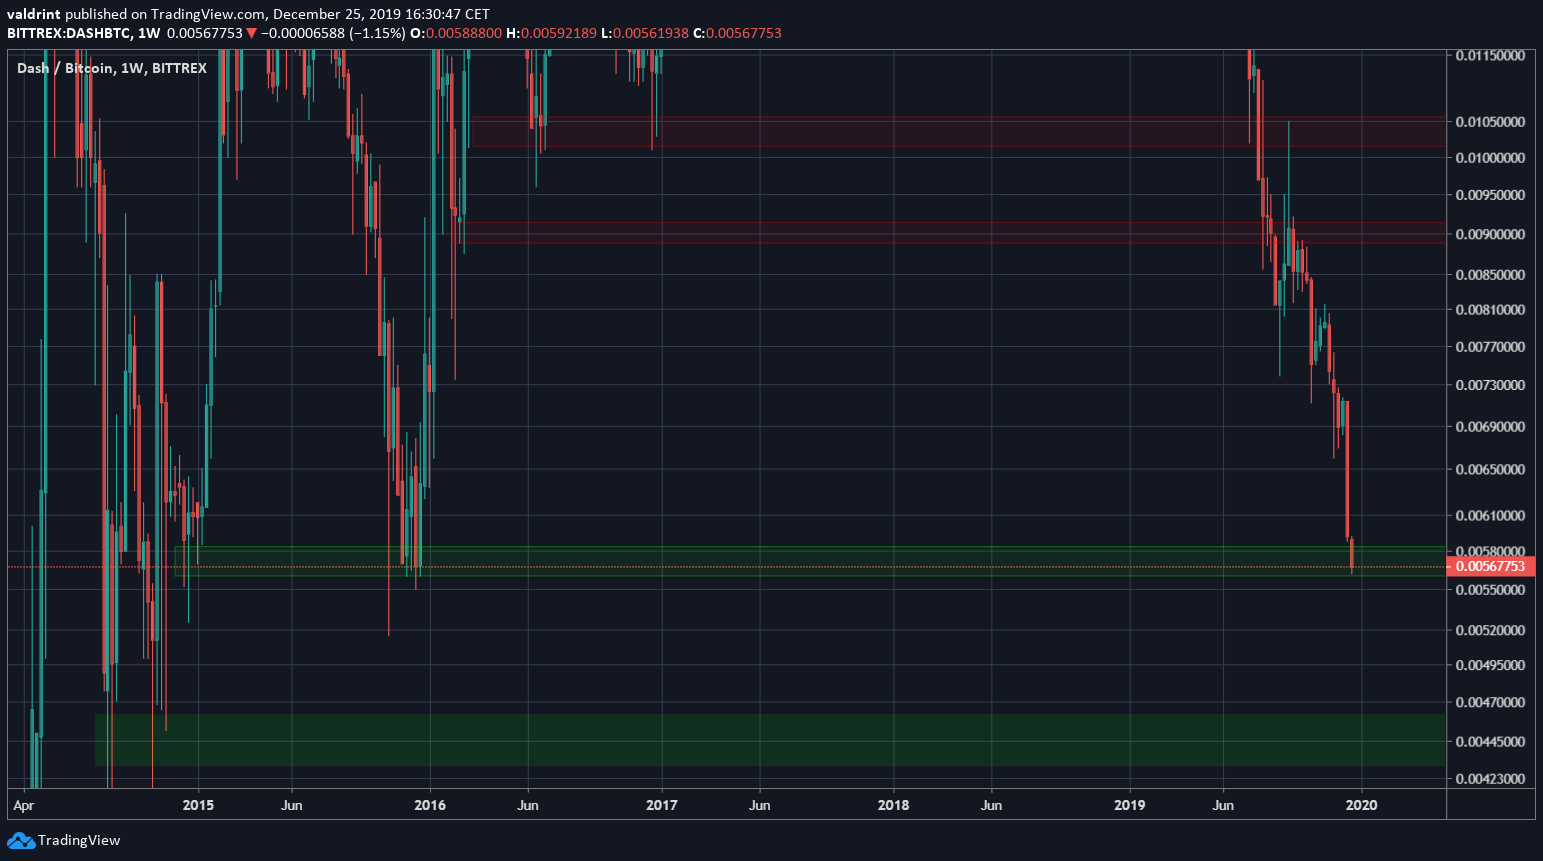
Future Movement
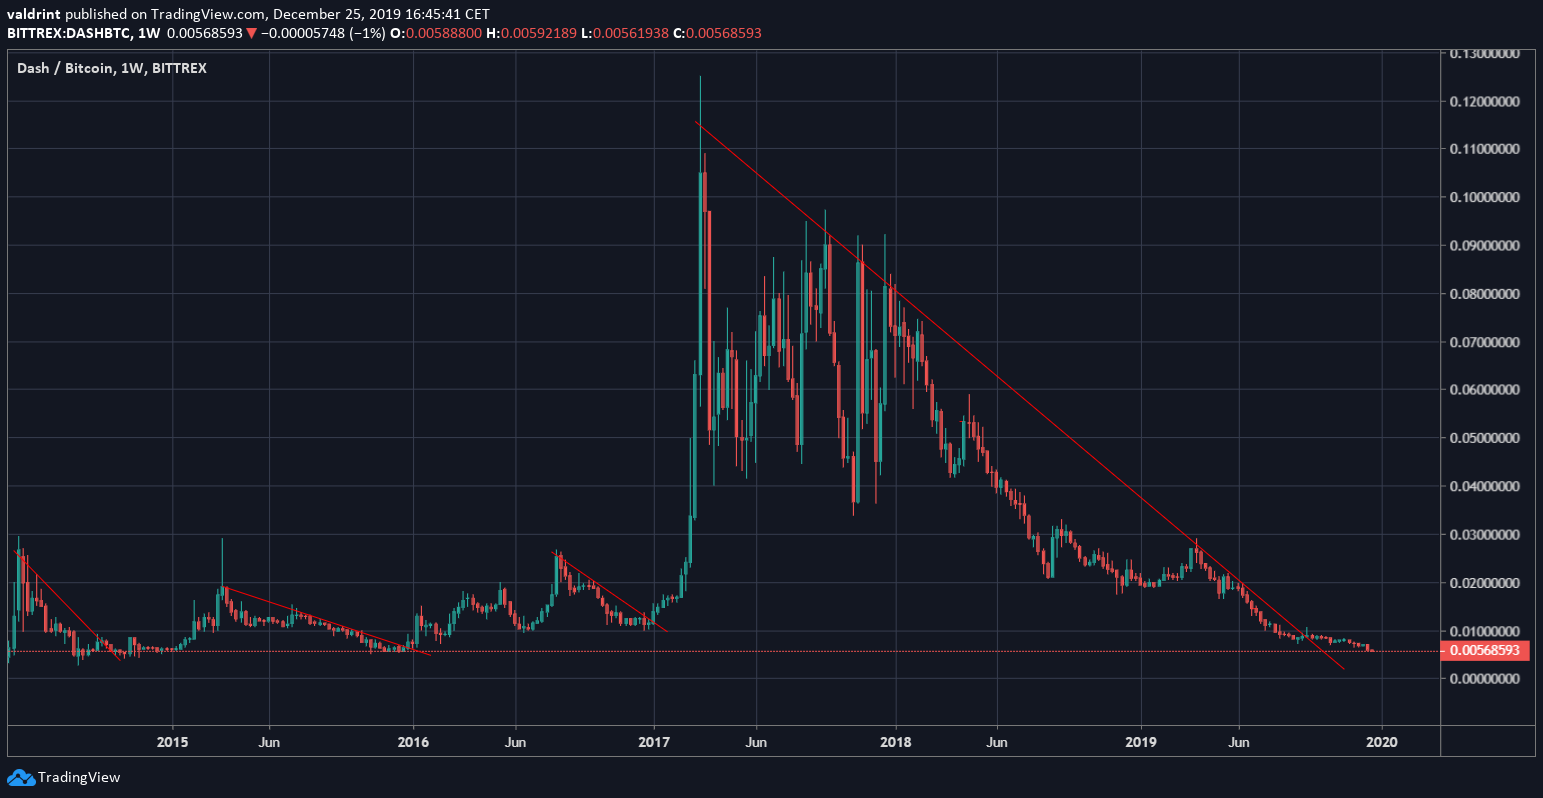
The weekly RSI has been trading in oversold levels since September, the lowest levels ever reached. Additionally, both the RSI & MACD have been generating bullish divergence — the latter having done so for more than a year. This suggests that the market is close to making a bottom and will soon begin a reversal. However, it does not remove the possibility of the DASH price making a lower low inside the next support area.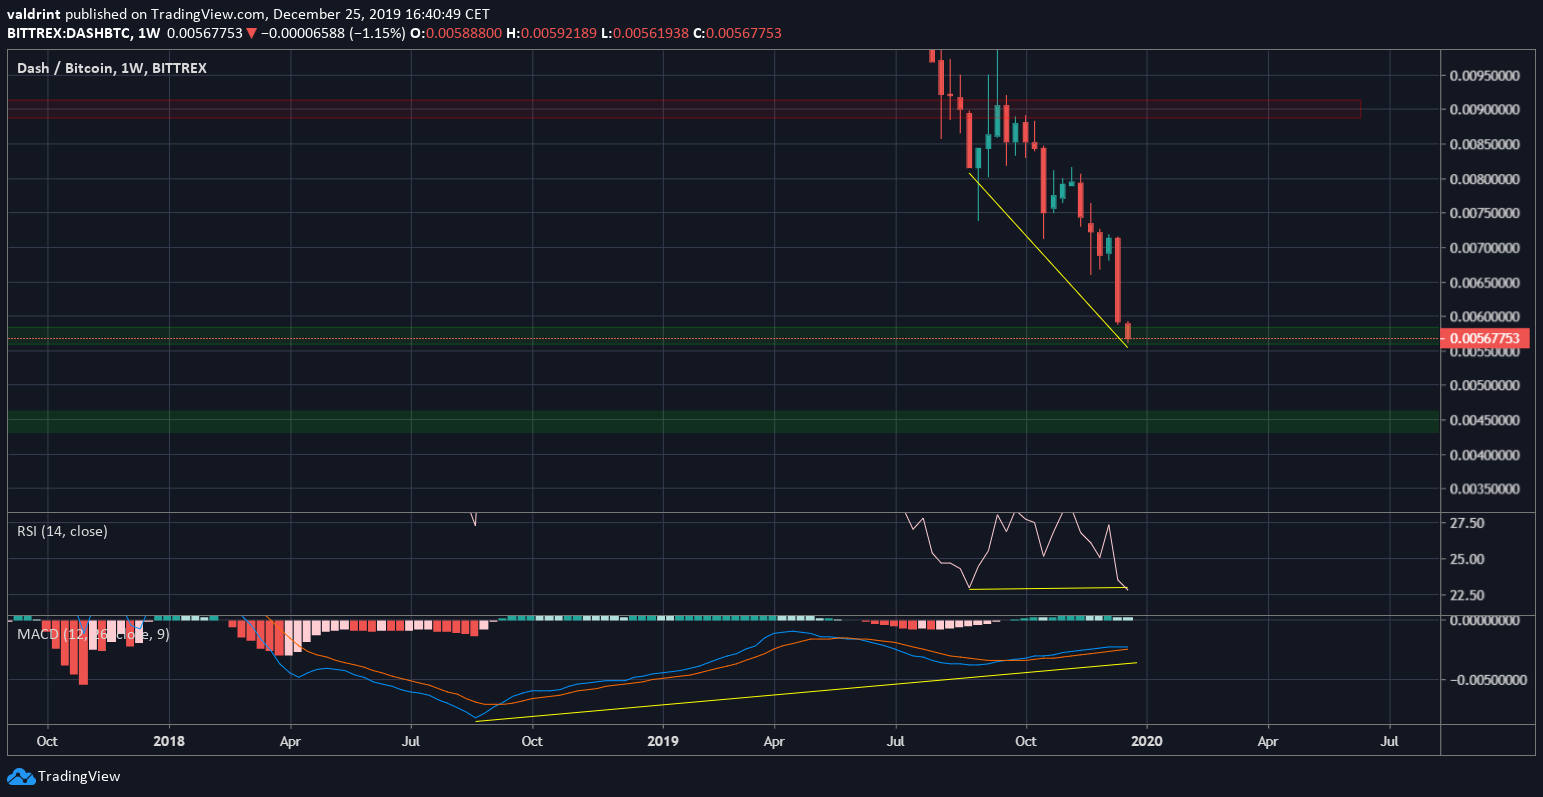 This view is supported by a pattern that has been created by DASH every-time the price has reached a high since 2014.
After the high, the DASH price has always created a steep descending resistance line. After the line was broken, the price consolidated for a period of time before it began a new market cycle. Currently, it looks as if we are in the consolidation portion of this movement.
Therefore, while we believe a new market cycle will begin and technical indicators support this movement, the lack of a trading pattern makes it impossible to initiate a trade with a set entry-level, stop/loss and target. Rather, the prudent move would be to wait until the price creates a pattern and then entering the trade. We do not expect a rapid movement to occur that would prevent us from entering the trade.
This view is supported by a pattern that has been created by DASH every-time the price has reached a high since 2014.
After the high, the DASH price has always created a steep descending resistance line. After the line was broken, the price consolidated for a period of time before it began a new market cycle. Currently, it looks as if we are in the consolidation portion of this movement.
Therefore, while we believe a new market cycle will begin and technical indicators support this movement, the lack of a trading pattern makes it impossible to initiate a trade with a set entry-level, stop/loss and target. Rather, the prudent move would be to wait until the price creates a pattern and then entering the trade. We do not expect a rapid movement to occur that would prevent us from entering the trade.
 To conclude, the DASH price has likely reached a bottom and will eventually begin a new market cycle. However, the current period of consolidation could extend until the price does so. We cannot guess a date for the beginning of this cycle with high certainty.
Disclaimer
In line with the Trust Project guidelines, this price analysis article is for informational purposes only and should not be considered financial or investment advice. BeInCrypto is committed to accurate, unbiased reporting, but market conditions are subject to change without notice. Always conduct your own research and consult with a professional before making any financial decisions. Please note that our Terms and Conditions, Privacy Policy, and Disclaimers have been updated.

Valdrin Tahiri
Valdrin discovered cryptocurrencies while he was getting his MSc in Financial Markets from the Barcelona School of Economics. Shortly after graduating, he began writing for several different cryptocurrency related websites as a freelancer before eventually taking on the role of BeInCrypto's Senior Analyst.
(I do not have a discord and will not contact you first there. Beware of scammers)
READ FULL BIO
Sponsored
Sponsored