

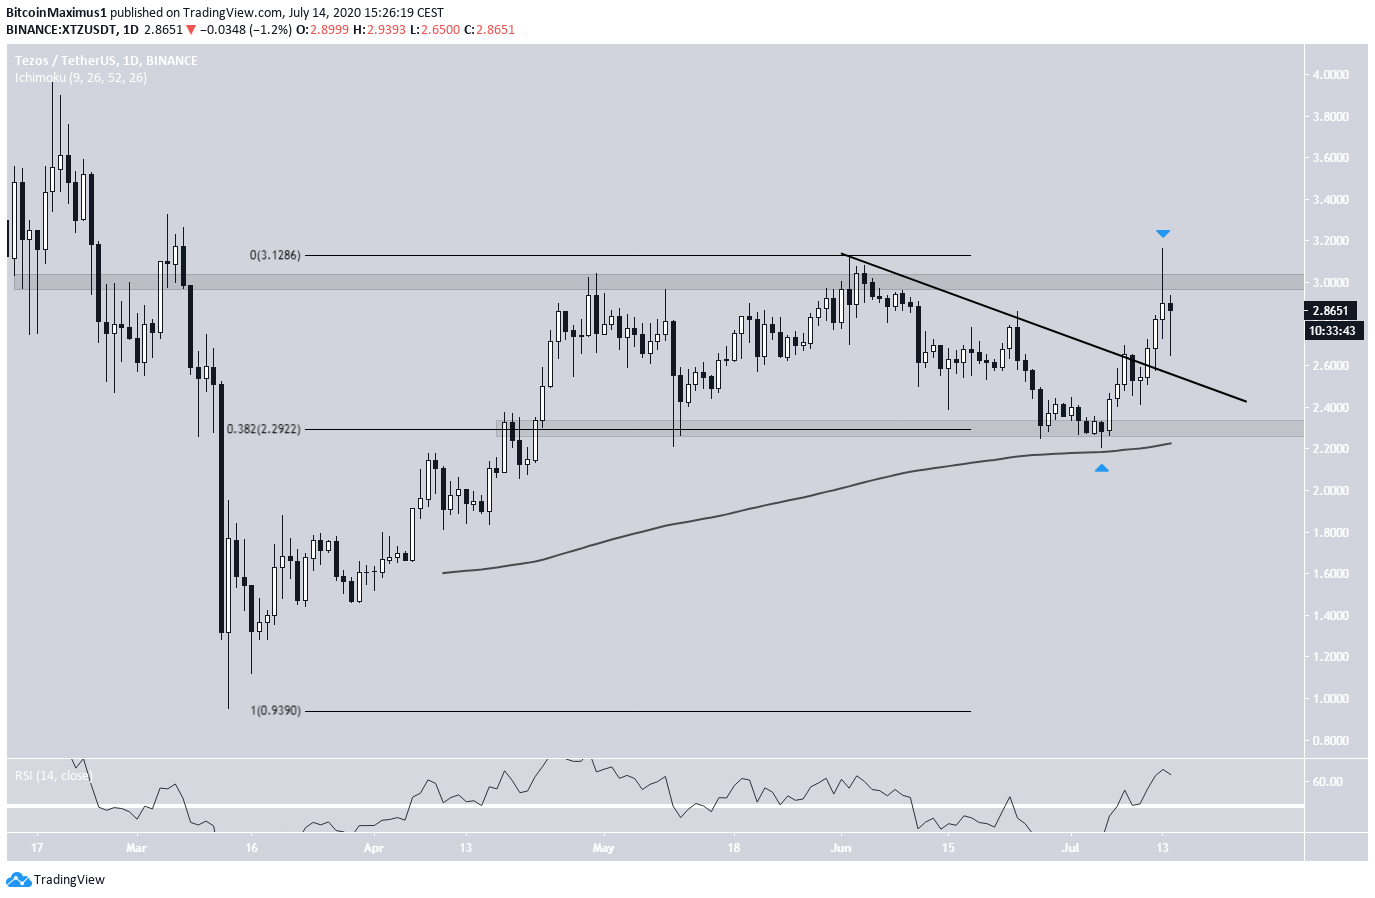
The Tezos (XTZ) price has been increasing at an accelerated rate since July 5, breaking out from a nearly month-long descending resistance line. The price was rejected by the $3.05 resistance area but should make another attempt to break out.
The XTZ price began an upward move on March 13, which continued until the price reached a high of $3.13 on June 2. The high served to validate the $3.05 area as resistance, since the price was rejected by the same level on April 30.
Since then, XTZ has declined at the rate predicted by a descending resistance line. However, on July 5, the price bounced at the $2.3 support area (also strengthened by the 200-day moving average (MA)) and began an upward move that caused a breakout from the previous descending resistance line.
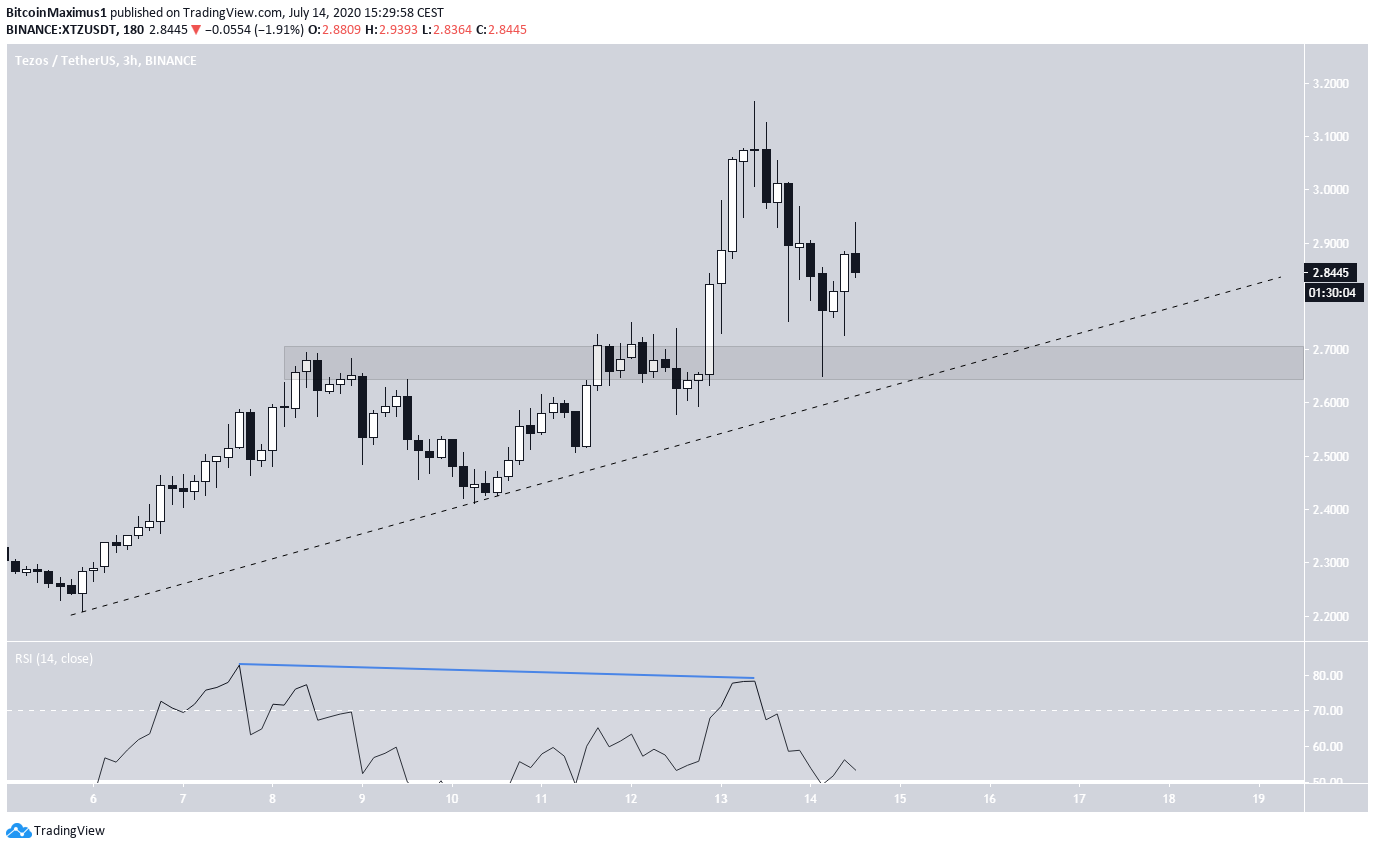
The price reached the $3.05 resistance area before declining once more. This move also caused the daily RSI to move above 50, and validate the line as support. The bullish price action suggests that the price will continue moving upwards.
Crucial Resistance
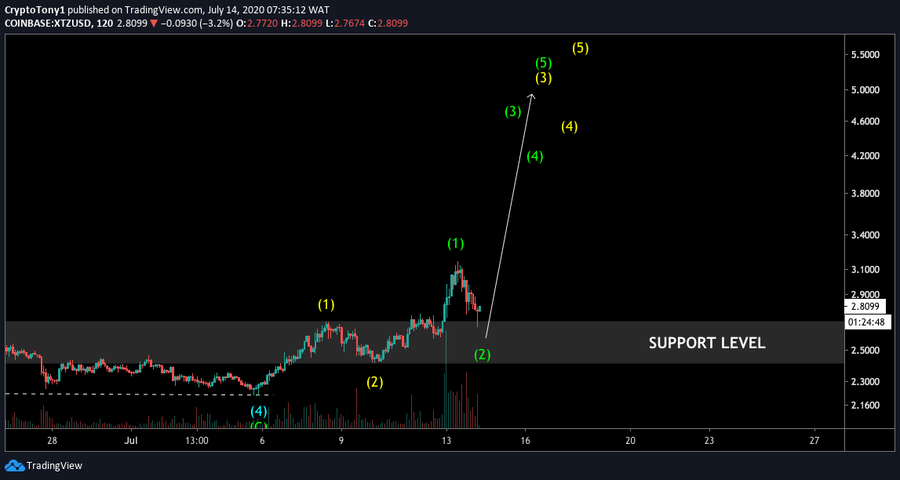
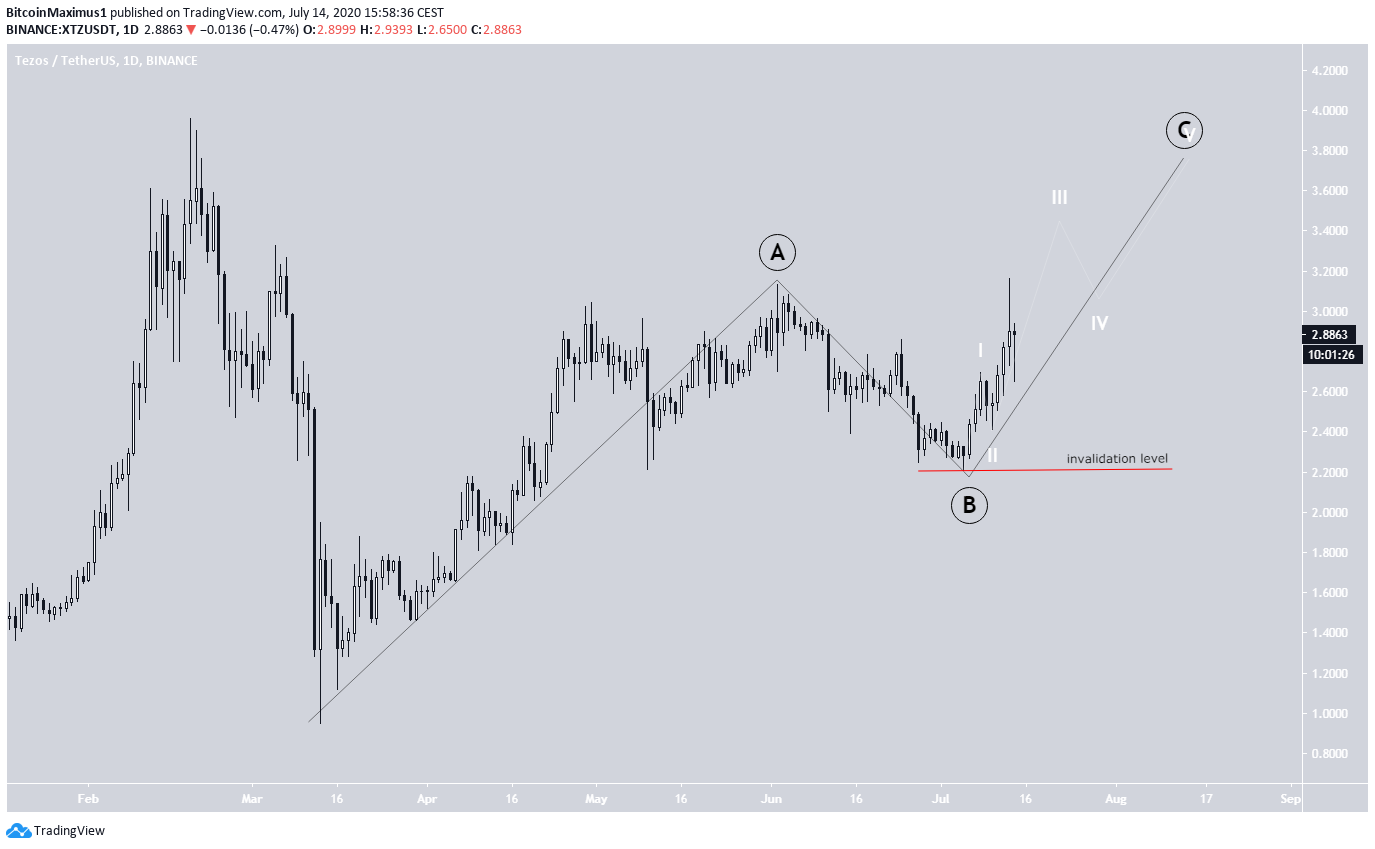
XTZ Wave Count
Cryptocurrency trader @Glowto1994 stated that the Tezos price is dropping towards support, but is expected to continue moving upwards, possibly going all the way to $5.Pulled back deeper than expected due to Bitcoin breaking down last night and so far we have reacted off the supply zone. Now the structure looks incomplete so i’m betting on this impulse continuing and laddered orders down. Stop loss below the support region.
Top crypto projects in the US | April 2024
Trusted
Disclaimer
In line with the Trust Project guidelines, this price analysis article is for informational purposes only and should not be considered financial or investment advice. BeInCrypto is committed to accurate, unbiased reporting, but market conditions are subject to change without notice. Always conduct your own research and consult with a professional before making any financial decisions. Please note that our Terms and Conditions, Privacy Policy, and Disclaimers have been updated.

Valdrin Tahiri
Valdrin discovered cryptocurrencies while he was getting his MSc in Financial Markets from the Barcelona School of Economics. Shortly after graduating, he began writing for several different cryptocurrency related websites as a freelancer before eventually taking on the role of BeInCrypto's Senior Analyst.
(I do not have a discord and will not contact you first there. Beware of scammers)
READ FULL BIO
Sponsored
Sponsored