

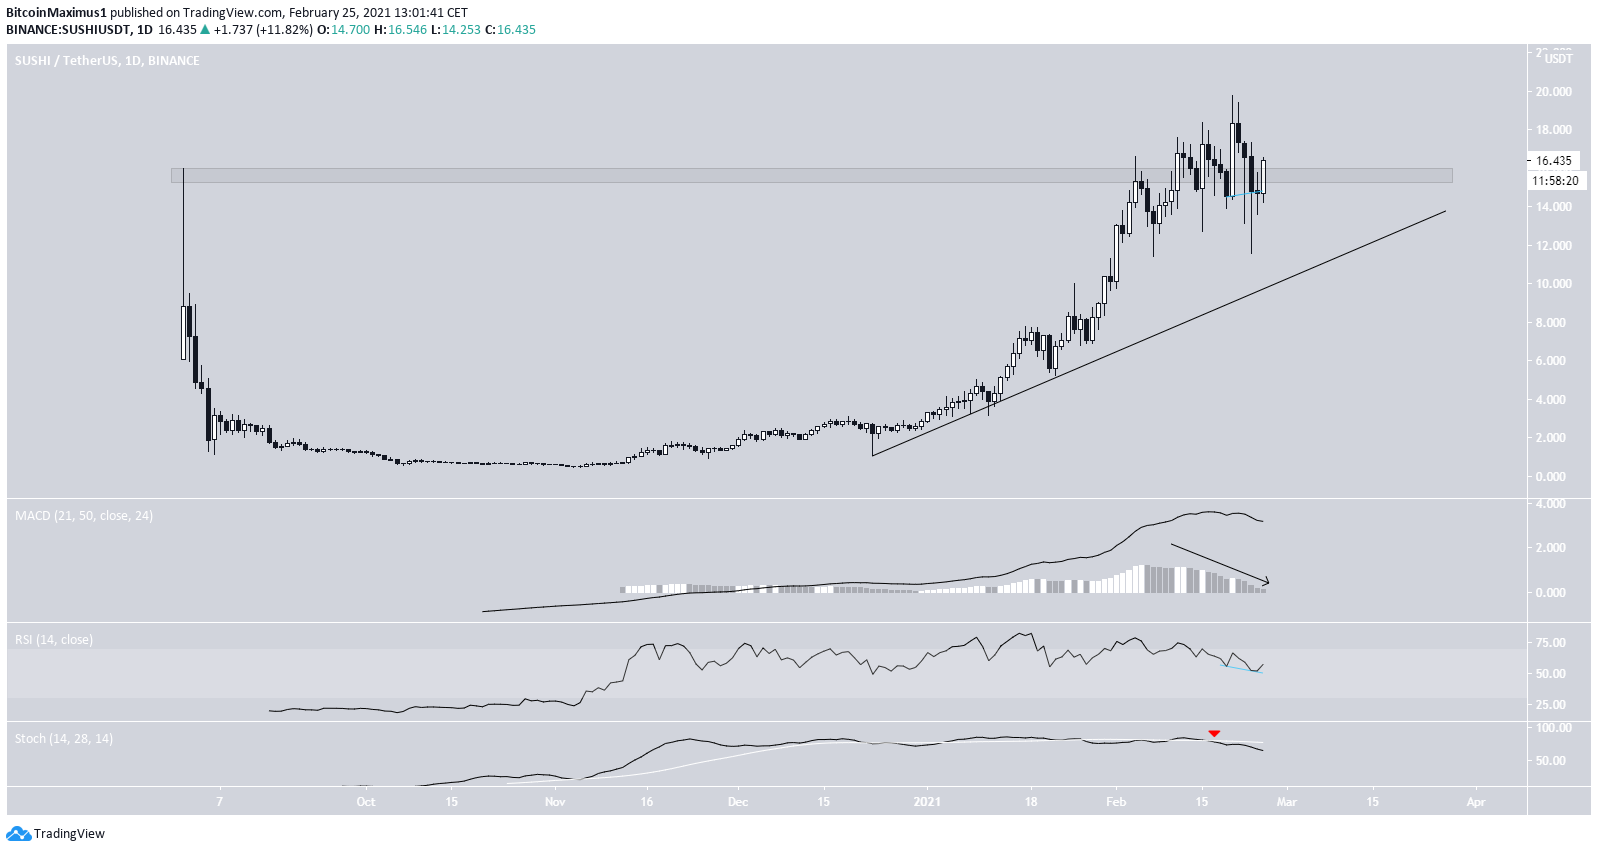
The SushiSwap (SUSHI) price has been decreasing since reaching an all-time high on Feb. 20, but is currently attempting to reclaim the previous all-time high resistance area at $16.
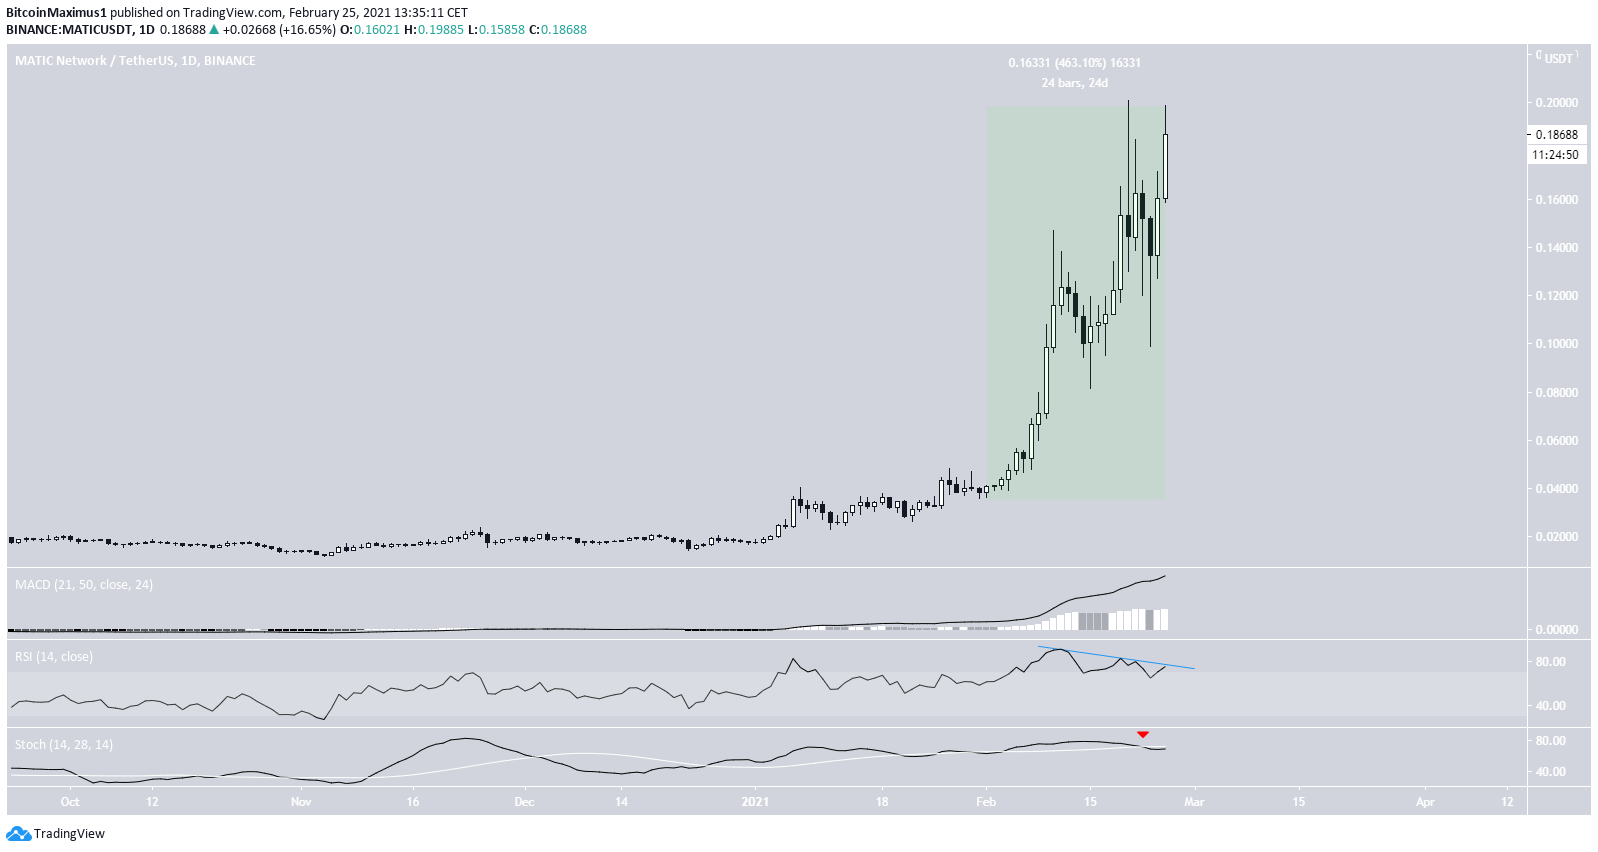
While Matic Network (MATIC) is nearing an all-time high price, it potentially creates a double top pattern, and technical indicators show weakness.
Similarly, BlockStack seems to be in the final portion of its upward move, despite no clear weakness yet from technical indicators.
SushiSwap (SUSHI)
SUSHI has been decreasing since reaching an all-time high price of $19.76 on Feb. 20.
Despite the drop, SUSHI has regained a large part of its losses and is now in the process of reclaiming the $16 area and validating it as support.
However, technical indicators are mixed. While the MACD and Stochastic oscillator are decreasing, the RSI has generated hidden bullish divergence, a strong sign of trend continuation.
It is possible that SUSHI is following an ascending support line, which is currently at $13, but the line has not been validated sufficient times.
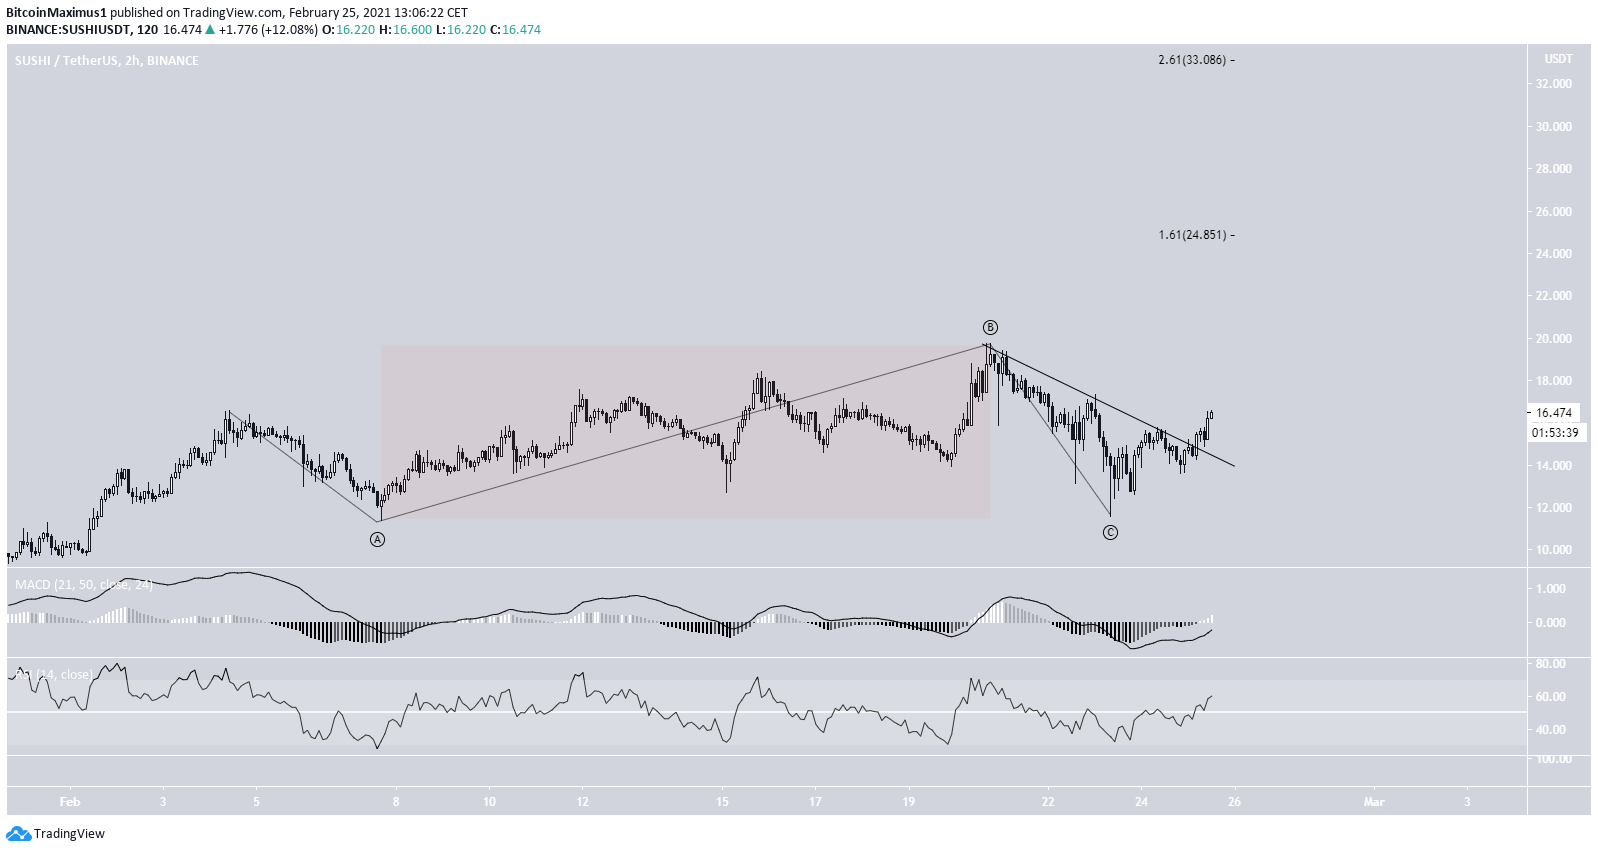
The shorter-term two-hour chart shows that SUSHI has broken out from a descending resistance line and is moving upwards.
The movement between Feb. 7 – 20 does look corrective, so it’s entirely possible that this was an irregular flat correction and SUSHI will now resume its upward movement.
If so, the next closest resistance areas would be at $24.80 and $33, the 1.61 and 2.61 external Fib retracements of the most recent drop. Short-term indicators are bullish, supporting the continuation of the upward move.
Highlights
- Sushi is attempting to reclaim the $15.60 area
- It is potentially following an ascending support line.
Matic Network (MATIC)
MATIC has been moving upwards at a rapid pace since Feb. 1, having increased by a massive 463% in 24 days. So far, it has reached an all-time high price of $0.20, doing so on Feb. 20.
While MATIC has bounced admirably after the Feb. 22 drop, technical indicators are still bearish.
The RSI has generated bearish divergence and the Stochastic oscillator has made a bearish cross.
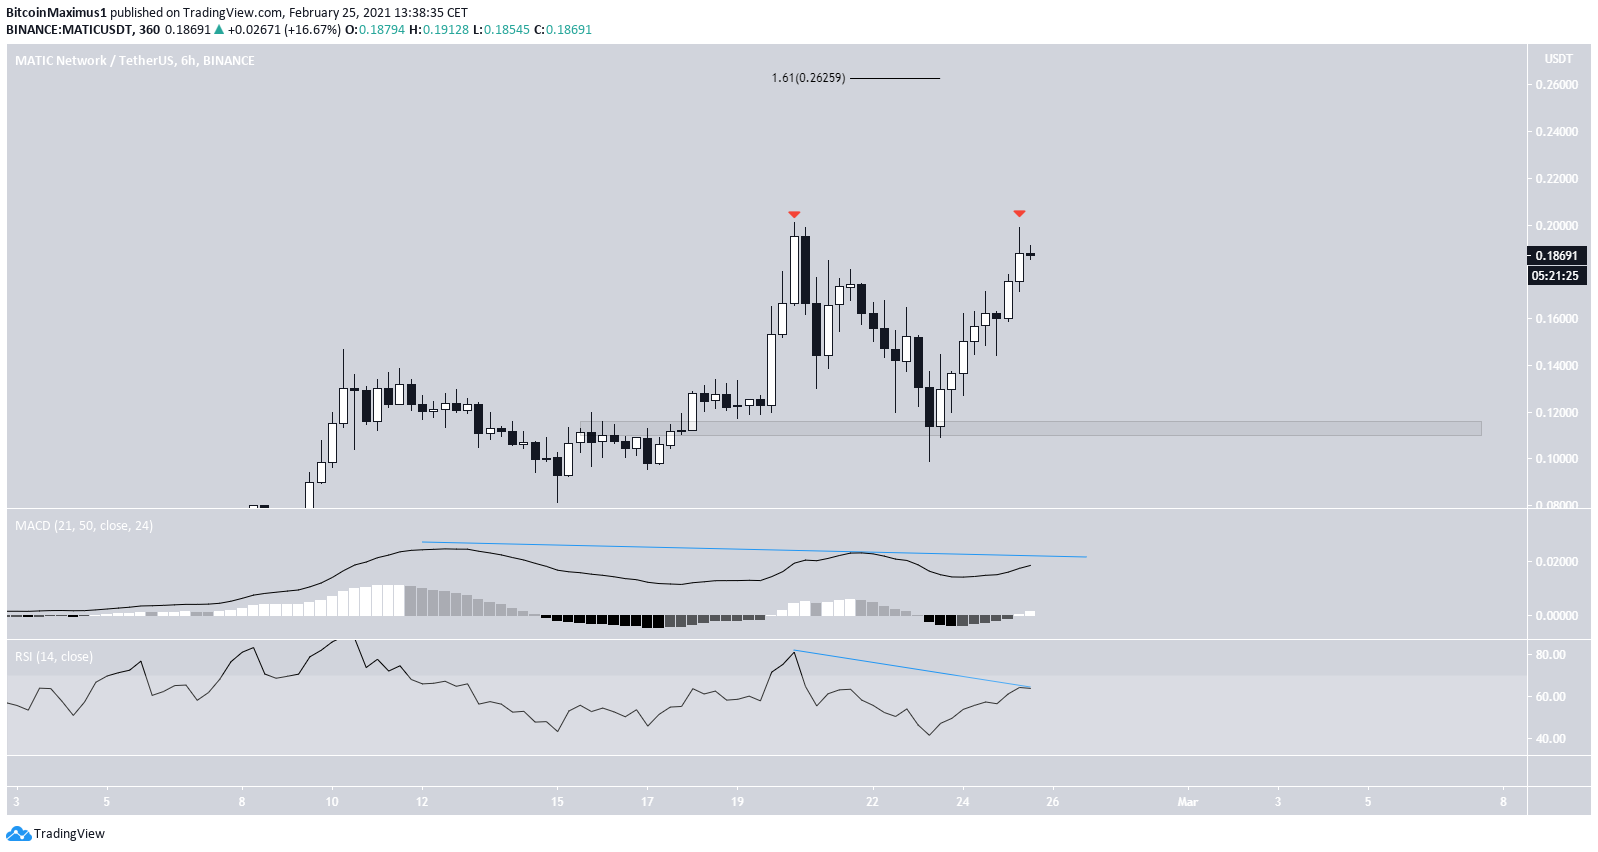
The shorter-term six-hour chart shows that despite the ongoing upward move, MATIC is in the process of potentially creating a double top pattern, which is also combined with bearish divergence in both the RSI and the MACD.
While a potential breakout could take MATIC all the way to $0.26, a drop towards the $0.11 support area seems more likely.
Highlights
- MATIC could potentially be creating a double top pattern.
- Technical indicators show weakness.
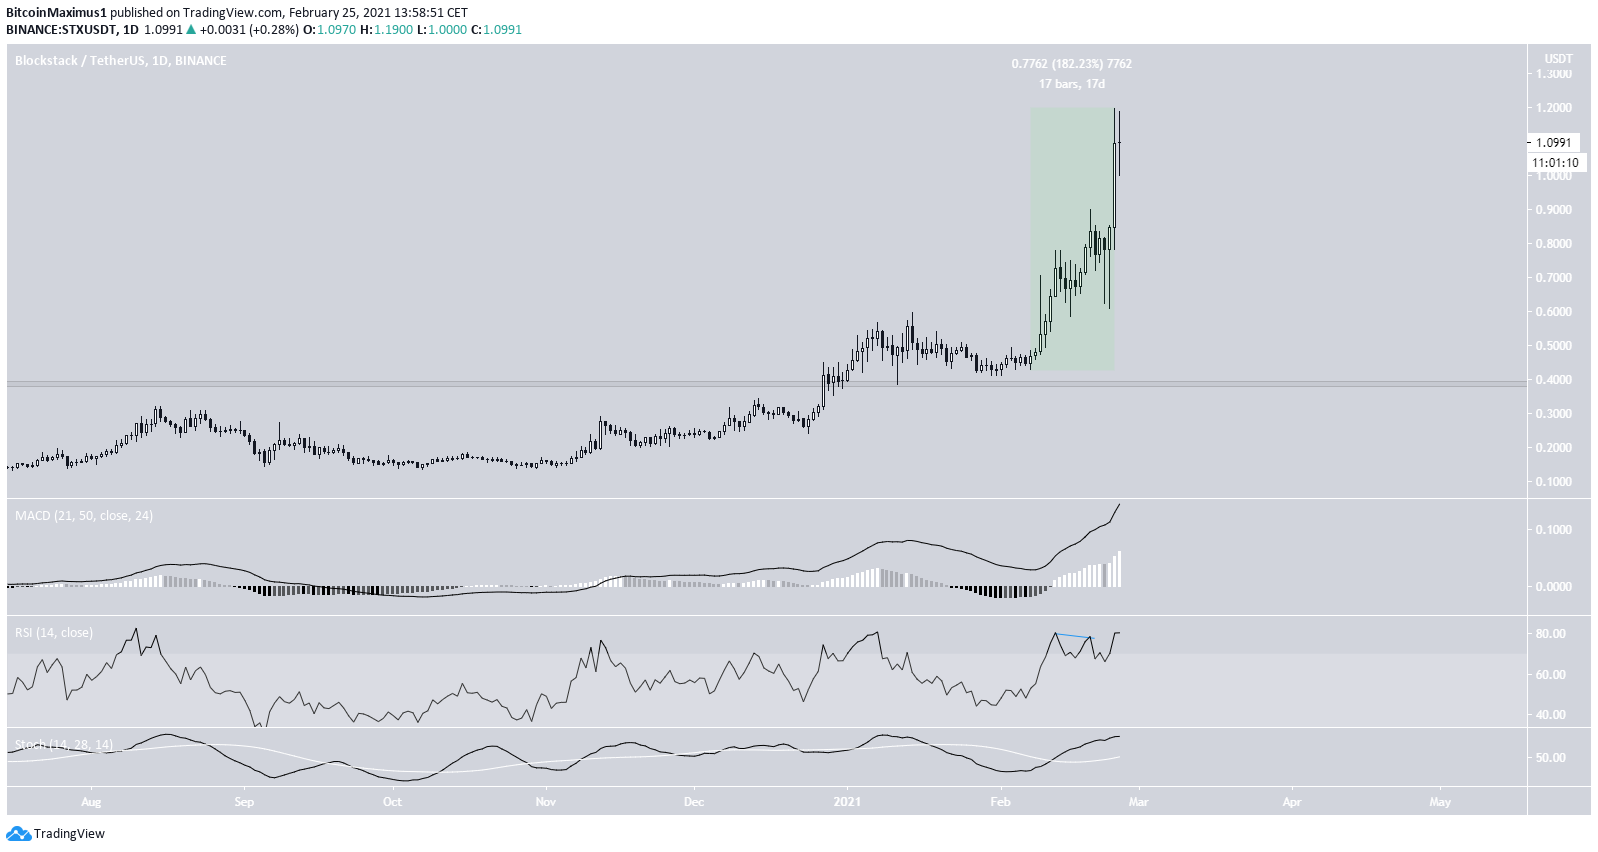
BlockStacks (STX)
STX has been moving upwards with strength since Feb. 7, having increased by 180% in 17 days.
So far, it has reached an all-time high price of $1.19, doing so on Feb. 24.
Despite the rally being parabolic, technical indicators do not yet show any weakness. While the RSI initially generated some bearish divergence, a drop occurred as a result and the RSI is now increasing once more.
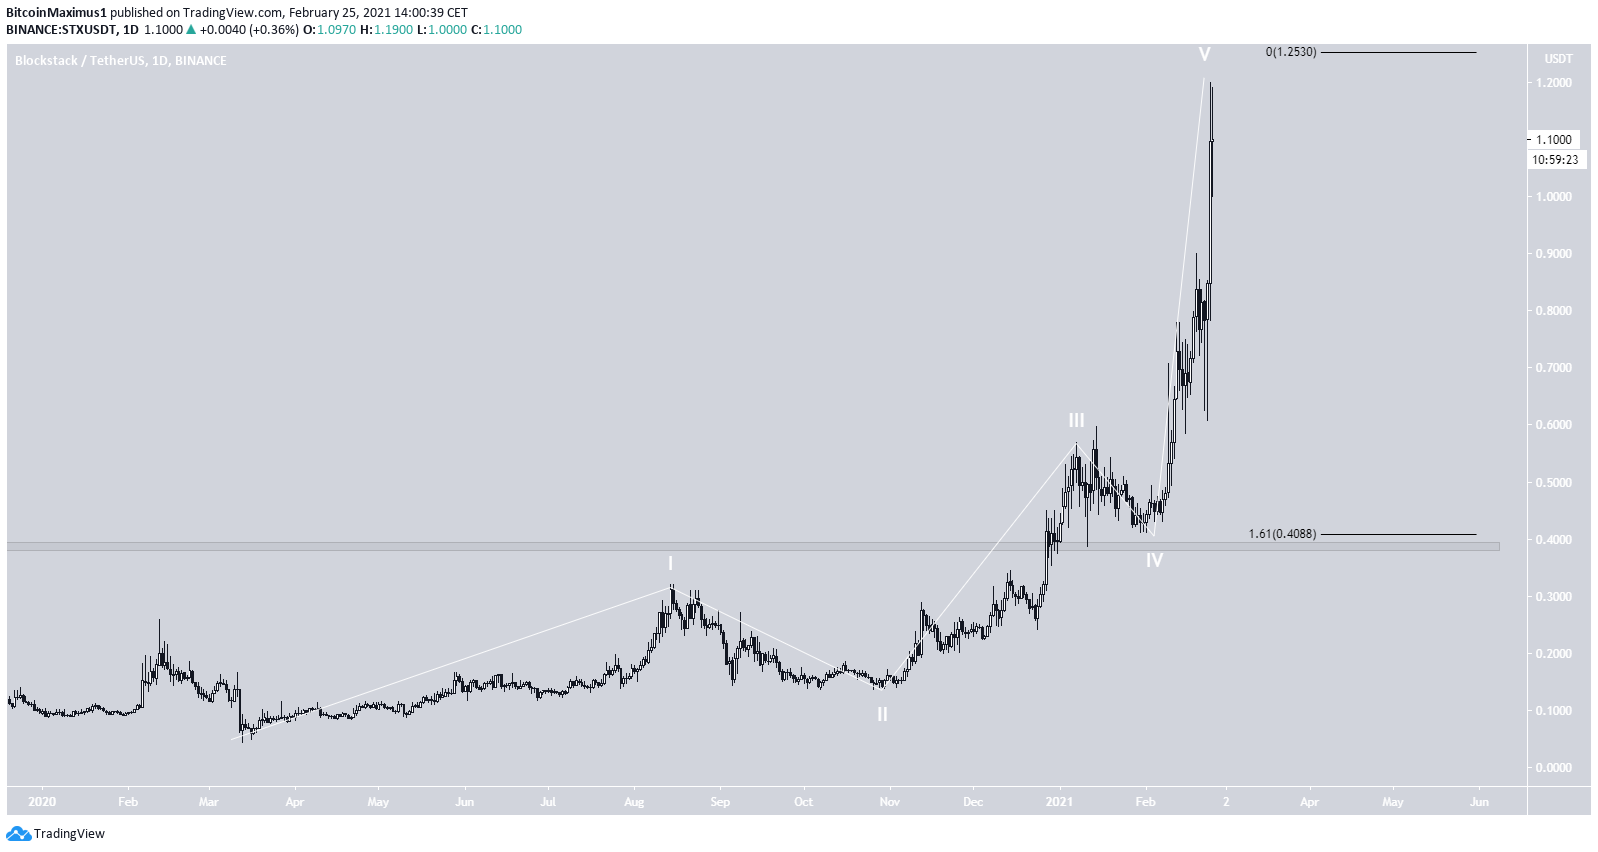
The wave count suggests that STX is in wave five of a bullish impulse (white) that began on Mar. 2020.
A potential target for the top of this wave is at $1.25, the 1.61 Fib extension of waves 1-3.
While it’s possible that the upward movement extends, STX does seem to be in the final portion of the upward movement.
Highlights
- STX is likely in wave five of a bullish impulse.
- There is potential resistance at $1.25
For BeInCrypto’s latest Bitcoin (BTC) analysis, click here.
Trusted
Disclaimer
In line with the Trust Project guidelines, this price analysis article is for informational purposes only and should not be considered financial or investment advice. BeInCrypto is committed to accurate, unbiased reporting, but market conditions are subject to change without notice. Always conduct your own research and consult with a professional before making any financial decisions. Please note that our Terms and Conditions, Privacy Policy, and Disclaimers have been updated.
