

Stellar (XLM) has been trading in a tight range since the beginning of October.
A breakdown from this range is expected and could cause a sharp drop to follow.
XLM Trading Range
The XLM price has been increasing since it reached a local low of $0.667 on Sept 24. Shortly afterward, the price reclaimed the $0.073 area, validated it as support, and began to move upwards. The rally ended once the price reached the 0.382 Fib level of the entire downward move at $0.087. Since getting rejected, XLM has fallen back to the $0.073 level, which is now acting as support once more.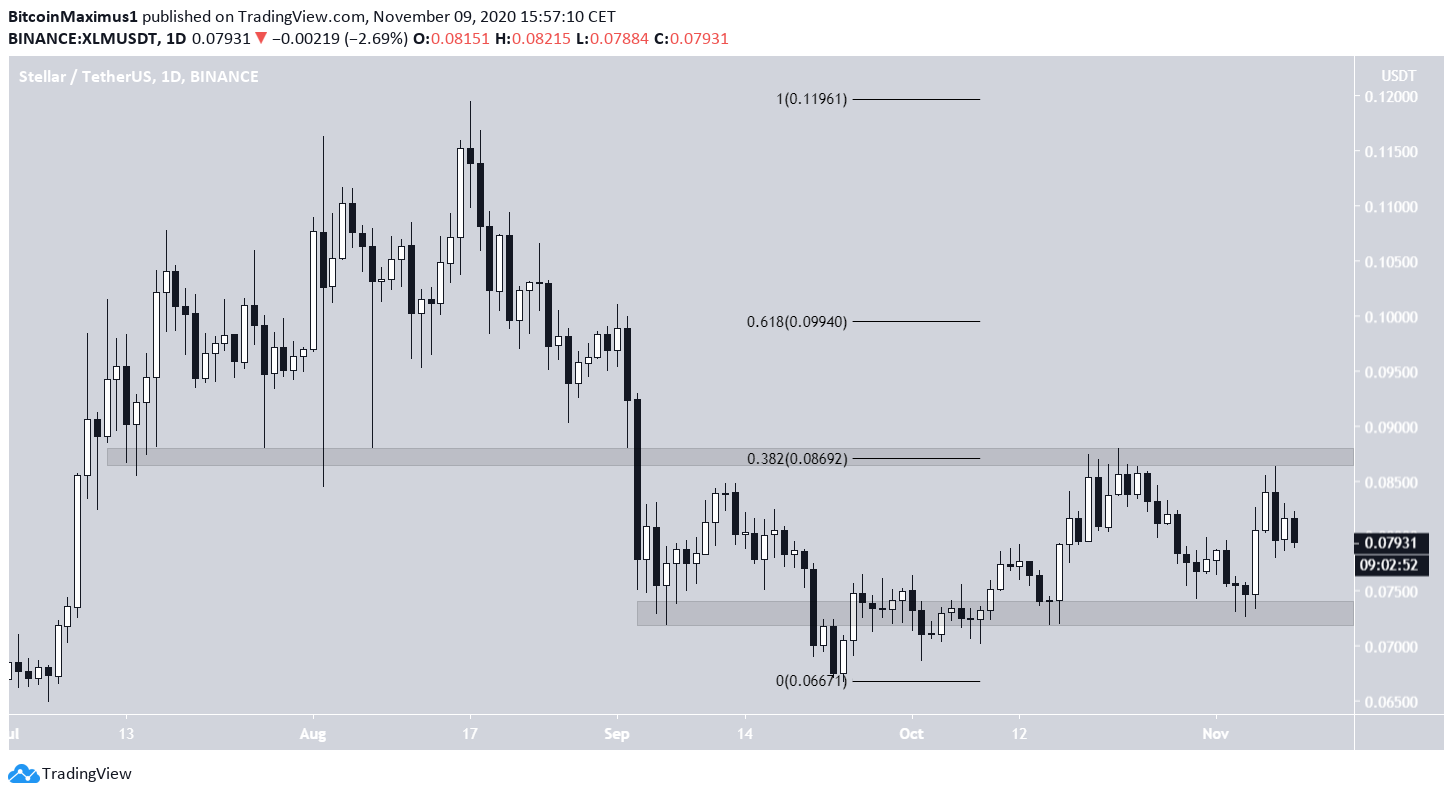

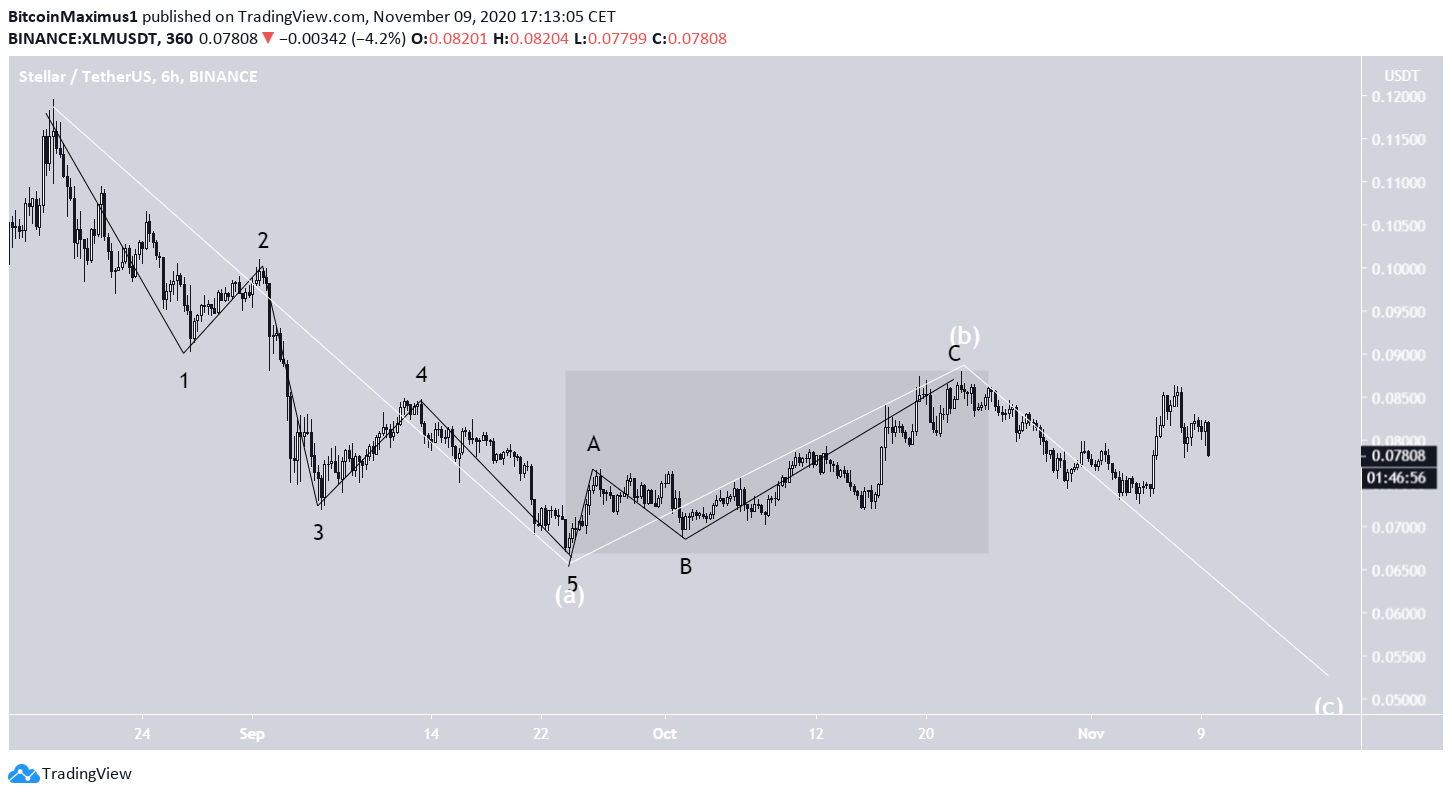
Short-Term Movement
The short-term chart is similarly bearish. After the rejection, XLM dropped to the $0.077 area, which is seemingly acting as support, creating a potential double-bottom pattern. However, there are no reversal signs in the form of bullish divergences. Furthermore, the RSI has fallen below 50 and the MACD is nearing negative territory, a sign that the price is likely to break down from this minor support area.
Wave Count
Cryptocurrency trader @cryptotony_ outlined an XLM chart, stating that the price might be in for an extended correction which could eventually cause the price to drop below $0.05.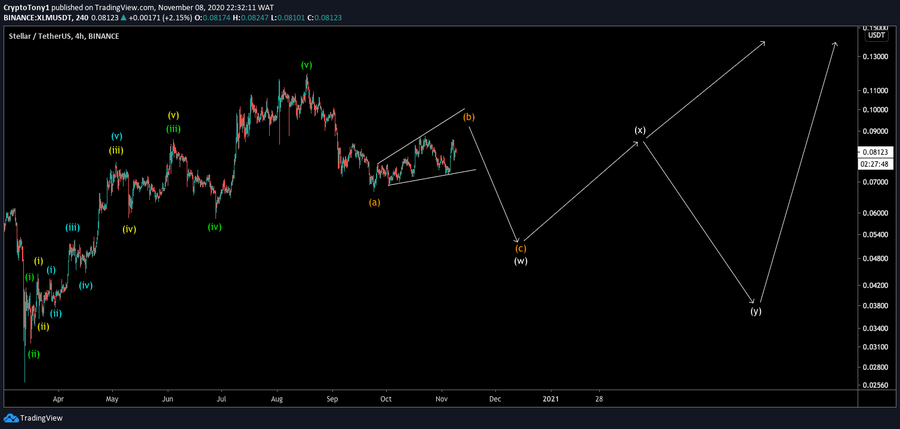

Disclaimer
In line with the Trust Project guidelines, this price analysis article is for informational purposes only and should not be considered financial or investment advice. BeInCrypto is committed to accurate, unbiased reporting, but market conditions are subject to change without notice. Always conduct your own research and consult with a professional before making any financial decisions. Please note that our Terms and Conditions, Privacy Policy, and Disclaimers have been updated.

Valdrin Tahiri
Valdrin discovered cryptocurrencies while he was getting his MSc in Financial Markets from the Barcelona School of Economics. Shortly after graduating, he began writing for several different cryptocurrency related websites as a freelancer before eventually taking on the role of BeInCrypto's Senior Analyst.
(I do not have a discord and will not contact you first there. Beware of scammers)
READ FULL BIO
Sponsored
Sponsored