

The Stellar (XLM) price broke out from a descending wedge and reached the current range highs. It is trading inside an ascending triangle.
XLM Price Highlights
- The price broke out from a descending wedge.
- There is support at 650 satoshis.
- XLM has moved above its 200-day moving average.
- It is possibly trading inside an ascending triangle.
- There is resistance at 820 and 900 satoshis.
Will the XLM price break out? If so, what highs will it reach?$XLM looking to follow $XRP
— Crypto Rand (@crypto_rand) February 4, 2020
More entries and analysis: https://t.co/QsoXBhS8Rx pic.twitter.com/tfbCXdjKn3
Stellar Support Area
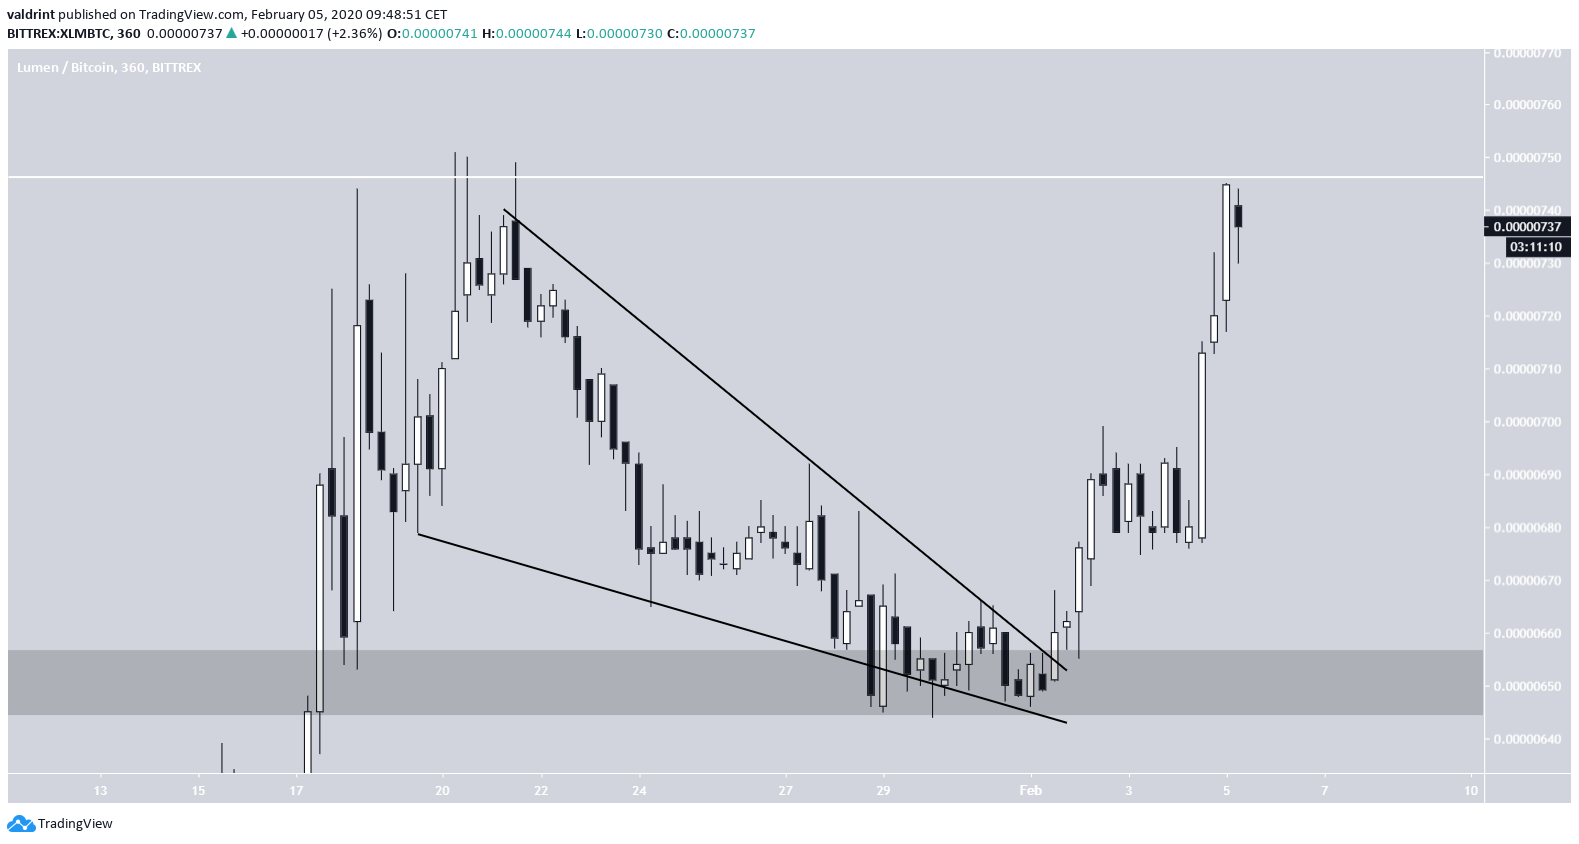
The XLM price reached a low of 572 satoshis on January 14 and has been increasing since. On February 1, the XLM price reached the 650 satoshi area, validated it as support, and moved upward. It is currently trading at the range highs at 740 satoshis. This movement caused the price to move above its 200-day moving average (MA), which had rejected it previously on January 20. This is a bullish development that shows that the price has moved above a significant resistance.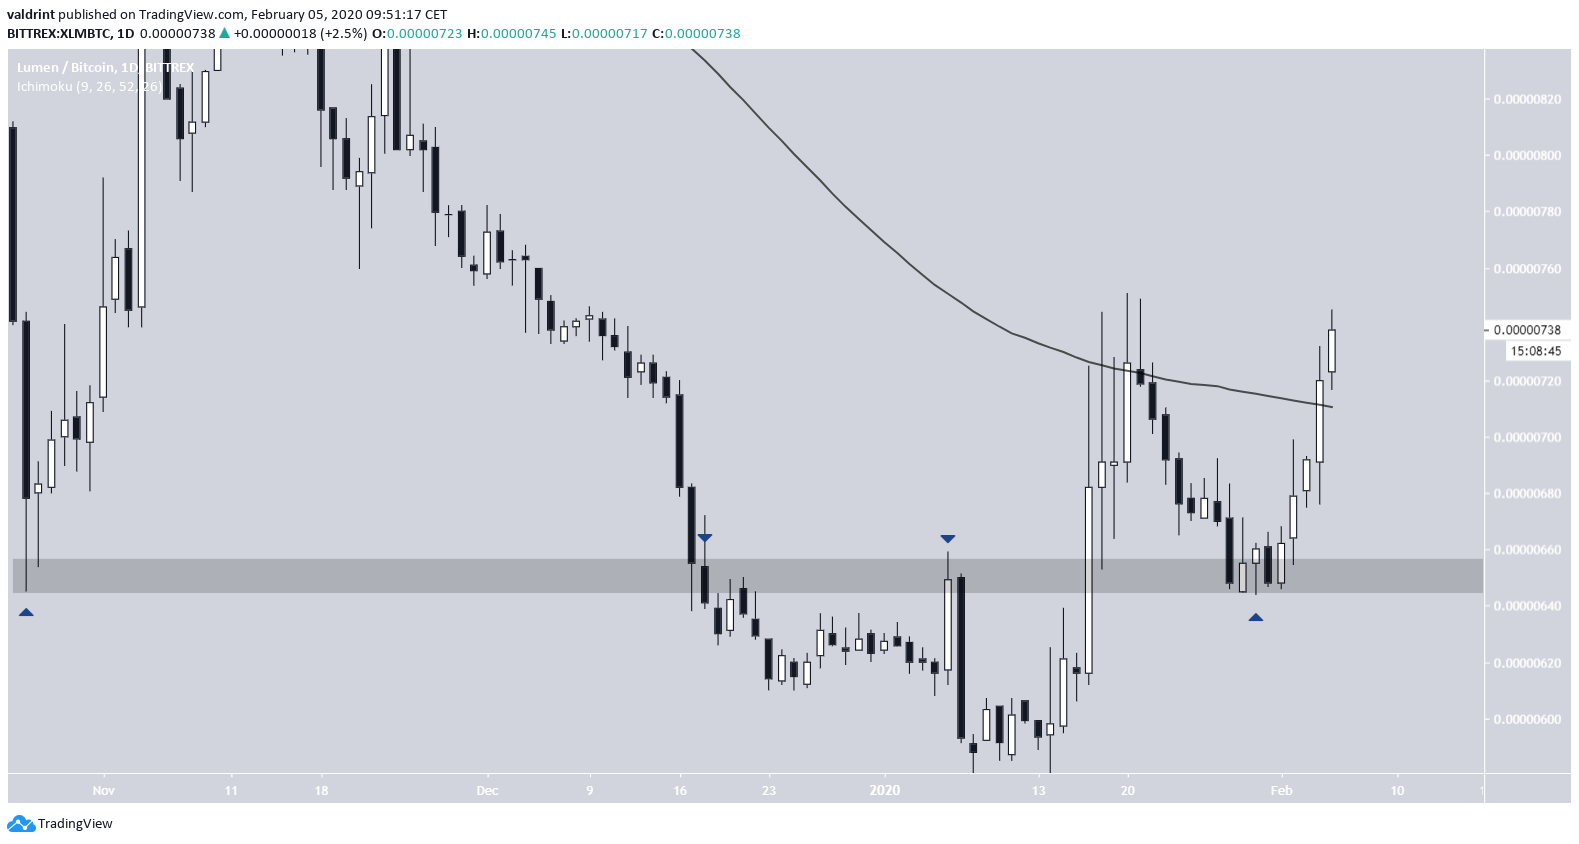 A closer look at this movement reveals that the price broke out from a descending wedge and is currently at the exact same level as the January 20/21 highs and the top of the wedge.
Ascending Triangle
The ascending triangle outlined in the tweet has been developing since January 13. This is a bullish pattern, out of which a breakout would be customary. There are a couple of bullish signs. First, there is no bearish divergence in the RSI — which, to the contrary, is going up with strength. In addition, while the price respected the resistance of 740 satoshis during the current upward move, it reached a price close at it instead of creating a long upper wick and moving downward like it did on January 20. Therefore, after possibly some more consolidation between support and resistance, the XLM price is likely to break out.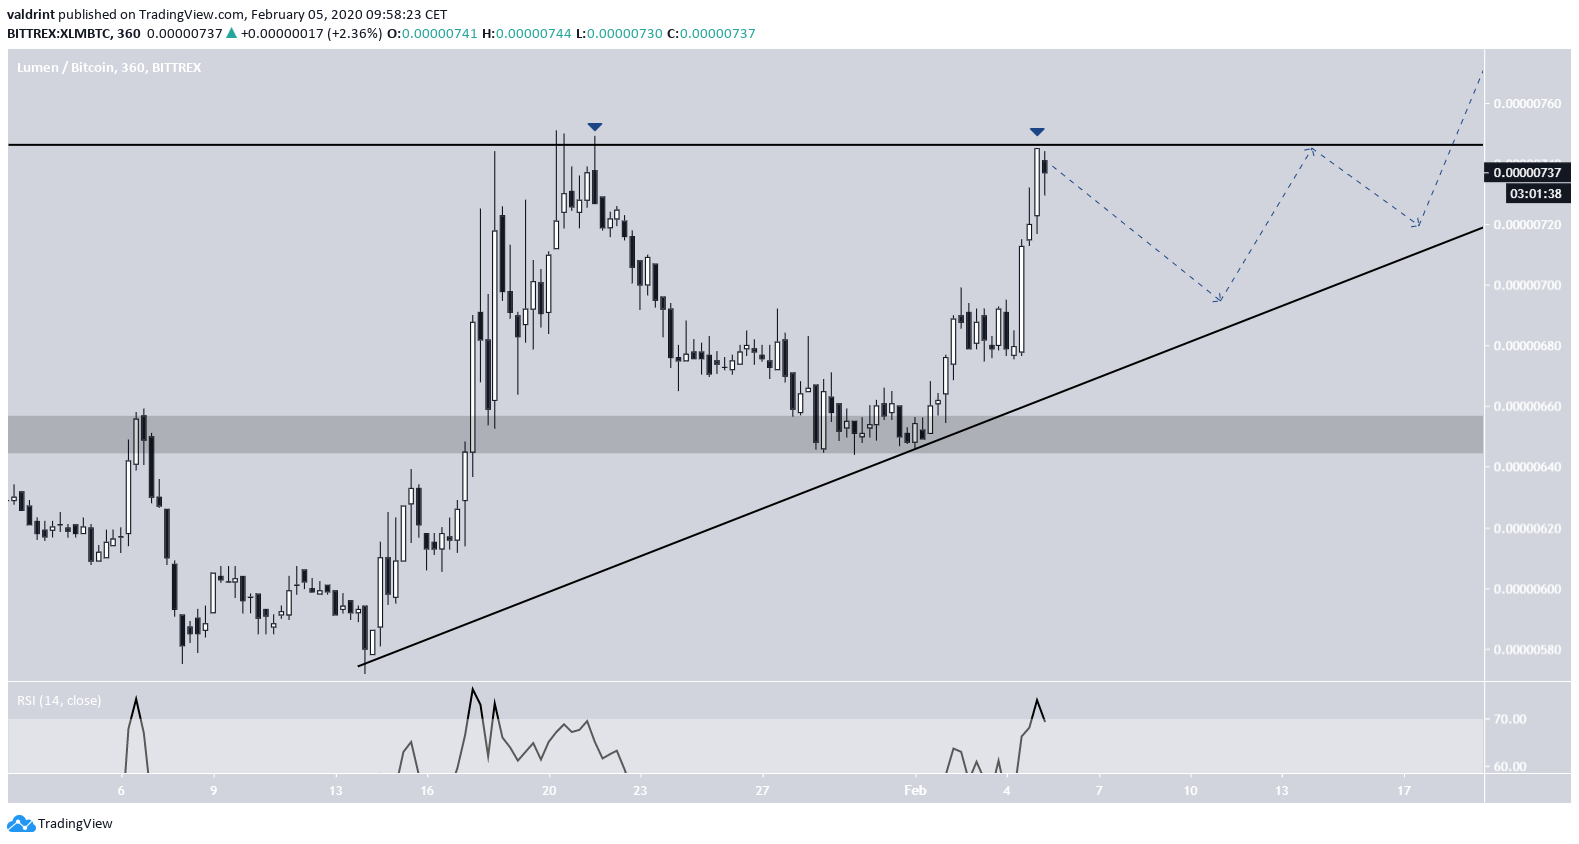
After the Breakout
The closest resistance areas are found at 820 and 900 satoshis. A breakout that travels the entire height of the triangle would take the price to the latter. While there could be some struggle at moving above 820, the price is expected to eventually reach the second resistance area.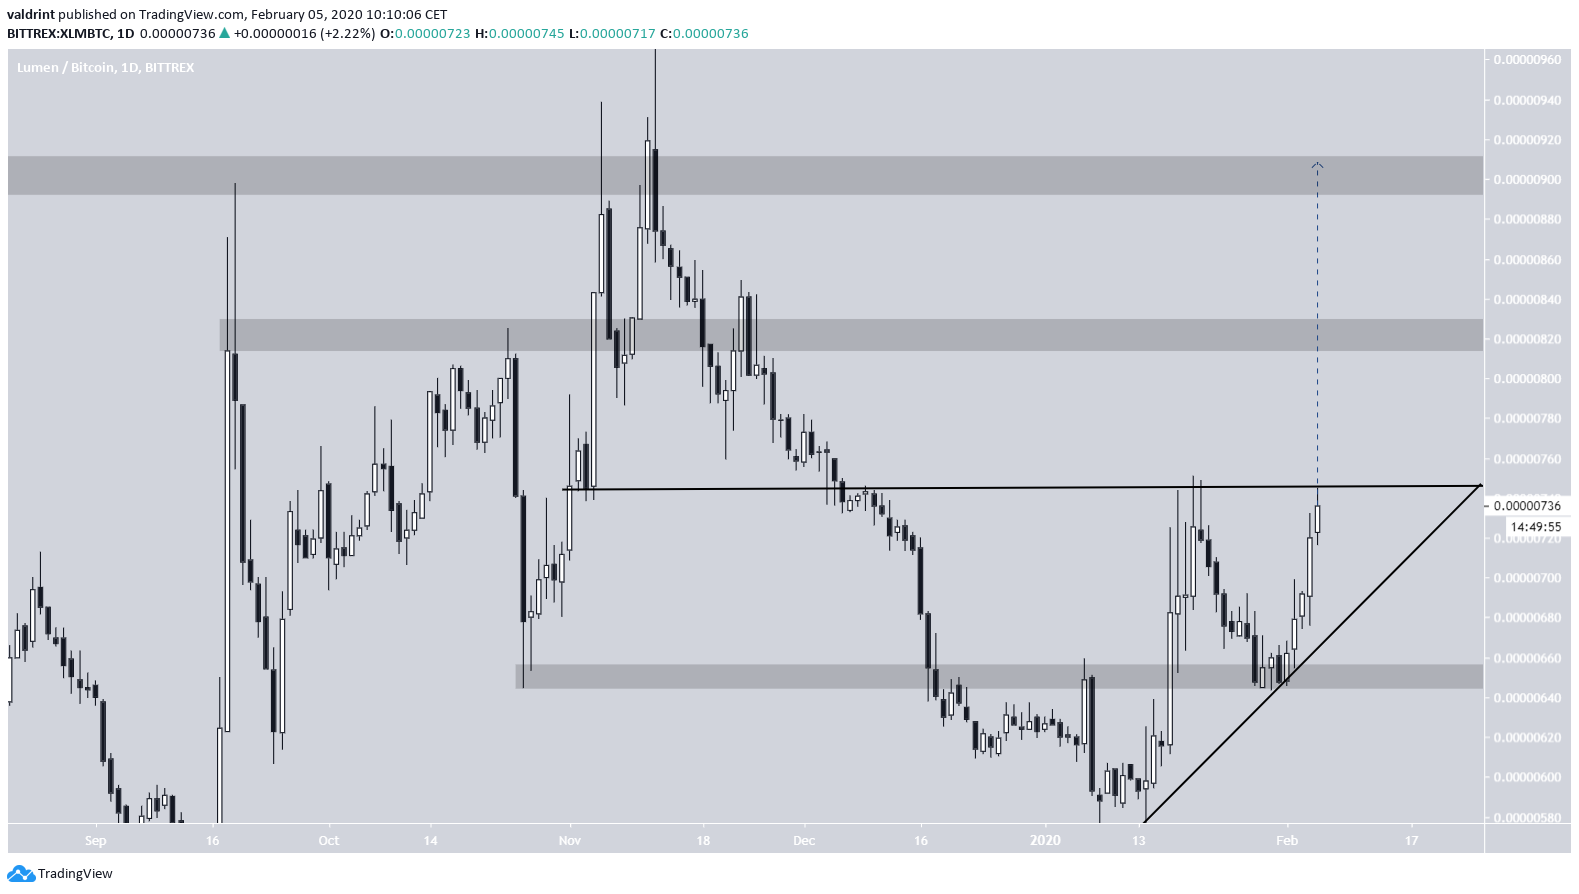 To conclude, the XLM price is currently trading inside an ascending triangle out of which we believe it will break out and reach at least one of the targets outlined above.
Disclaimer
In line with the Trust Project guidelines, this price analysis article is for informational purposes only and should not be considered financial or investment advice. BeInCrypto is committed to accurate, unbiased reporting, but market conditions are subject to change without notice. Always conduct your own research and consult with a professional before making any financial decisions. Please note that our Terms and Conditions, Privacy Policy, and Disclaimers have been updated.

Valdrin Tahiri
Valdrin discovered cryptocurrencies while he was getting his MSc in Financial Markets from the Barcelona School of Economics. Shortly after graduating, he began writing for several different cryptocurrency related websites as a freelancer before eventually taking on the role of BeInCrypto's Senior Analyst.
(I do not have a discord and will not contact you first there. Beware of scammers)
READ FULL BIO
Sponsored
Sponsored