

Solana (SOL) has reclaimed the $1.35 support area after initially deviating below it. It’s currently making an attempt at breaking out above $2.50.
Technical indicators and the wave count support the possibility of a breakout that could eventually lead Solana to a high near $5.
Solana Bounces Above Support
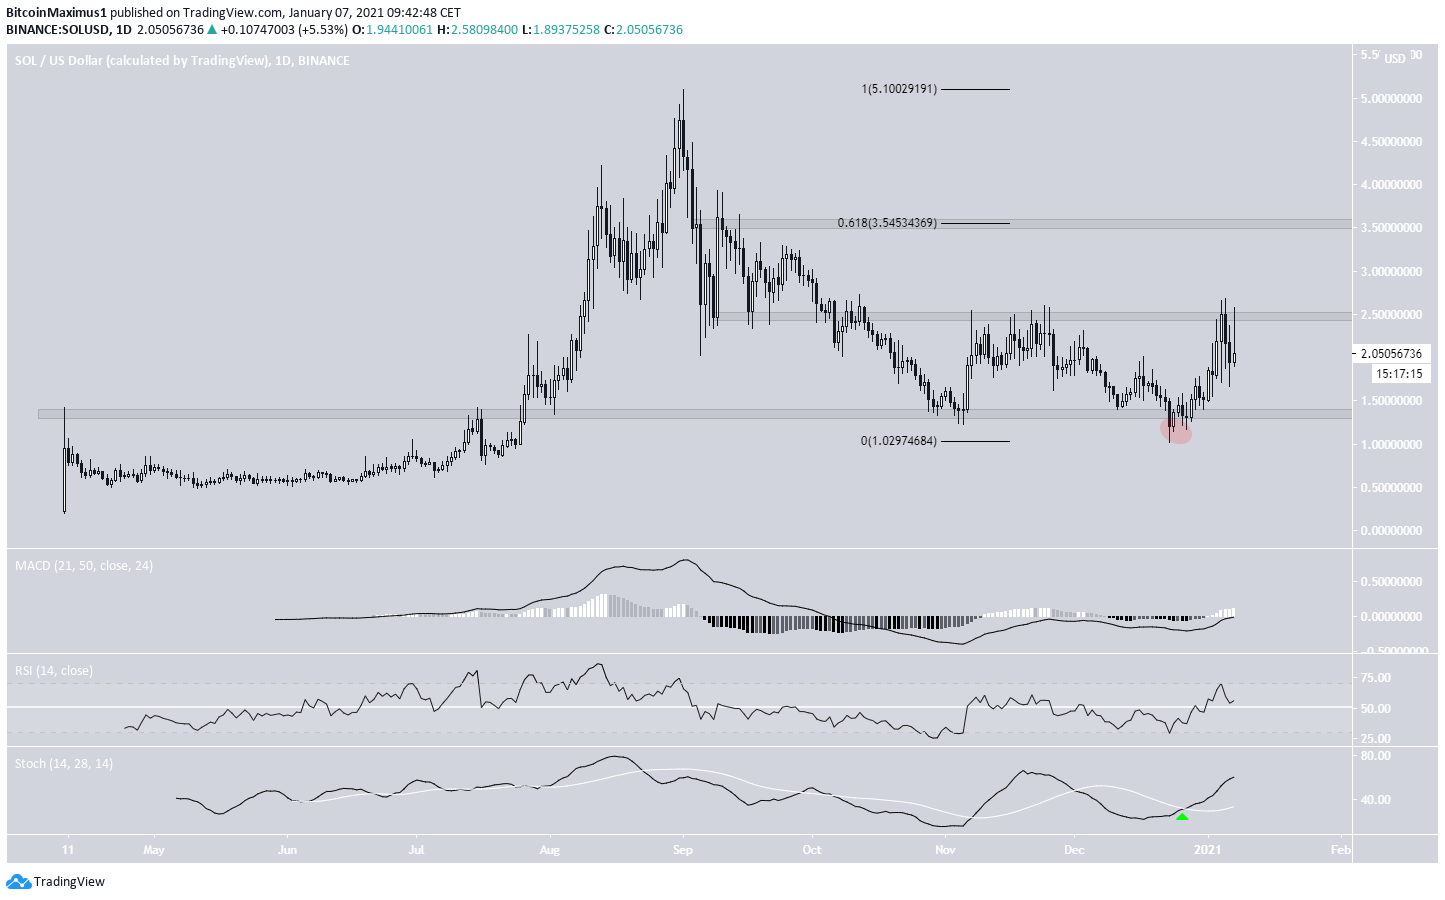
The SOL price has been decreasing since Sept. 1 after reaching a high of $5.10. The downward move continued until a low of $1.22 was reached on Nov. 5. The low served to validate the $1.35 area as support and was the catalyst for an upward move towards the $2.50 resistance area.
However, SOL was rejected and began another downward move that led to a deviation and a retest of the $1.35 area. Currently, SOL is in the process of making another attempt at breaking out above $2.50.
If successful, the next resistance area would be found at $3.55 (0.618 Fib retracement level) and $5.10 — the top of the same move.
Technical indicators are bullish and support the possibility that SOL will break out.
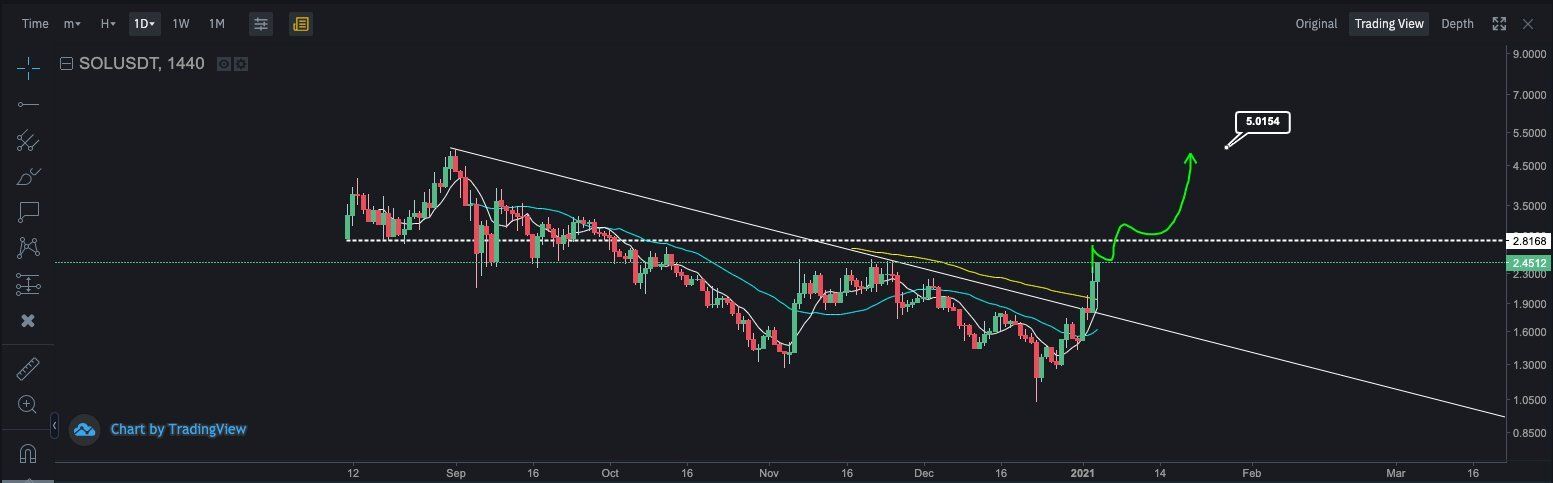
Cryptocurrency trader @CryptoNewton outlined a SOL chart, stating that it is likely to increase all the way to $5.
While there is a significant resistance area at $3.50 as outlined above, SOL is likely to increase to $5 if it manages to clear resistance.
Short-Term SOL Movement
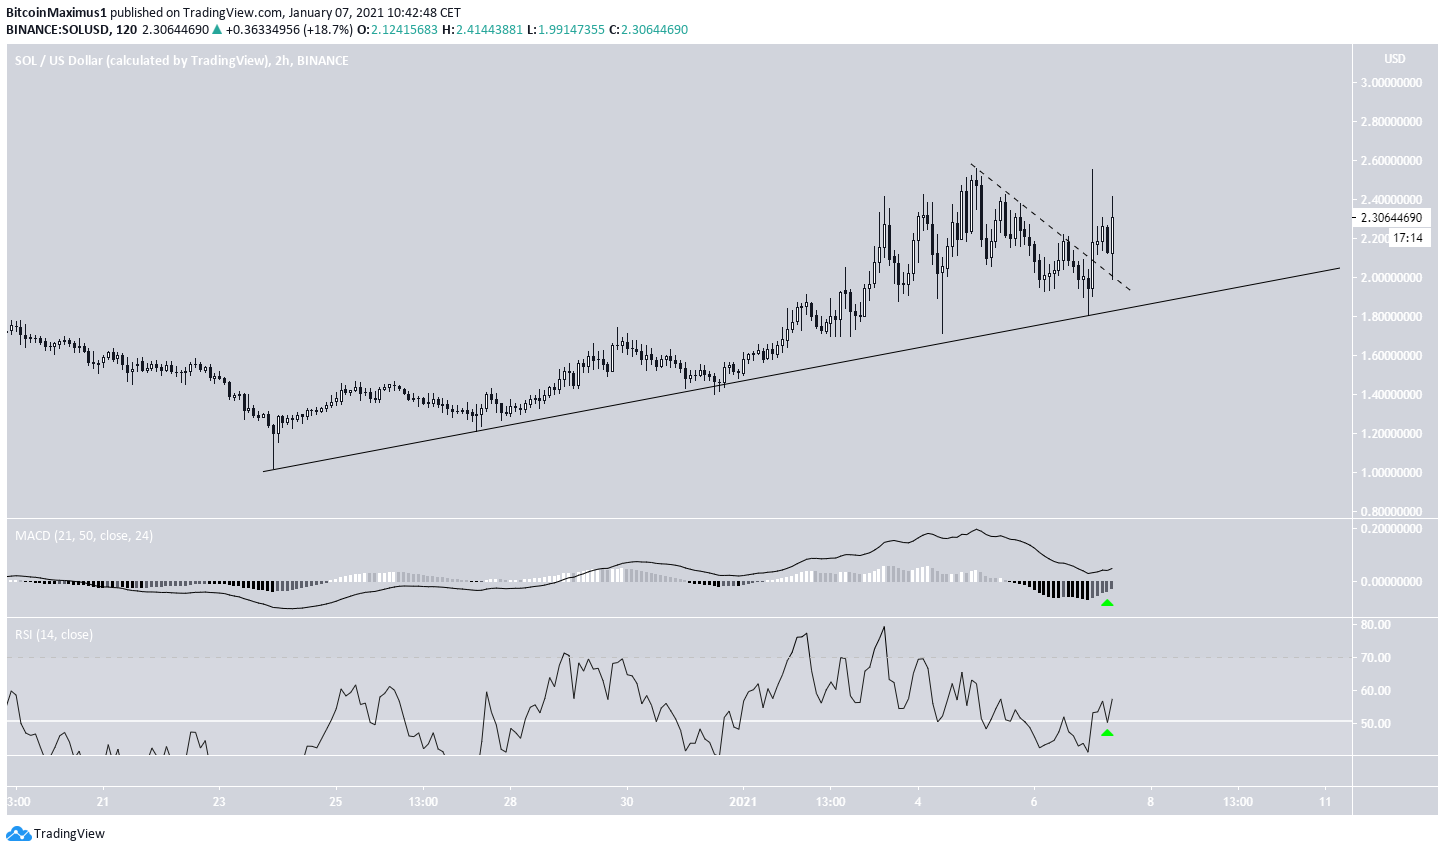
The two-hour chart shows that SOL has been following an ascending support line since Dec. 24. Furthermore, SOL has broken out from a descending resistance line (dashed) and validated it as support after.
These are both bullish signs, suggesting that SOL is likely to continue increasing.
Similar to the daily time-frame, technical indicators are bullish and support the continuation of the upward movement.
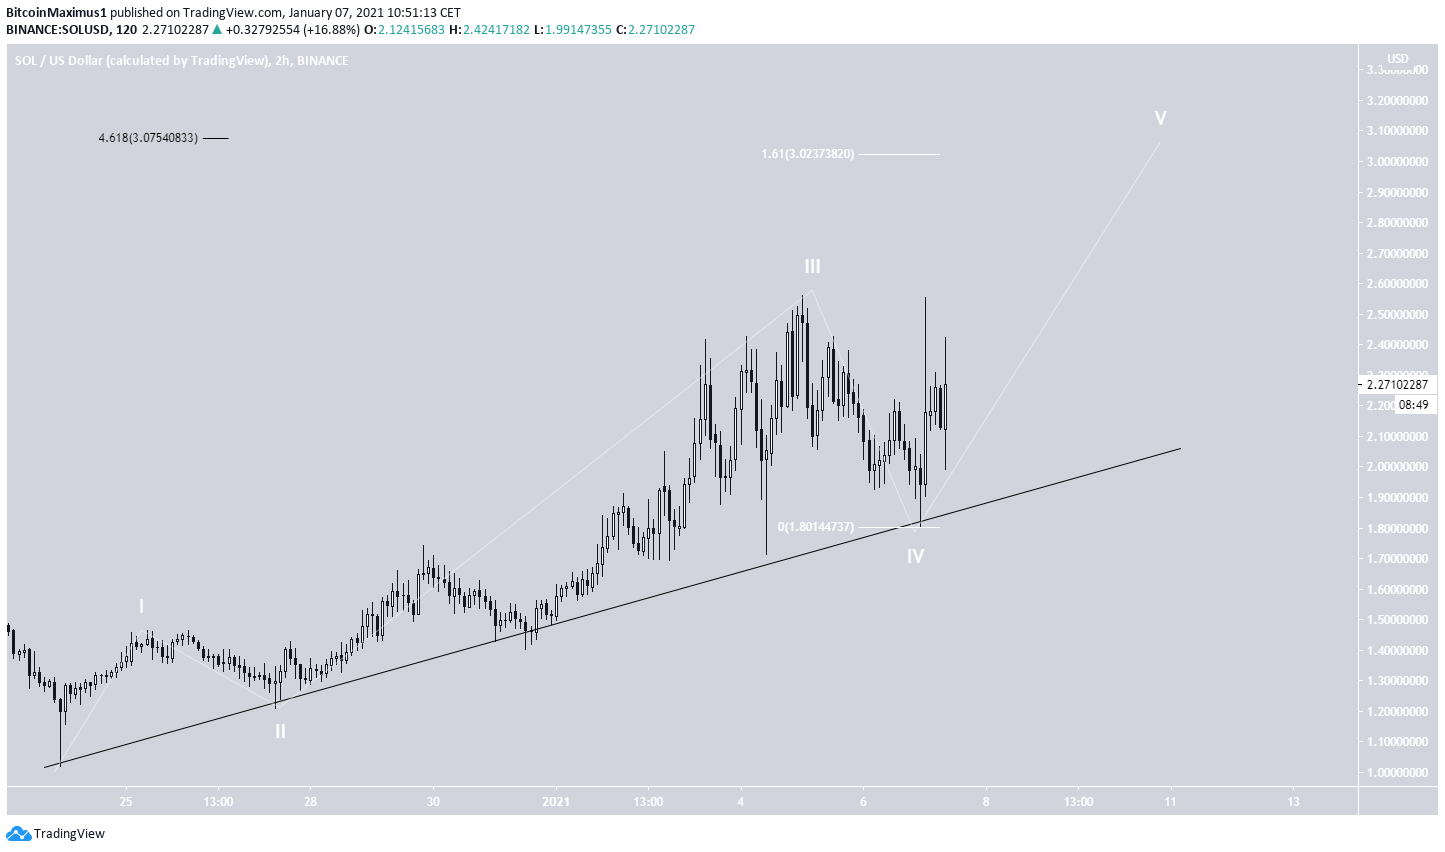
The wave count suggests that SOL is in wave 5 of a bullish impulse, which has a target between $3.02-$3.07. The target is found by using a Fib extension on wave 1 (black) and an external retracement on wave 5 (white).
The target between $3.02-$3.07 is also the 0.5 Fib retracement level of the entire downward move, making it likely to act as a top.
Conclusion
Solana (SOL) is expected to break out above the $2.50 resistance area and increase toward the range of $3 and $5.
For BeInCrypto’s latest Bitcoin (BTC) analysis, click here!
Disclaimer: Cryptocurrency trading carries a high level of risk and may not be suitable for all investors. The views expressed in this article do not reflect those of BeInCrypto.
Trusted
Disclaimer
In line with the Trust Project guidelines, this price analysis article is for informational purposes only and should not be considered financial or investment advice. BeInCrypto is committed to accurate, unbiased reporting, but market conditions are subject to change without notice. Always conduct your own research and consult with a professional before making any financial decisions. Please note that our Terms and Conditions, Privacy Policy, and Disclaimers have been updated.
