

Cosmos (ATOM), Stellar (XLM), Elrond (EGLD), and Waves (WAVES) have broken out from diagonal and/or horizontal resistance levels. Continued increases for them seem likely.
While the altcoins outlined in this article are not actually used in any projects that deal with space, their names are in one way or another related to a space object or event.
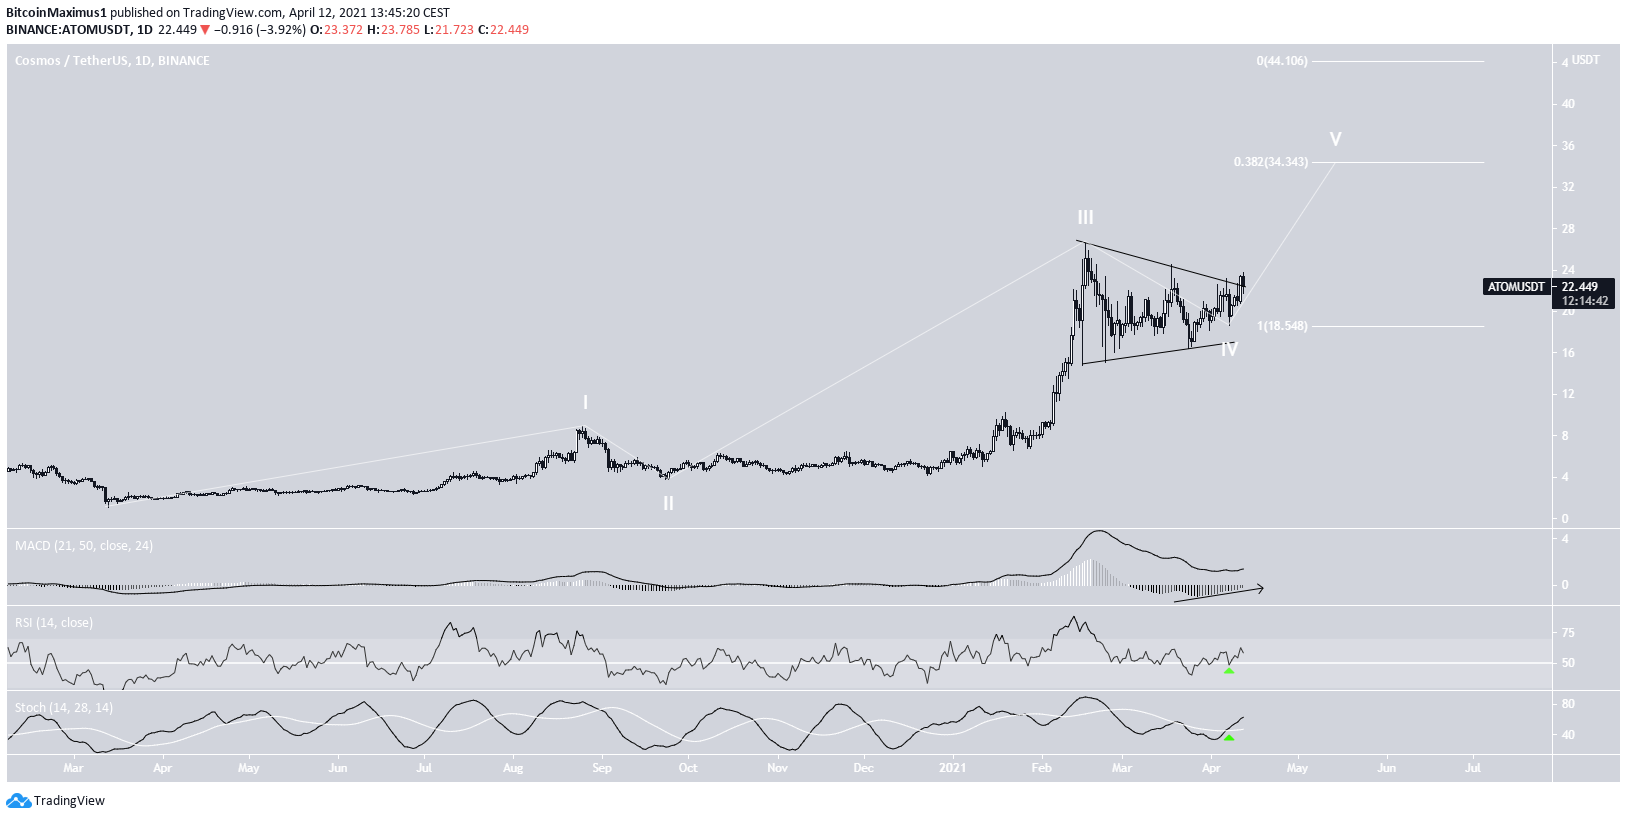
Cosmos (ATOM)
ATOM has been moving downwards since Feb. 16, when it had reached an all-time high price of $26.55. Since then, it has been trading inside a symmetrical triangle. This was likely wave four of a long-term bullish impulse which began in March 2020.
On April 11, ATOM managed to break out from this triangle.
A potential target for the top of the upward movement is found at $34.3 and $44.1.
Technical indicators support this upward movement. The RSI has bounced at the 50 line, and the Stochastic oscillator has made a bullish cross. While the MACD is not yet positive, it has given a bullish reversal signal.
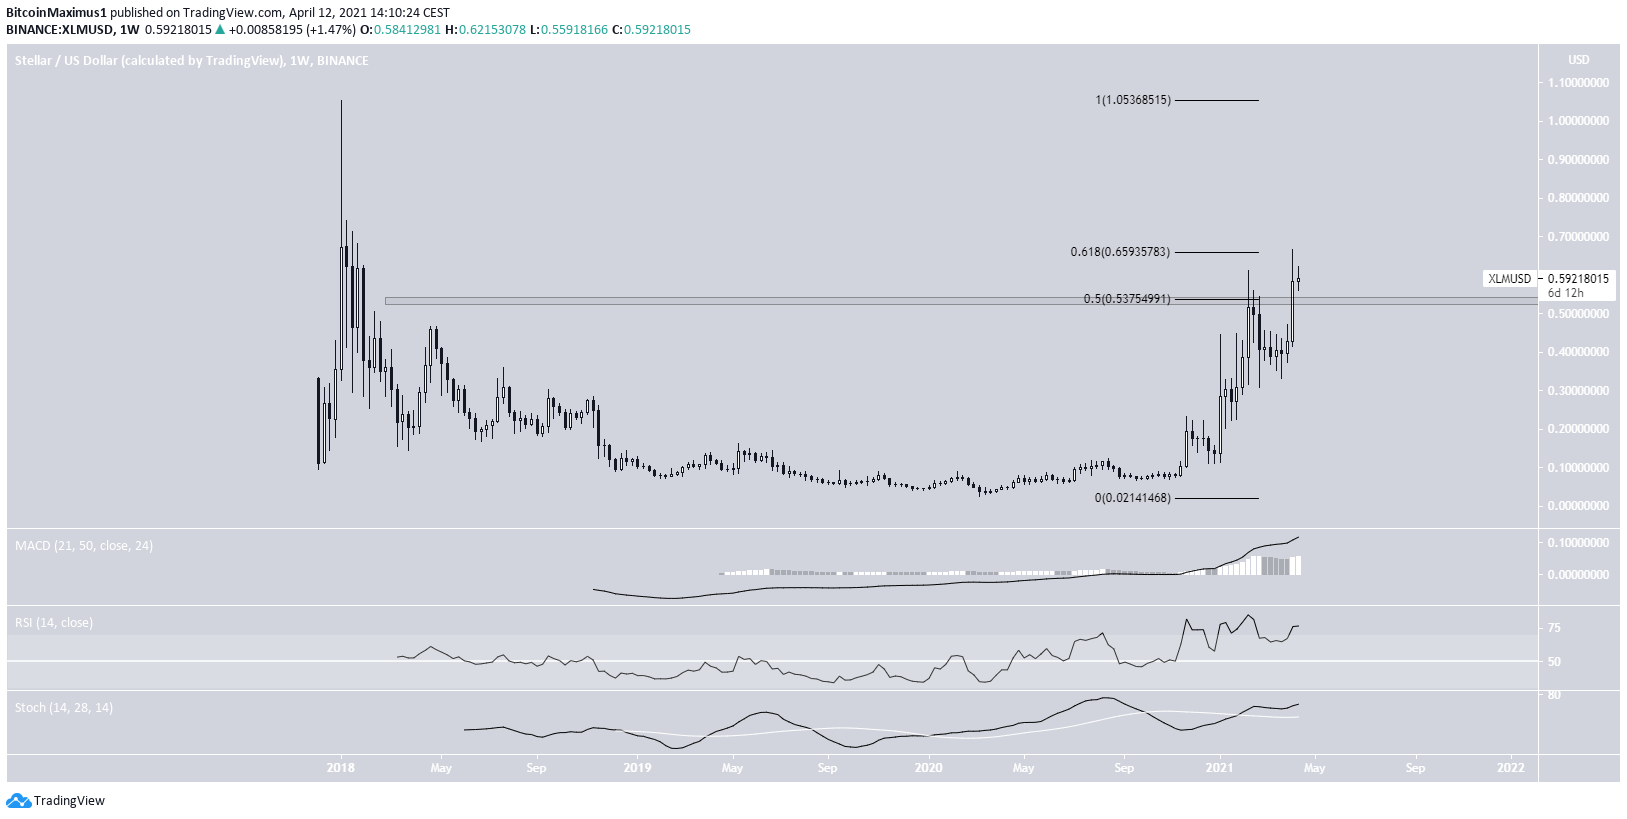
Stellar (XLM)
Last week, XLM finally managed to move above the $0.53 resistance area. This is a long-term resistance which is also the 0.5 Fib retracement level of the entire previous downward movement.
The breakout above this level is a strong bullish sign that indicates XLM could continue increasing higher.
Besides the bearish divergence in the RSI, the MACD & Stochastic oscillator support this possibility.
While XLM has been rejected by the 0.618 Fib retracement resistance at $0.66, a breakout above it would take XLM to a new all-time high price.
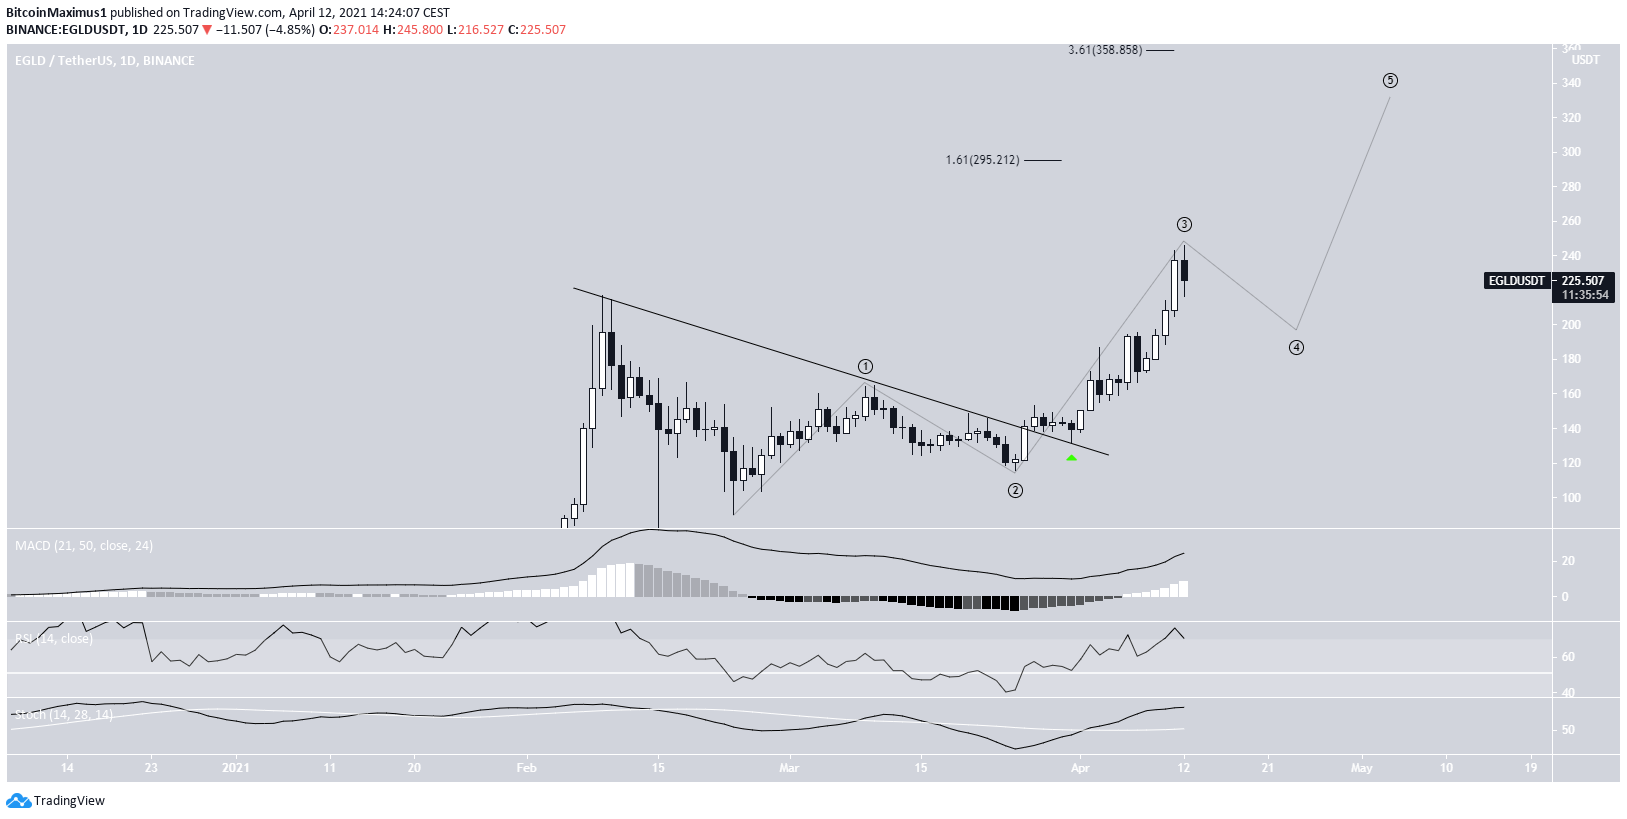
Elrond (EGLD)
EGLD has been moving upwards since breaking out from a descending resistance line on March 26. It managed to reach a new all-time high price of $245.8 on April 12.
EGLD seems to be in wave three of a bullish impulse.
While a more accurate target can be determined once wave four is done, the two most likely levels for the top of the move are found at $295 and $360.
Technical indicators in the daily time frame support the continuation of the upward movement towards these levels.
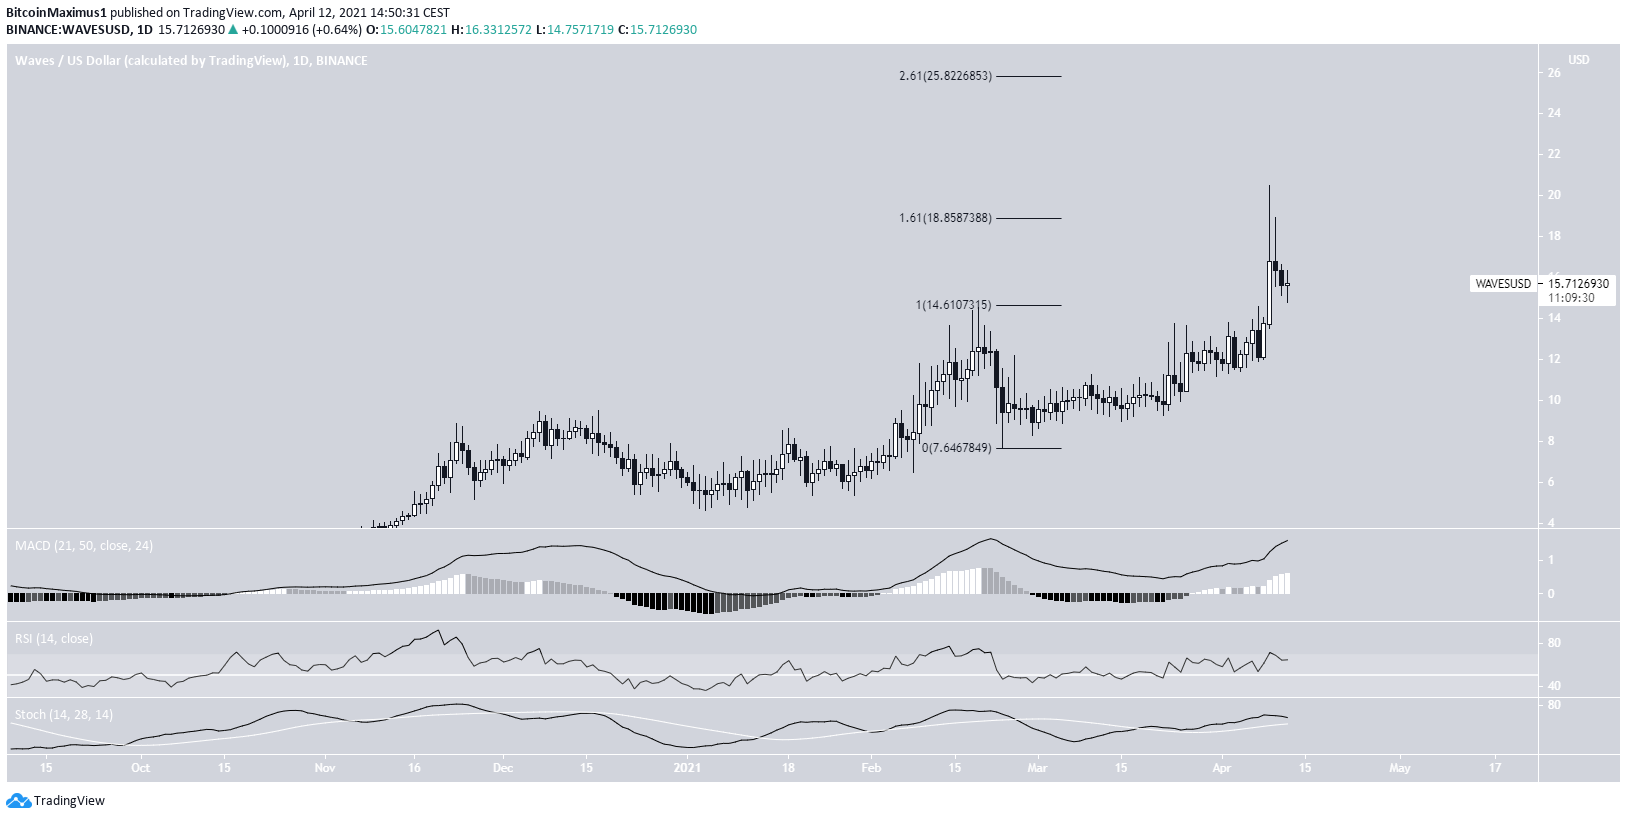
Waves (WAVES)
On April 9, WAVES broke out above the $14.60 resistance area and proceeded to reach a high of $20.47 the same day.
WAVES has been decreasing since. However, the drop seems to be a validation of the $14.60 area as support.
If successful, WAVES would be expected to increase once more towards $18.80 and potentially $25.80. Technical indicators support this possibility.
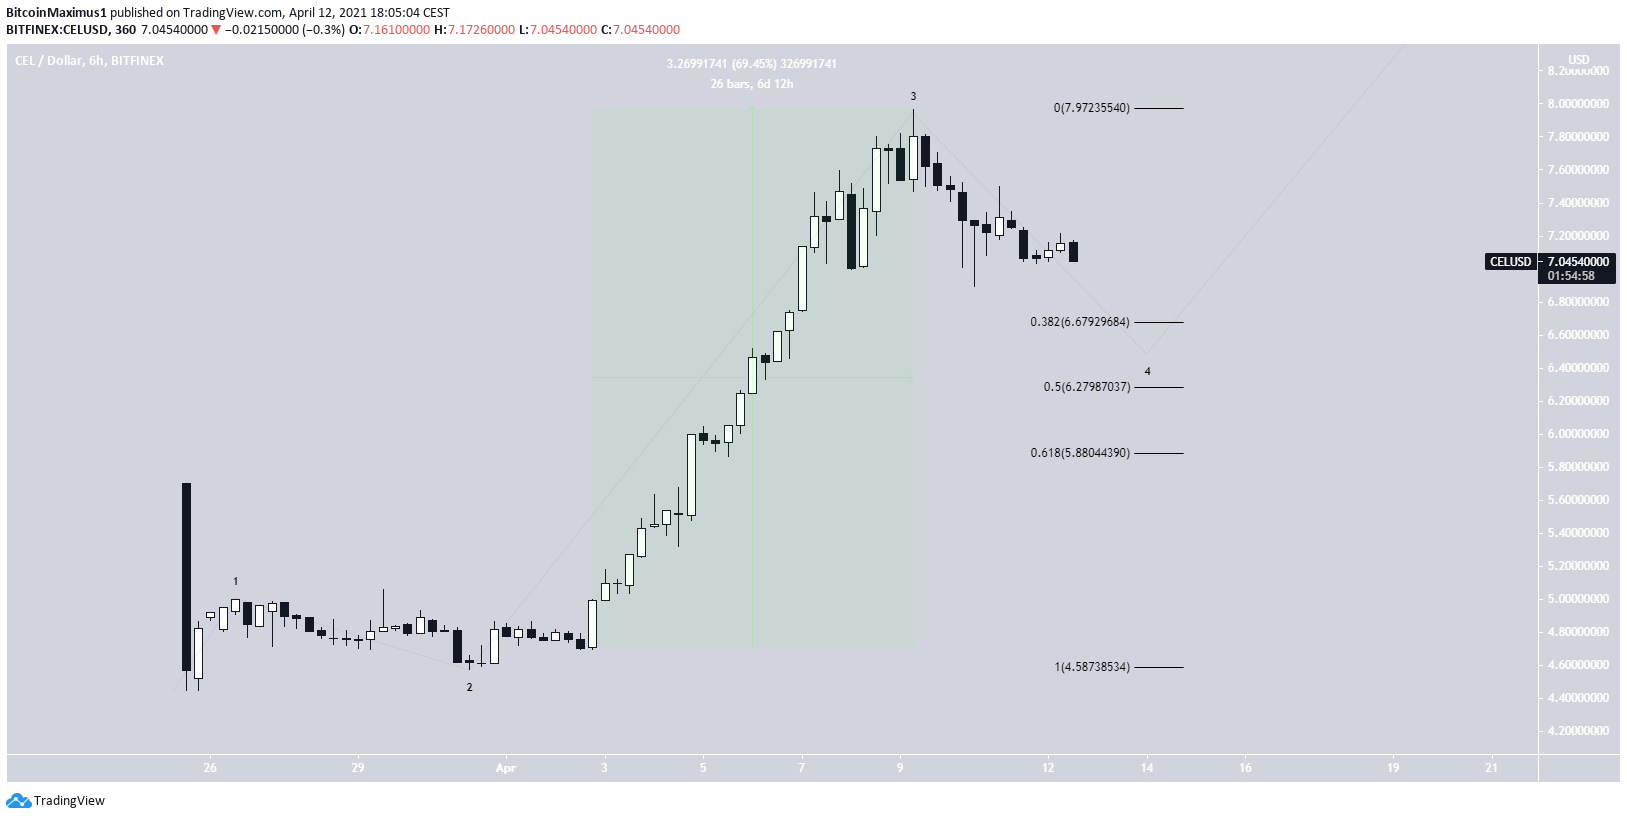
Celcius (CEL)
CEL has been moving upwards since its listing.
Beginning on April 2, it increased by 70% in six days. This led to an all-time high price of $7.96 on April 9. CEL has been moving downwards since.
The upward movement resembles a bullish impulse, in which CEL is currently in wave four.
The two main support levels are found at $6.67 and $6.27. These are the 0.382 and 0.5 Fib retracement support levels.
It is likely that CEL finds support at one of these levels before moving upwards once more.
The more bearish scenario would have CEL decreasing to the 0.618 Fib retracement support level at $5.88 before moving upwards.
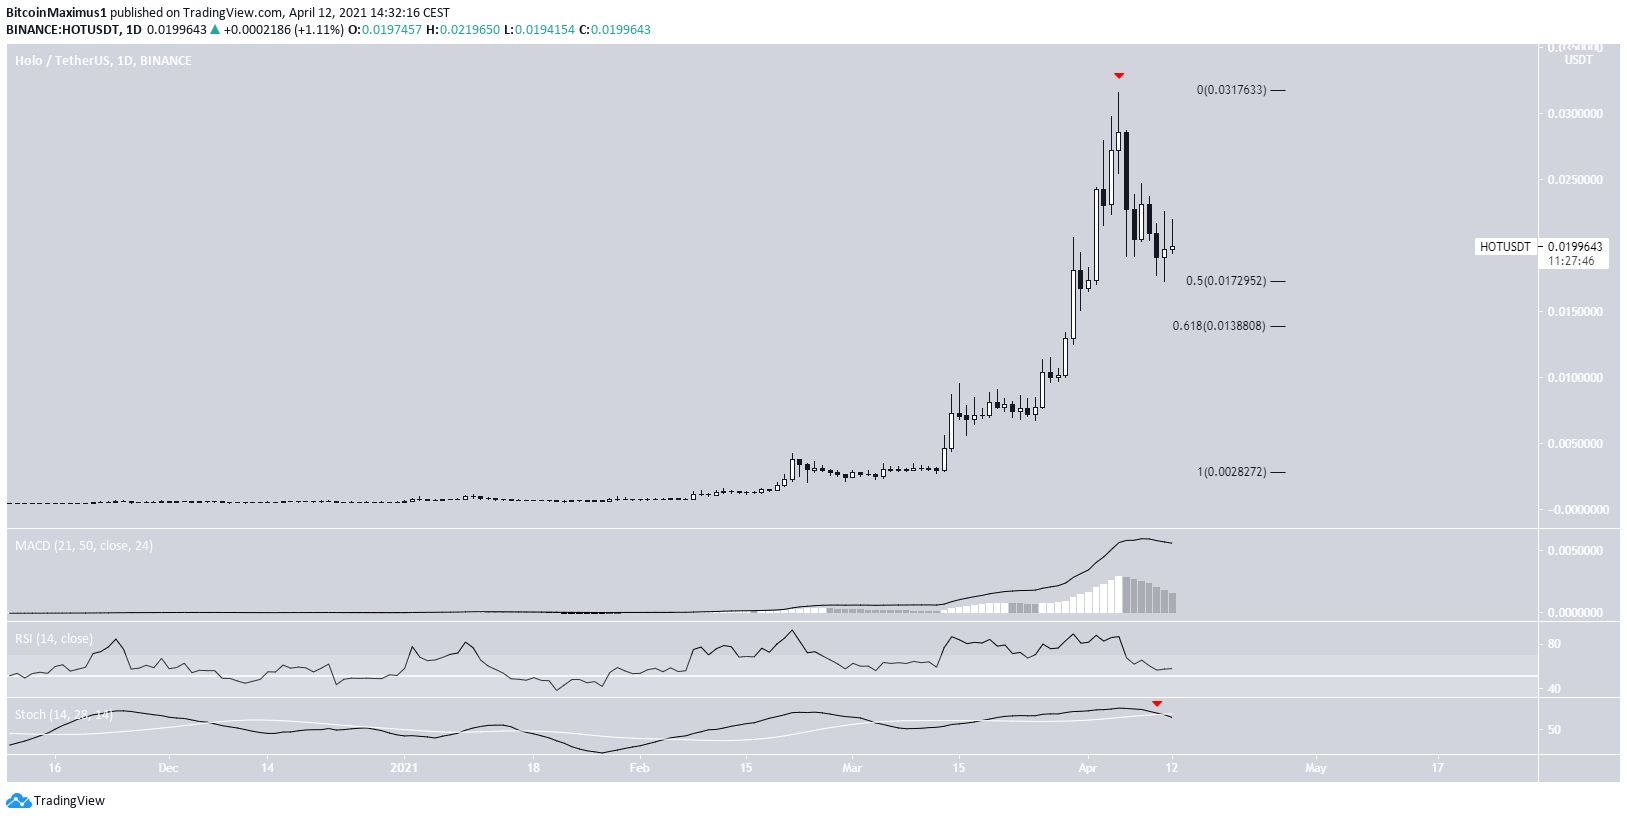
Holo (HOT)
HOT has been moving upwards at a parabolic rate since March 25. This led to an all-time high price of $0.0316 being reached on April 5.
However, HOT created a bearish engulfing candlestick the next day and has been decreasing since. So far, it has reached the 0.5 Fib retracement support level, found at $0.172.
This is also a horizontal support area, indicating that a bounce is likely.
However, technical indicators have turned bearish. Therefore, while a bounce is expected, HOT may continue to correct afterward.
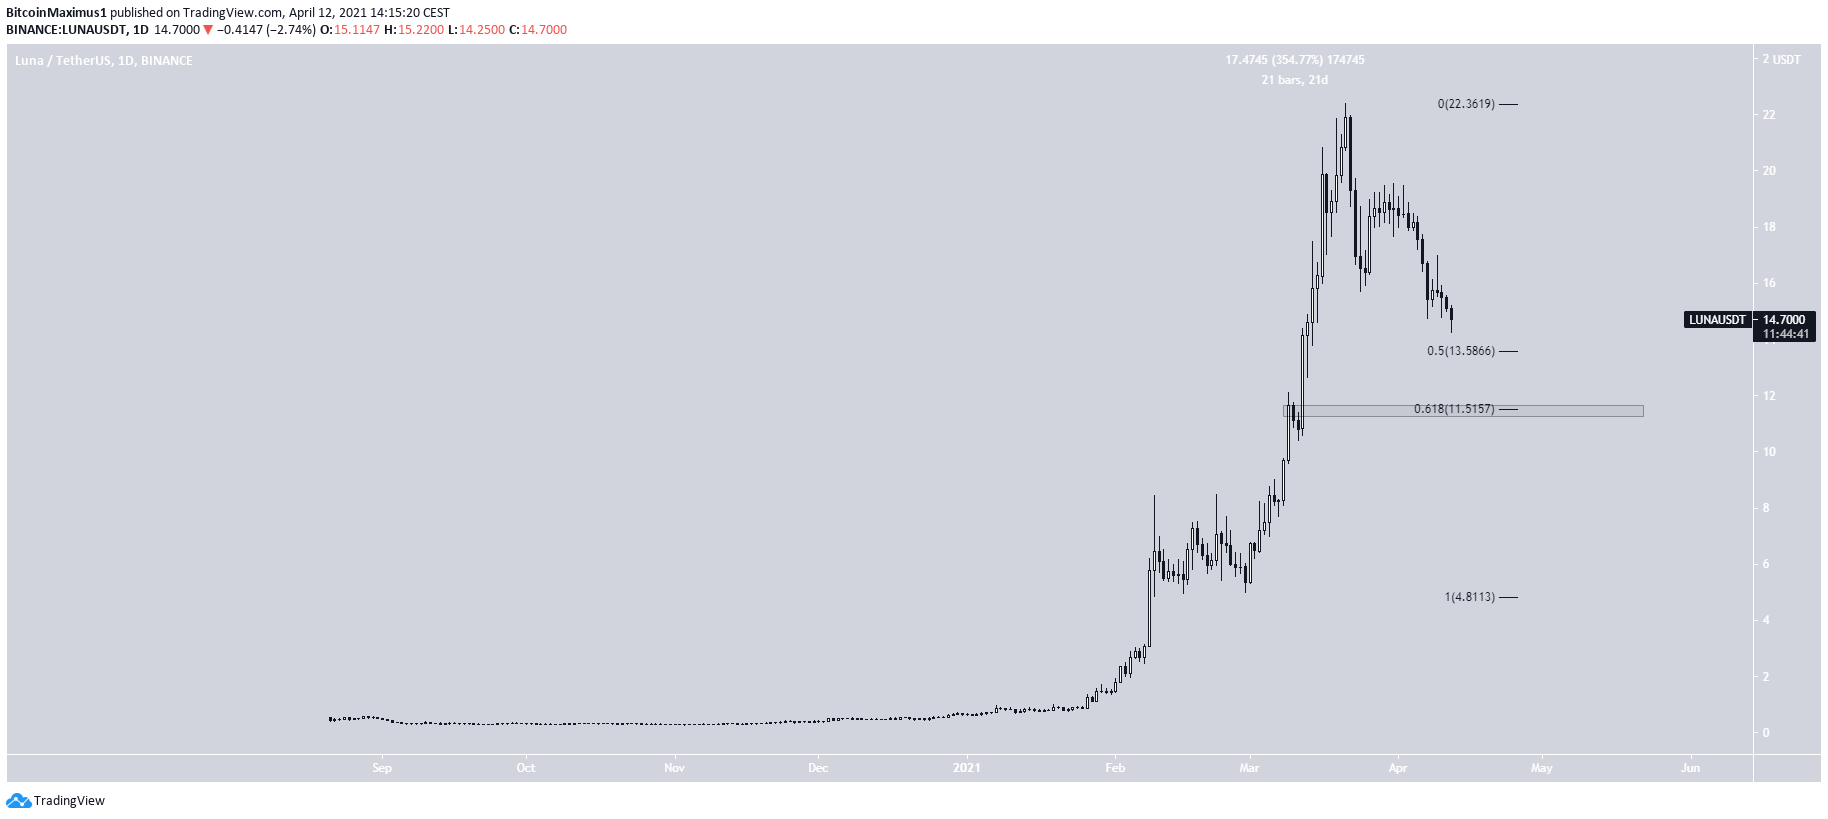
Terra (LUNA)
From Feb. 28 to March 21, LUNA moved upwards parabolically, increasing by 355% in 21 days. The upward movement resembles that of HOT.
This led to an all-time high price of $22.4 being reached. However, LUNA has been moving downward since.
The closest support levels are found at $13.60 and $11.50, the latter also being a horizontal support level.
For BeInCrypto’s latest bitcoin (BTC) analysis, click here.
Trusted
Disclaimer
In line with the Trust Project guidelines, this price analysis article is for informational purposes only and should not be considered financial or investment advice. BeInCrypto is committed to accurate, unbiased reporting, but market conditions are subject to change without notice. Always conduct your own research and consult with a professional before making any financial decisions. Please note that our Terms and Conditions, Privacy Policy, and Disclaimers have been updated.
