

Reserve Rights (RSR) has failed to sustain an upward movement that began in March, and has proceeded to drop to a new yearly low.
RSR has been increasing alongside an ascending support line since Feb 24. While doing so, it proceeded to reach a high of $0.0226 on April 1. The price has been moving downwards since.
While RSR initially bounced at the support line, it finally broke down on April 25 (red icon). This is a bearish sign due to the fact that the bullish structure is no longer intact.

Future RSR movement
Market analyst @Incomesharks tweeted a RSR chart which shows an on-balance volume (OBV) breakout. He stated that the price could increase all the way to $0.016.
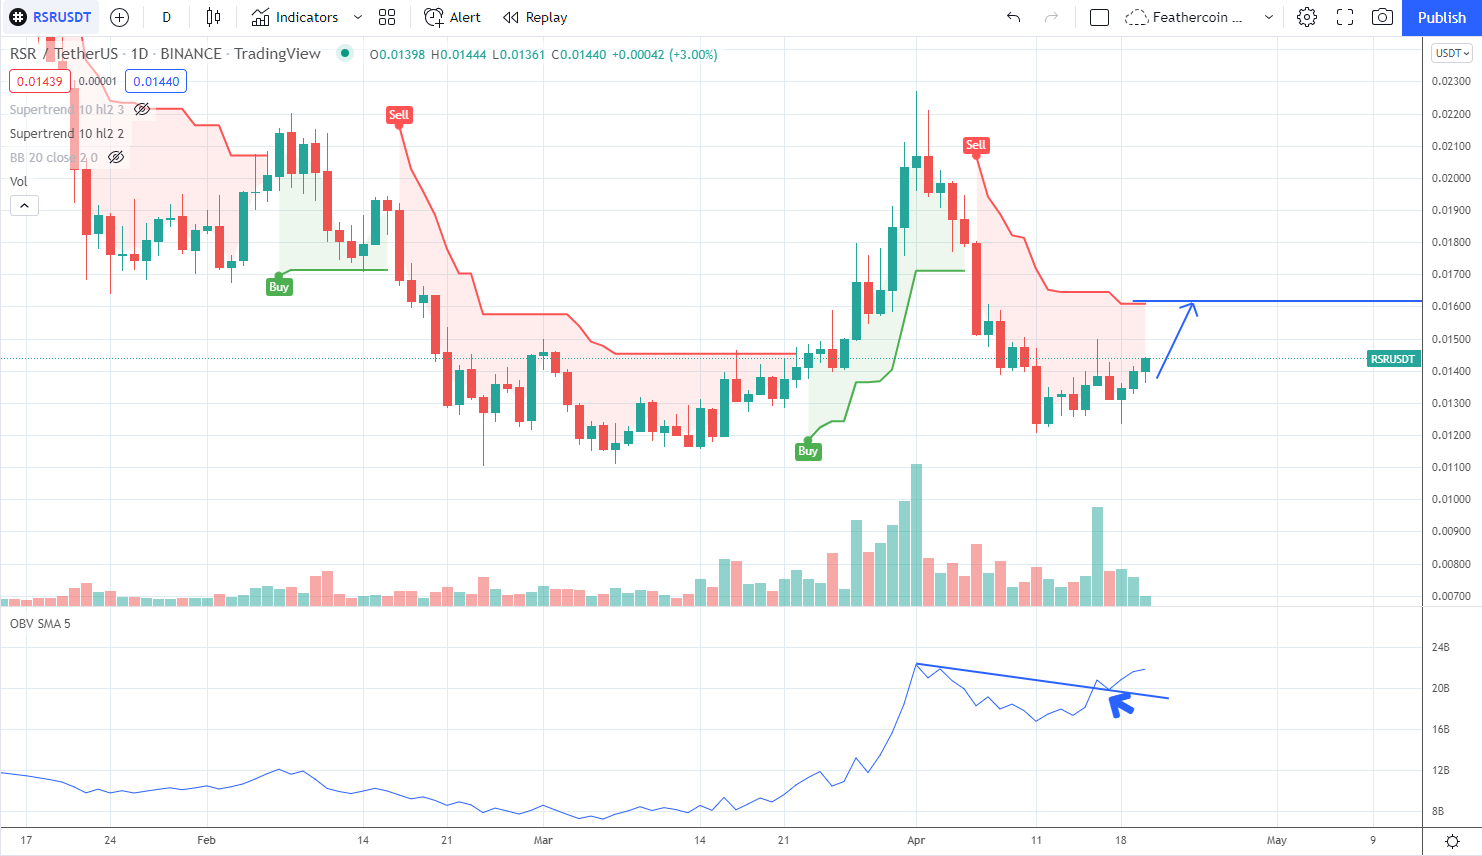
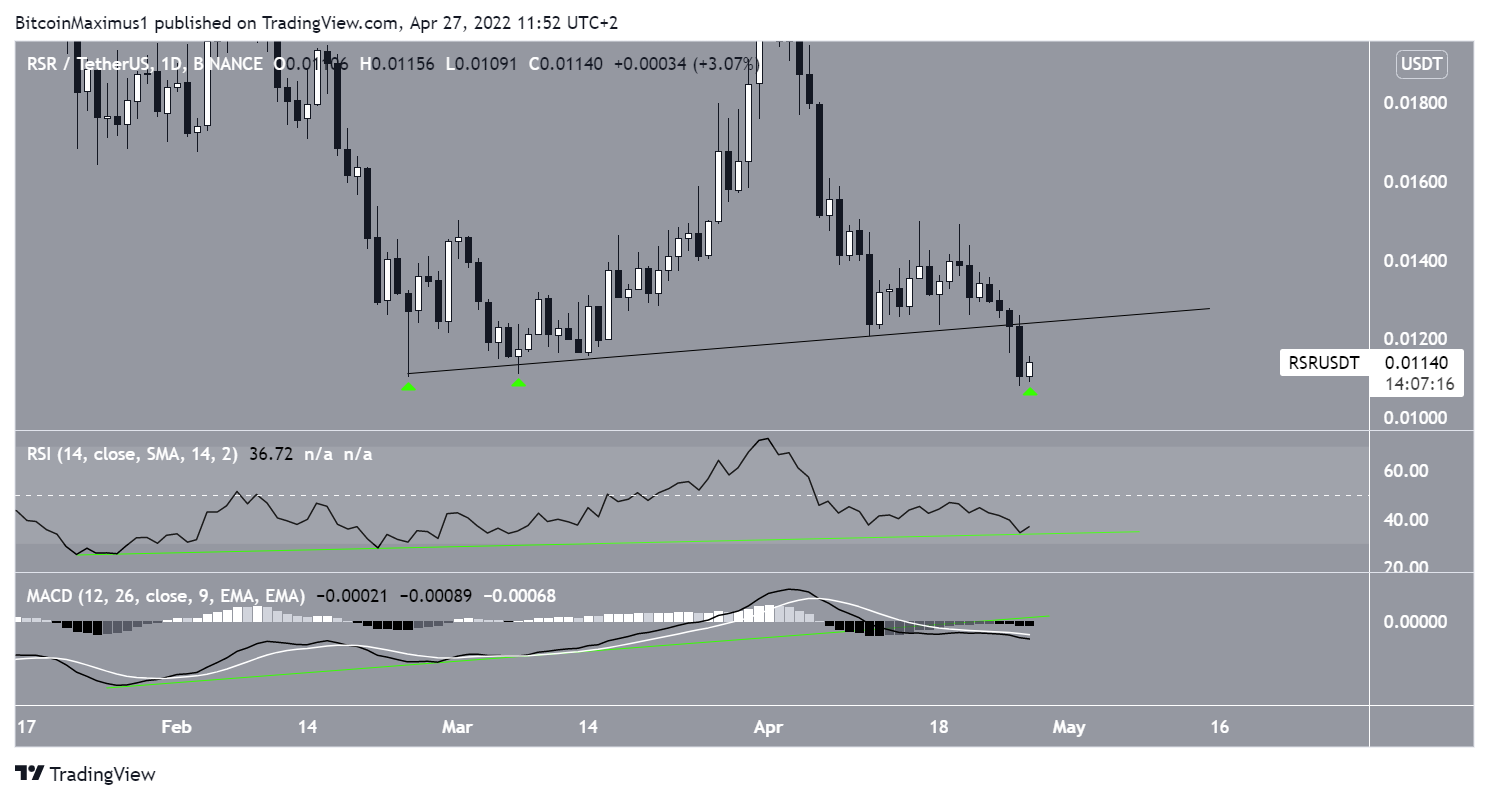
However, since the tweet, RSR has broken down from the ascending support line. In addition to this, technical indicators in the daily time frame are bearish. This is visible in the decreasing MACD and RSI.
While the RSI might have developed a long-term bullish divergence (green line), the trendline of the divergence is not intact in the MACD.
While RSR is still trading inside the wick support area from Feb to March, there are no bullish reversal signs in place.
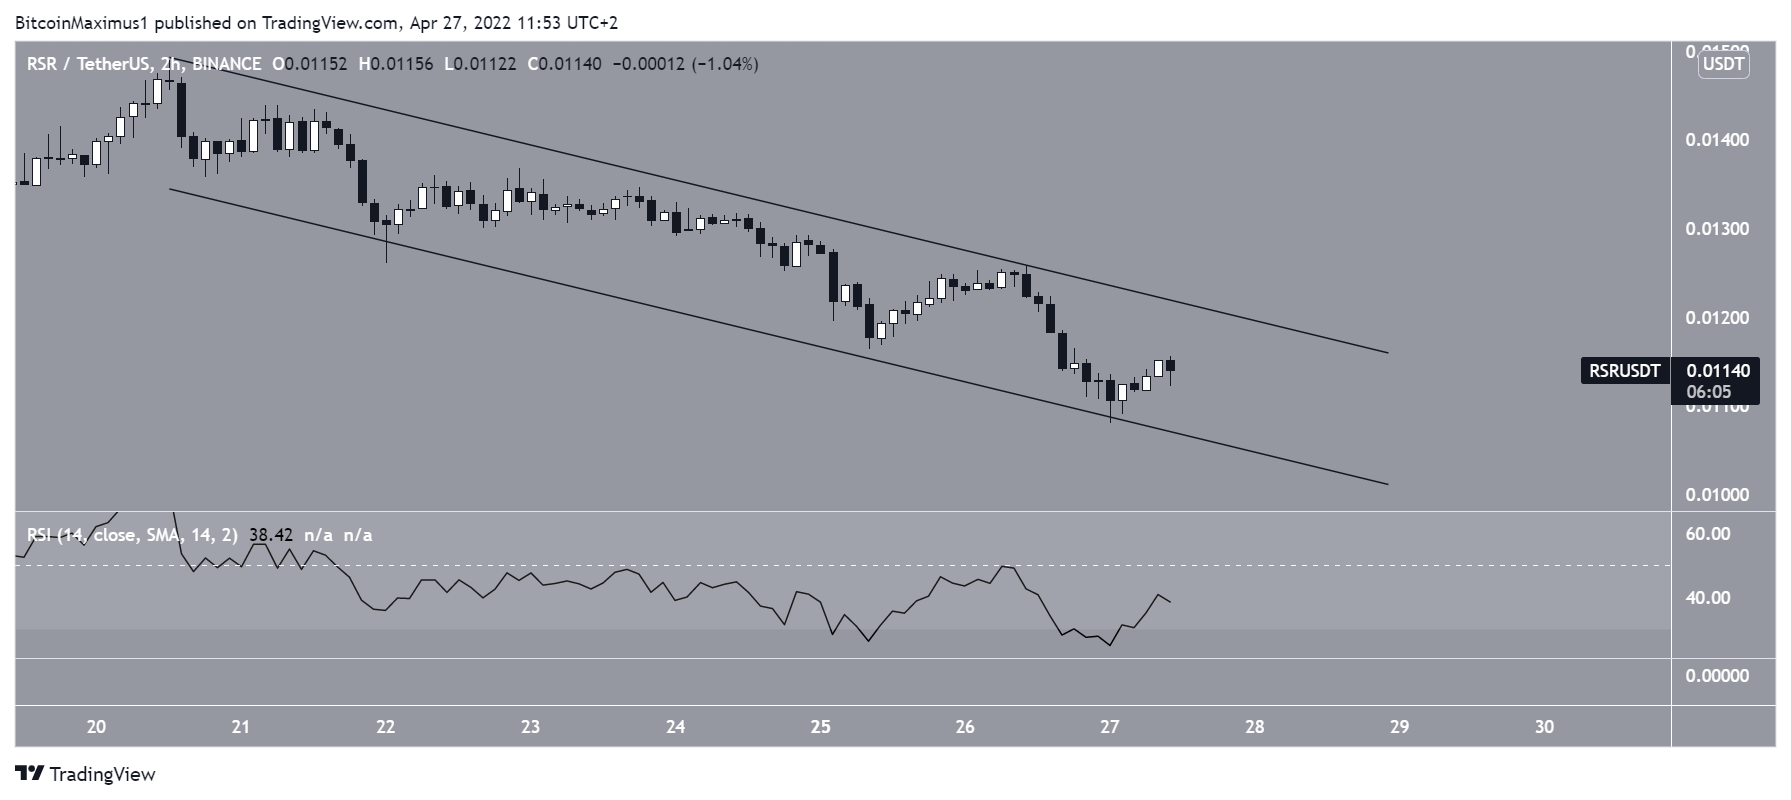
The two-hour chart shows that RSR has been trading inside a descending parallel channel since April 20. Such channels are considered corrective patterns, meaning that they lead to breakouts the majority of the time.
The price bounced at the support line of this channel on April 27 and has been moving upwards since. It is currently in the middle of the pattern.
Despite this, there are no bullish reversal signs. While the RSI has moved outside of its oversold territory, there is no bullish divergence in place that would suggest a breakout is forthcoming.
RSR/BTC
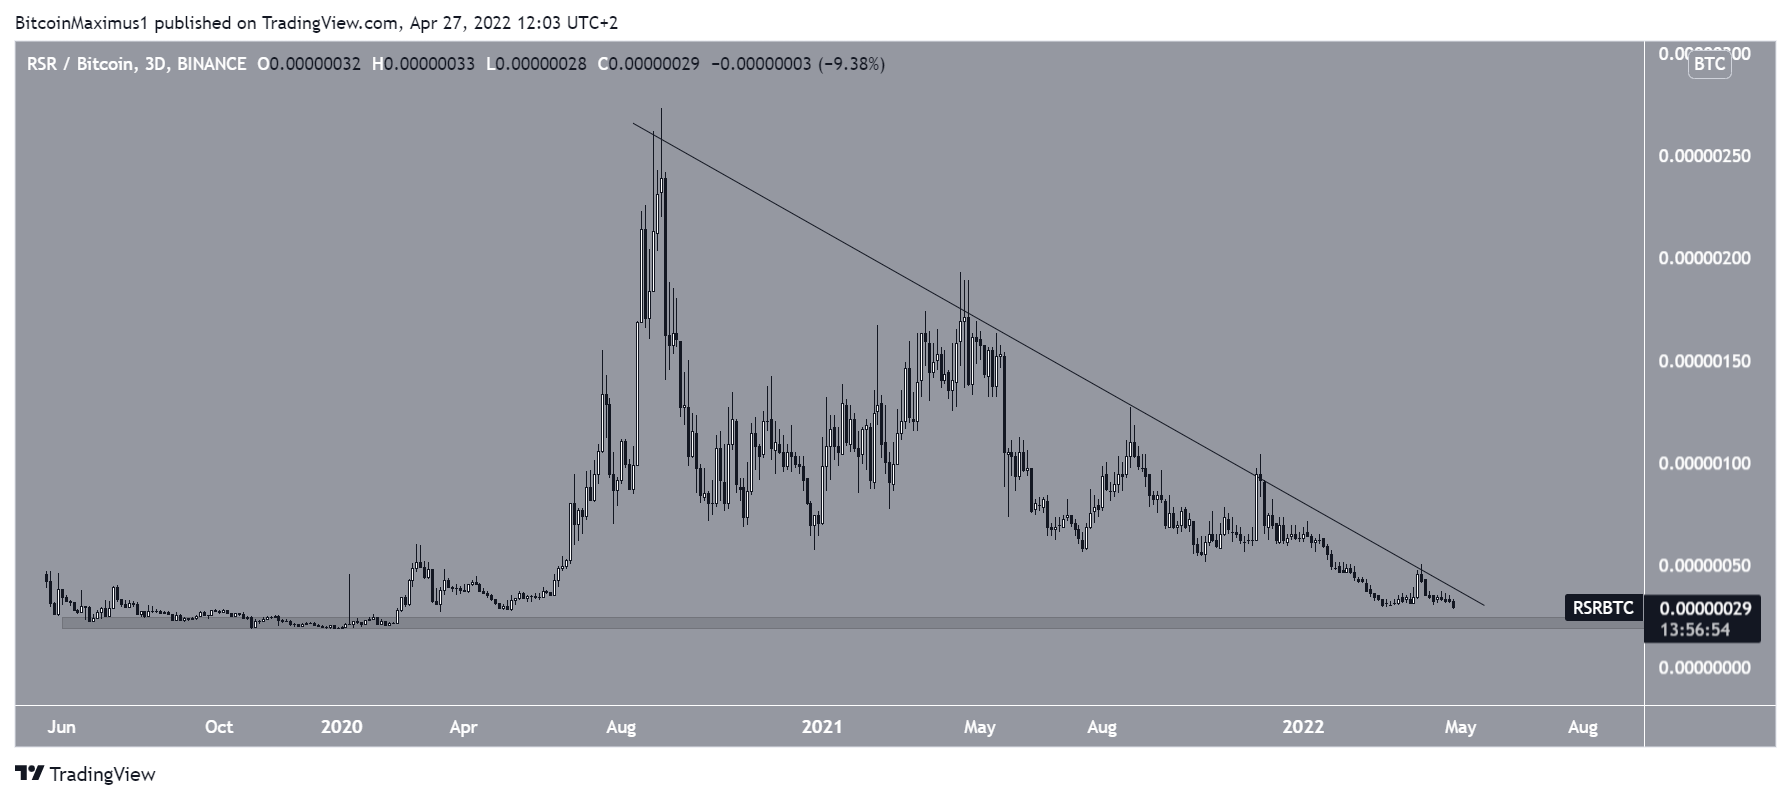
The RSR/BTC pair is more bearish than its USD counterpart. The price has been decreasing alongside a descending resistance line since its Aug 2020 all-time highs. The most recent rejection occurred on April 3.
Therefore, it is possible that the price will drop all the way to its 2020 lows at 22 satoshis.
For Be[in]Crypto’s latest Bitcoin (BTC) analysis, click here
Trusted
Disclaimer
In line with the Trust Project guidelines, this price analysis article is for informational purposes only and should not be considered financial or investment advice. BeInCrypto is committed to accurate, unbiased reporting, but market conditions are subject to change without notice. Always conduct your own research and consult with a professional before making any financial decisions. Please note that our Terms and Conditions, Privacy Policy, and Disclaimers have been updated.
