

Reserve Rights (RSR) has been increasing since Feb 24 in a move that was preceded by bullish divergences in both the RSI and MACD.
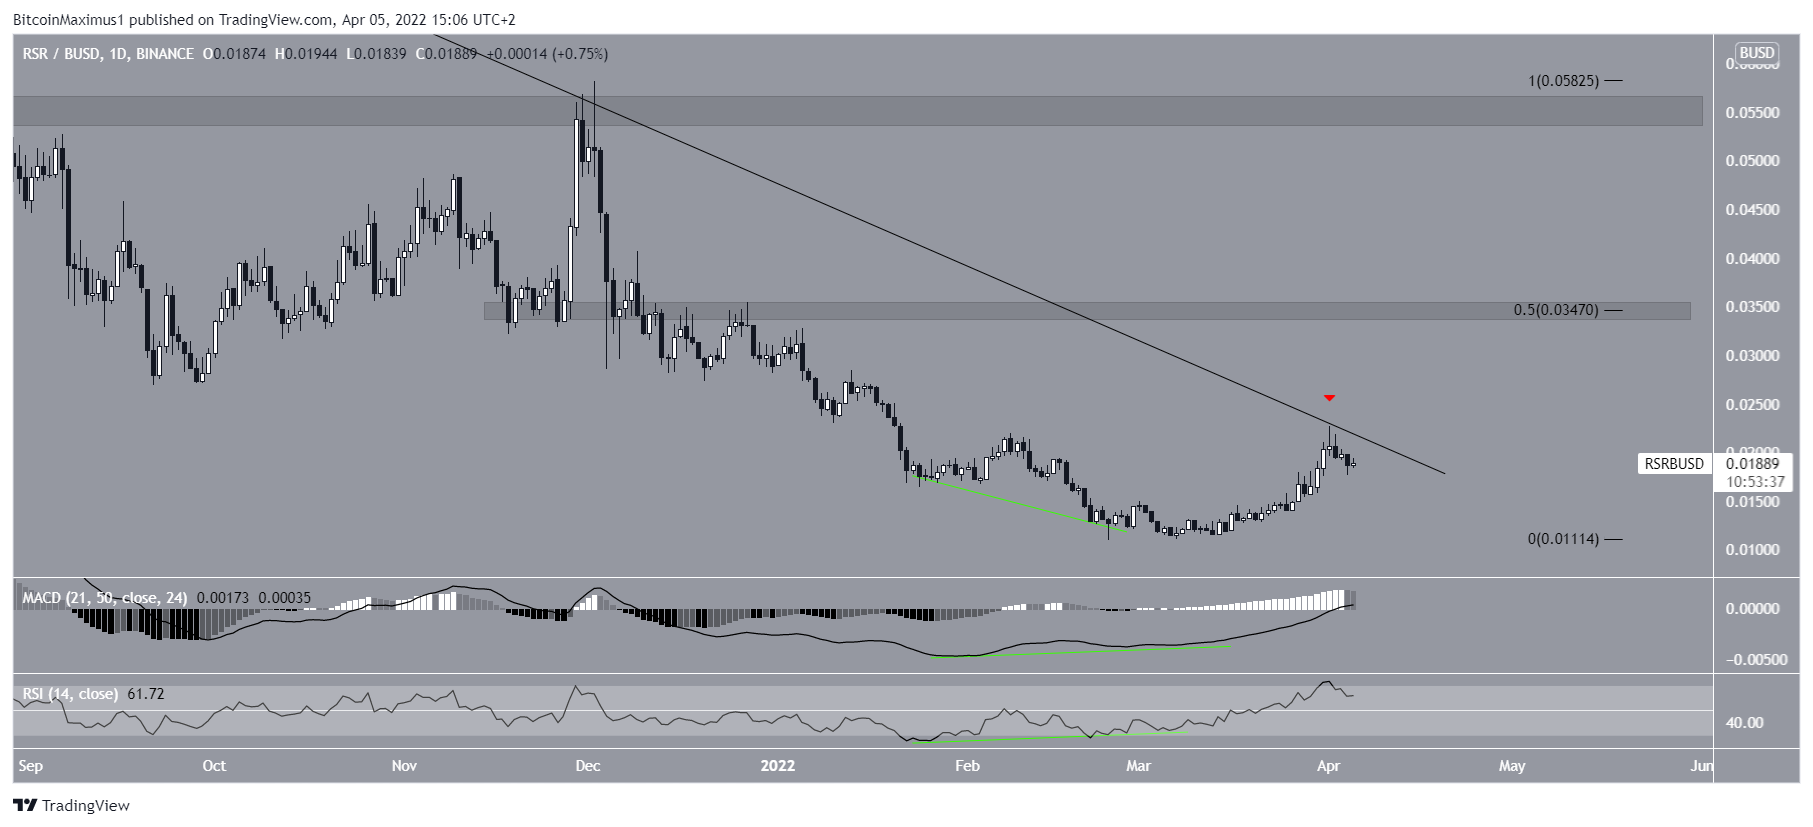
RSR has been falling underneath a descending resistance line since reaching an all-time high price of $0.119 on April 16 last year. The decrease led to a low of $0.011 on Feb 24. The price has been moving upwards since.
Despite the ongoing increase, RSR has yet to break out from the long-term descending resistance line. On the contrary, it was rejected by it for the third time (red icon) on April 1.
If a breakout were to occur, the main resistance would be at $0.054. This is a horizontal resistance area that rejected the price twice in Aug and Dec 2021.

Will RSR break out?
A closer look at the daily time frame supports the continuation of the upward movement. The main reasons for this are the bullish divergences that have developed in both the RSI and MACD (green lines). Such divergences very often precede bullish trend reversals.
Furthermore, the MACD has crossed into positive territory while the RSI has moved above 50. Both of these are considered signs of bullish trends.
Prior to the aforementioned $0.054 resistance area, there is a minor resistance at $0.034. This is the 0.5 Fib retracement resistance level of the most recent portion of the upward movement. Also, it is a horizontal resistance area.
Wave count analysis
Measuring from the all-time high, it seems that RSR has completed a W-X-Y corrective structure (white), which ended on March 9.
The sub-wave count is given in black.
There are two proportions between the waves. Waves W:Y have a 1:0.5 ratio, while sub-waves A:C have a 1:1.27 ratio.

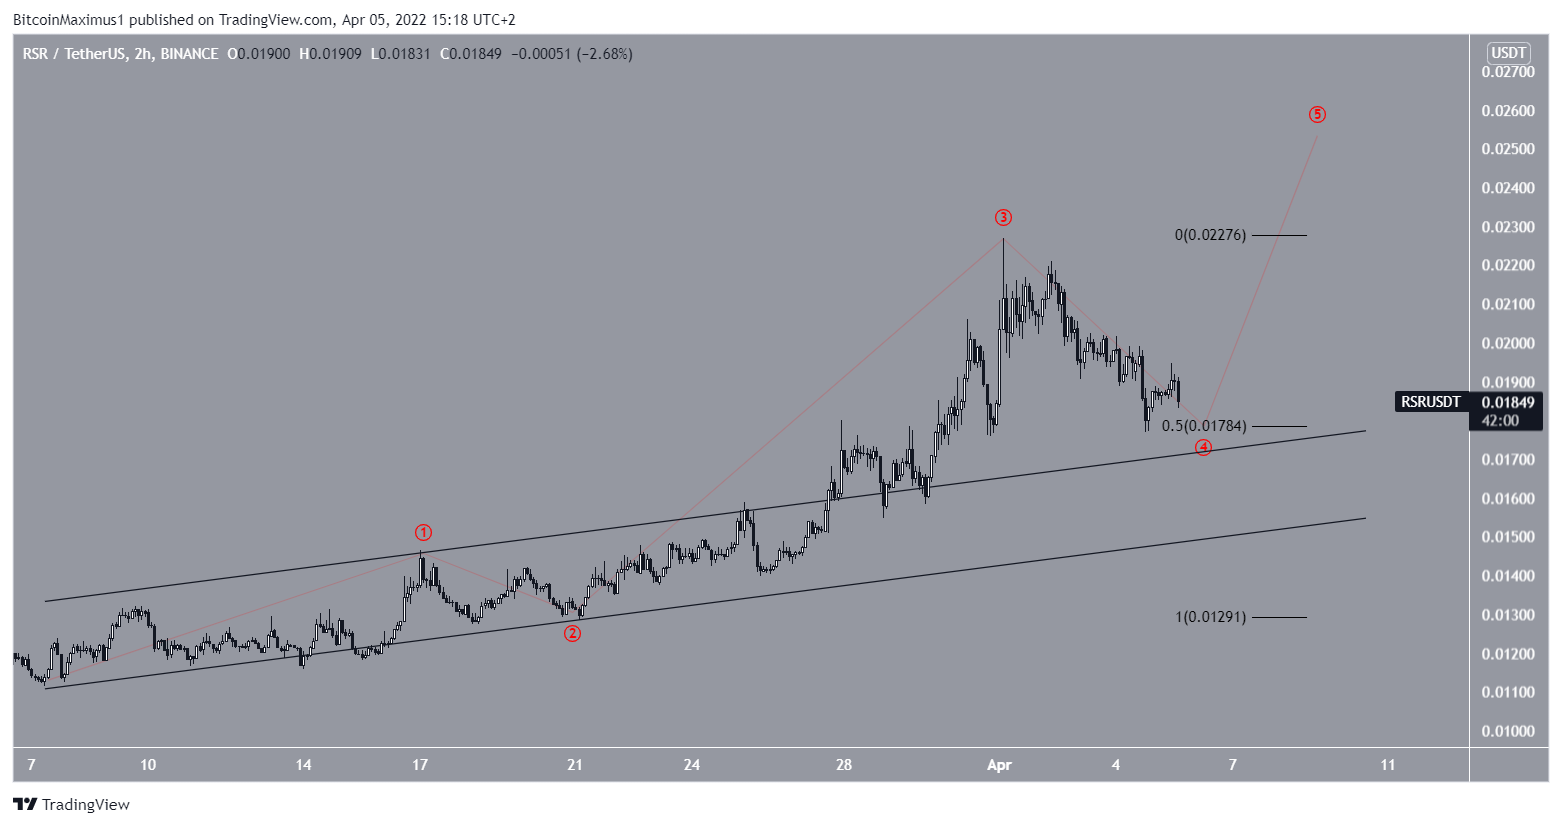
Cryptocurrency trader @TheTradingHubb tweeted a chart of RSR, stating that the price is in wave four of a five-wave upward movement.

The short-term count shows that RSR has completed wave four by doing a fourth wave pullback, or is very close to doing so.
It has bounced at a confluence of support levels at $0.178, created by the 0.5 Fib retracement of wave three and the resistance line of the previous channel.
This is a likely spot for wave four to end and wave five to begin.
For Be[in]Crypto’s latest Bitcoin (BTC) analysis, click here
Trusted
Disclaimer
In line with the Trust Project guidelines, this price analysis article is for informational purposes only and should not be considered financial or investment advice. BeInCrypto is committed to accurate, unbiased reporting, but market conditions are subject to change without notice. Always conduct your own research and consult with a professional before making any financial decisions. Please note that our Terms and Conditions, Privacy Policy, and Disclaimers have been updated.
