
Of the top 100 cryptocurrencies by market capitalization on CoinMarketCap, Quant (QNT) has managed to chart notable and consistent gains over the past weeks and months.
High gains and rallies are normally unheard of in a bear market, however, QNT defied the trend reaching a six-month high of $145.80 on Sept. 28. QNT HODLers have had a great chance to enjoy some sweet profits these past few weeks.
At press time though, QNT had fallen back to trading at the $130 mark — down 4% on the daily chart. Will profit taking exacerbate these losses?
Network remains vibrant
Quant’s 3-month ROI vs USD was +148.05% compared to Bitcoin’s +0.28% and Ethereum’s +24.47% returns. The high was supported by a rather vibrant network and high social volumes for the project.
Apart from the social hype, trade volume and daily active addresses have all supported QNT’s rise, as shown in data from Santiment.
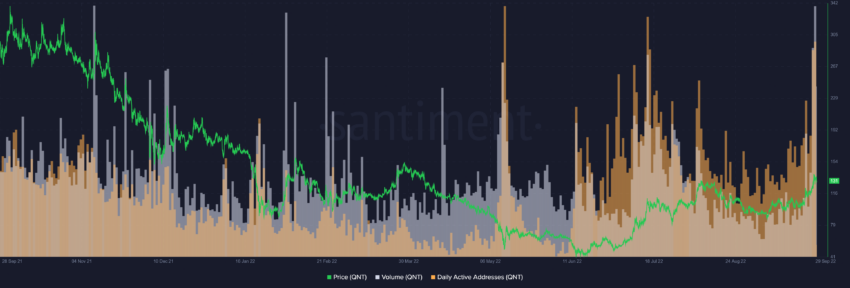
A steady uptick in volume alongside a healthy rise in daily active addresses pointed toward more users flocking to the network. Volume and daily active addresses both peaked on Sept. 28.
Additionally, whale addresses holding 100-1,000 QNT saw a sustained growth since June followed by a major uptick on Sept. 19. Whales entering the market is usually a sign of confidence from institutional investors and retail players with deep pockets.
What does QNT need in order to rally?
Quant rallied from a local low of $122 on Sept. 27, to a monthly high of $145 early the following day.
The sudden gains followed after prices jumped above the critical resistance levels of $128 and $133.
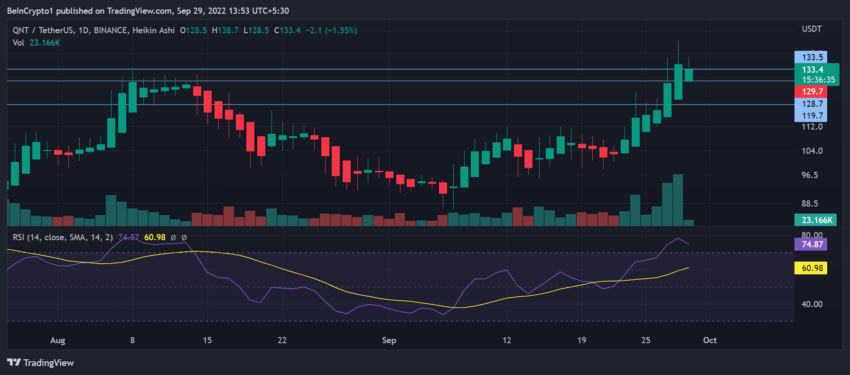
Now, with the QNT price back to the lower $130 price level, an RSI reversal on the daily chart suggests easing buying pressure. With the price rally fading, a significant uptick in the Age Consumed indicator shows that old coins were moving.
The Age Consumed metric is often used to spot local tops, but it can also be used to see signs of dormant coins moving, potentially onto exchanges to be sold or traded.
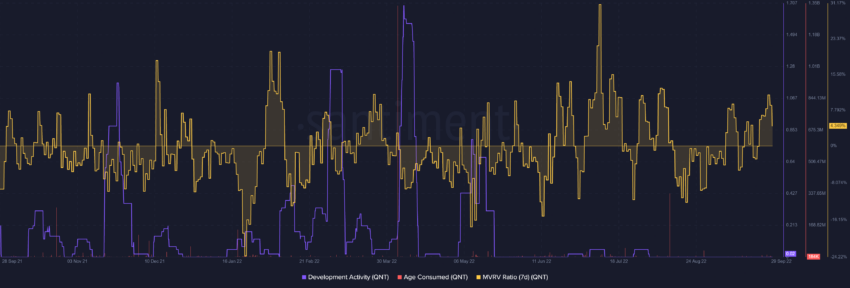
A look at QNT’s 7-day MVRV suggests that market players have already started taking profits at higher price levels as MVRV took a U-turn.
Additionally, a significantly low development activity poses further risk to QNT’s healthy price action. A push from developers and bulls in the near term could be key for the QNT price. If however bulls are unable to keep prices above the $133 resistance, a pullback to the lower $128 level could be expected.
Trusted
Disclaimer
In line with the Trust Project guidelines, this price analysis article is for informational purposes only and should not be considered financial or investment advice. BeInCrypto is committed to accurate, unbiased reporting, but market conditions are subject to change without notice. Always conduct your own research and consult with a professional before making any financial decisions. Please note that our Terms and Conditions, Privacy Policy, and Disclaimers have been updated.