
BeInCrypto takes a look at the eight altcoins that decreased the most over the past seven days, from May 7 to May 14.
These altcoins are:
- Qtum (QTUM) – 33.0%
- BitTorrent (BTT) – 28.8%
- Ethereum Classic (ETC) – 28.7%
- Holo (HOT) – 25.6%
- Neo (NEO) – 24.4%
- OMG Network (OMG) – 23.8%
- 0x (ZRX) – 23.5%
- Vechain (VET) – 23.1%
QTUM
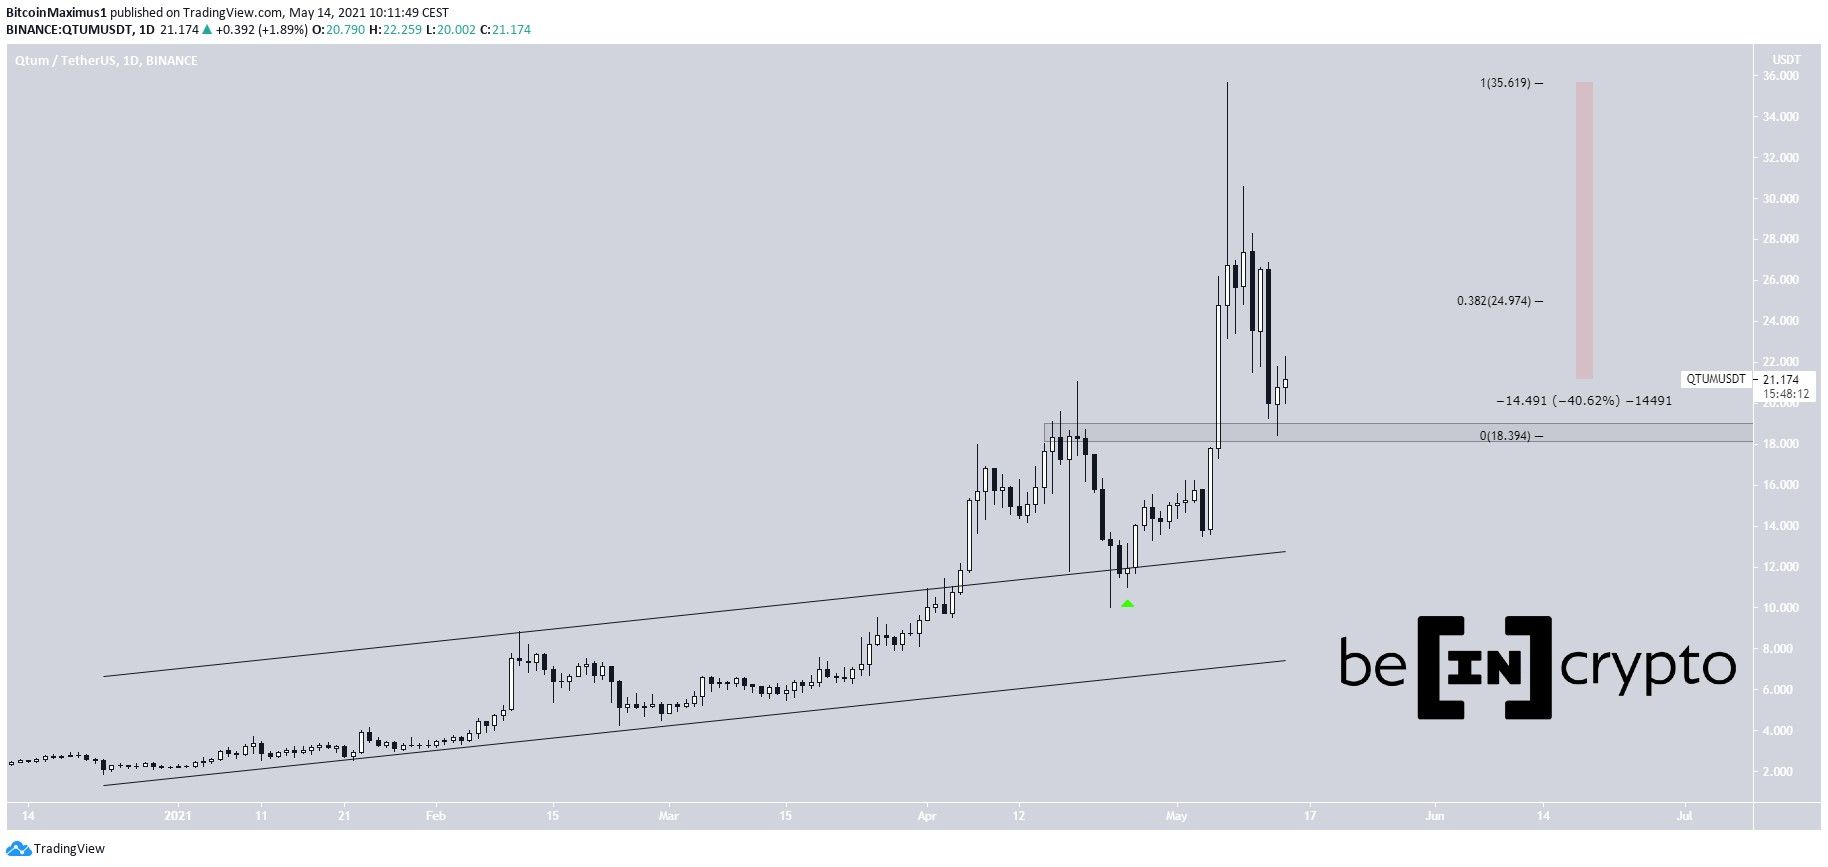
QTUM had been increasing since completing a fourth wave pullback on April 23. This led to an all-time high price of $35.68 reached on May 7.
However, it has been moving downwards since. So far, it has decreased by 40%, reaching the $18.50 support area. The bounce so far has been weak.
If it continues to increase, the closest resistance area would be found at $25. This is the 0.382 Fib retracement level of the aforementioned drop and a horizontal resistance area.
BTT
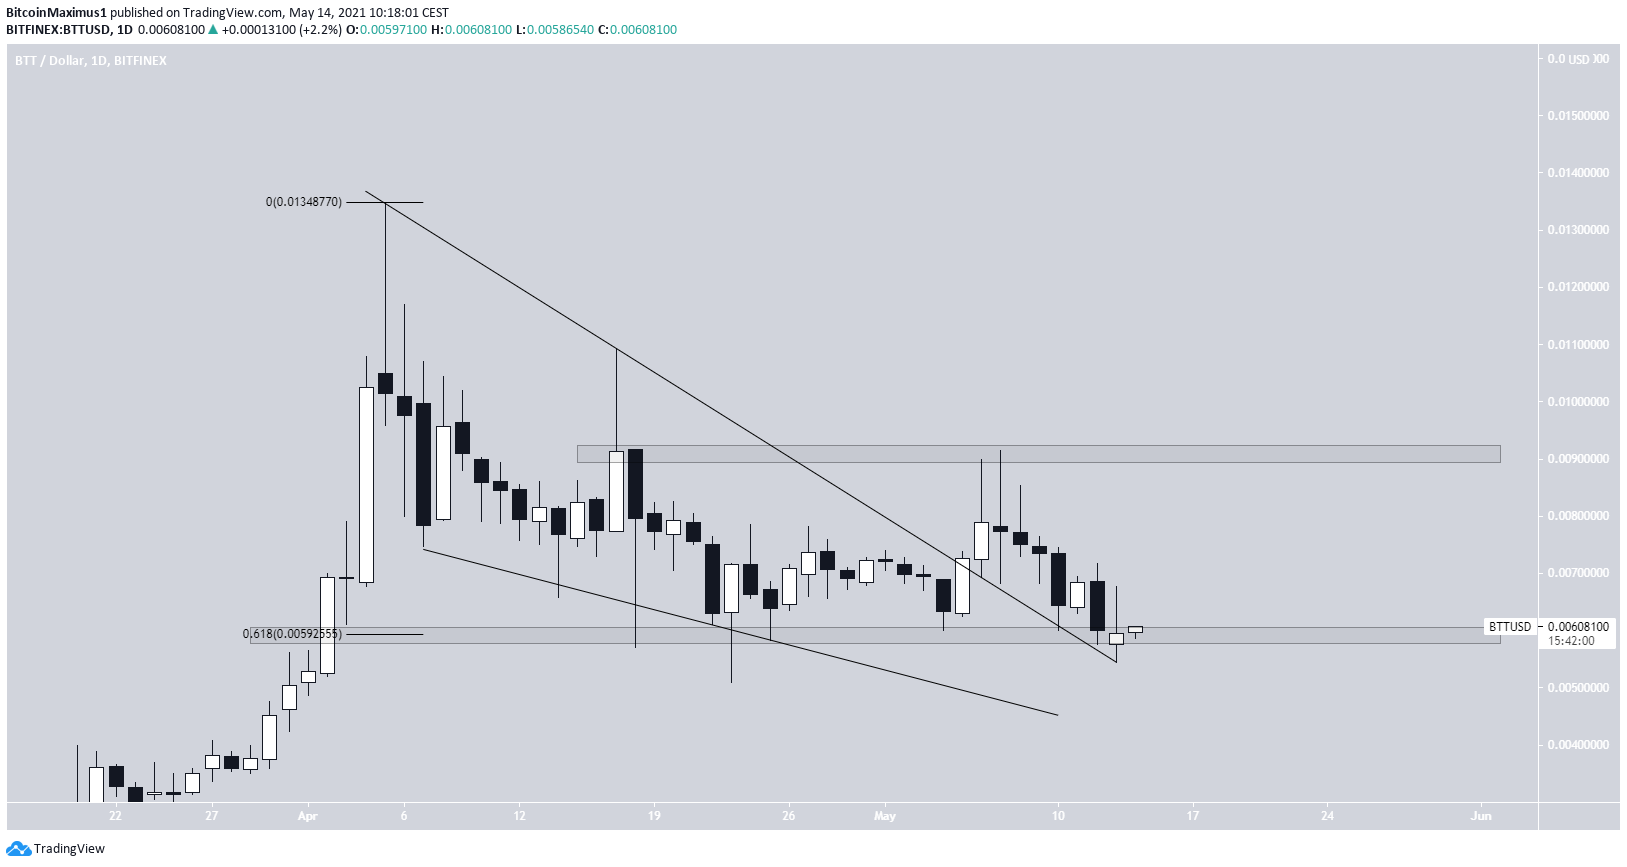
BTT had been decreasing inside a descending wedge since reaching an all-time high of $0.134 on April 5.
On April 23, it bounced at the $0.0059 support area and broke out from the wedge on May 5. However, BTT was rejected from the $0.009 resistance area the next day and has been decreasing since.
Currently, it has returned to validate the resistance line and the $0.006 support area once more.
ETC
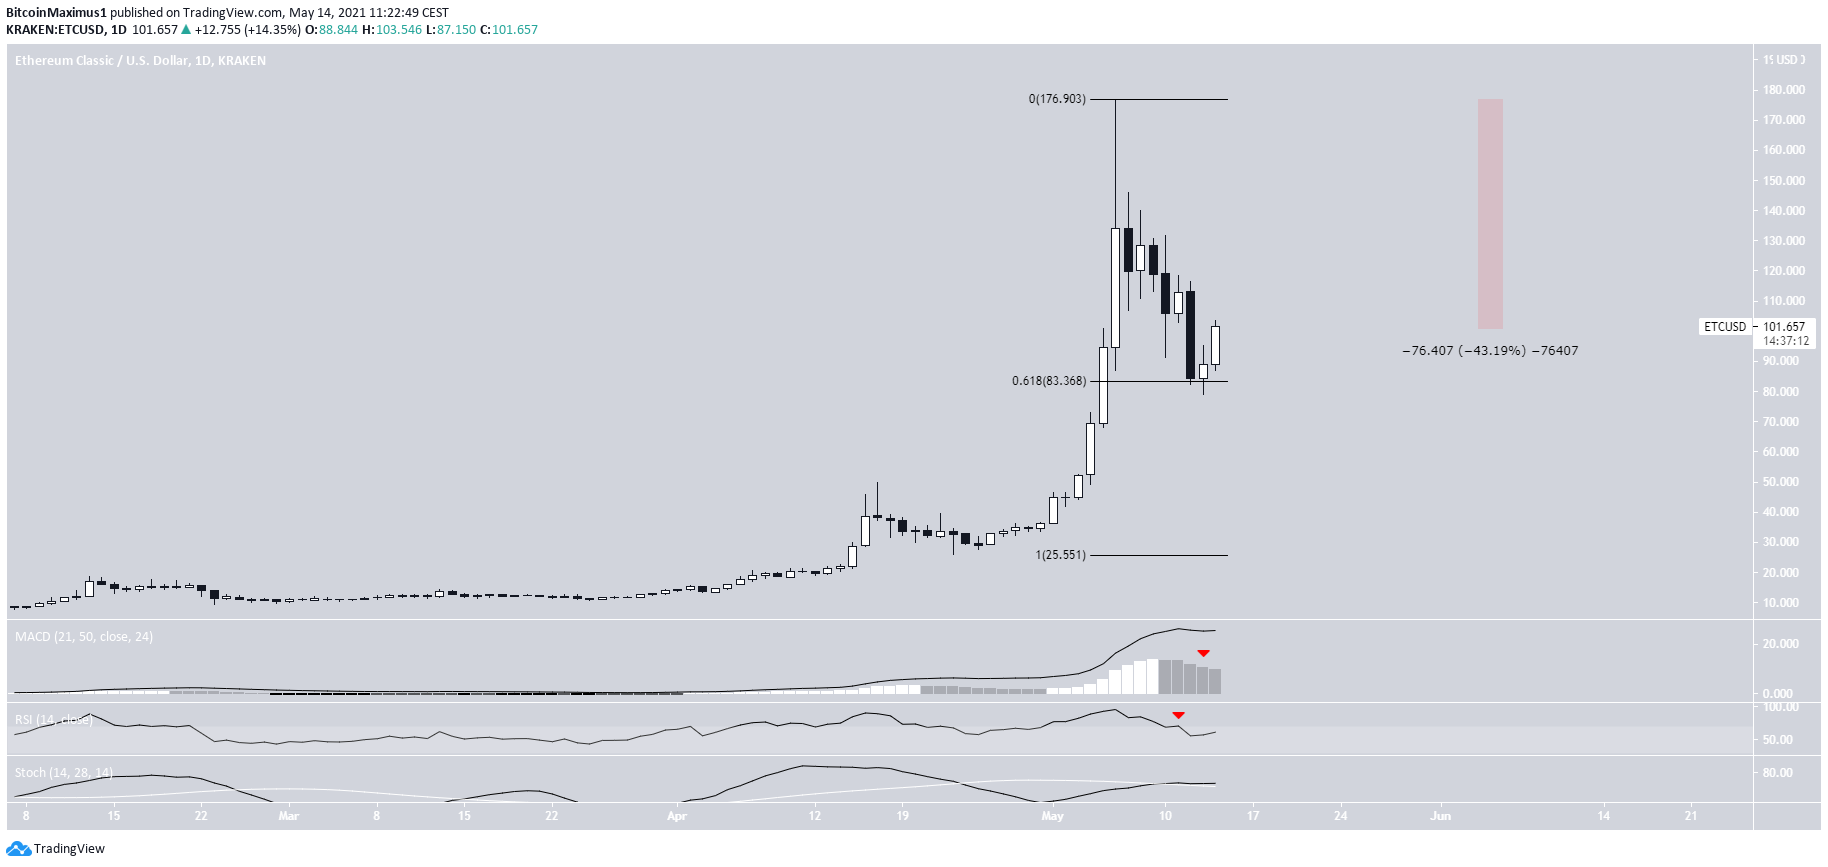
ETC has been moving downwards since May 6, when it reached an all-time high price of $176.72. So far, it has decreased by 43%.
The downward movement continued until May 13, when ETC bounced at the 0.618 Fib retracement support level, found at $83.4.
However, the bounce has been weak and technical indicators in the daily time-frame are bearish.
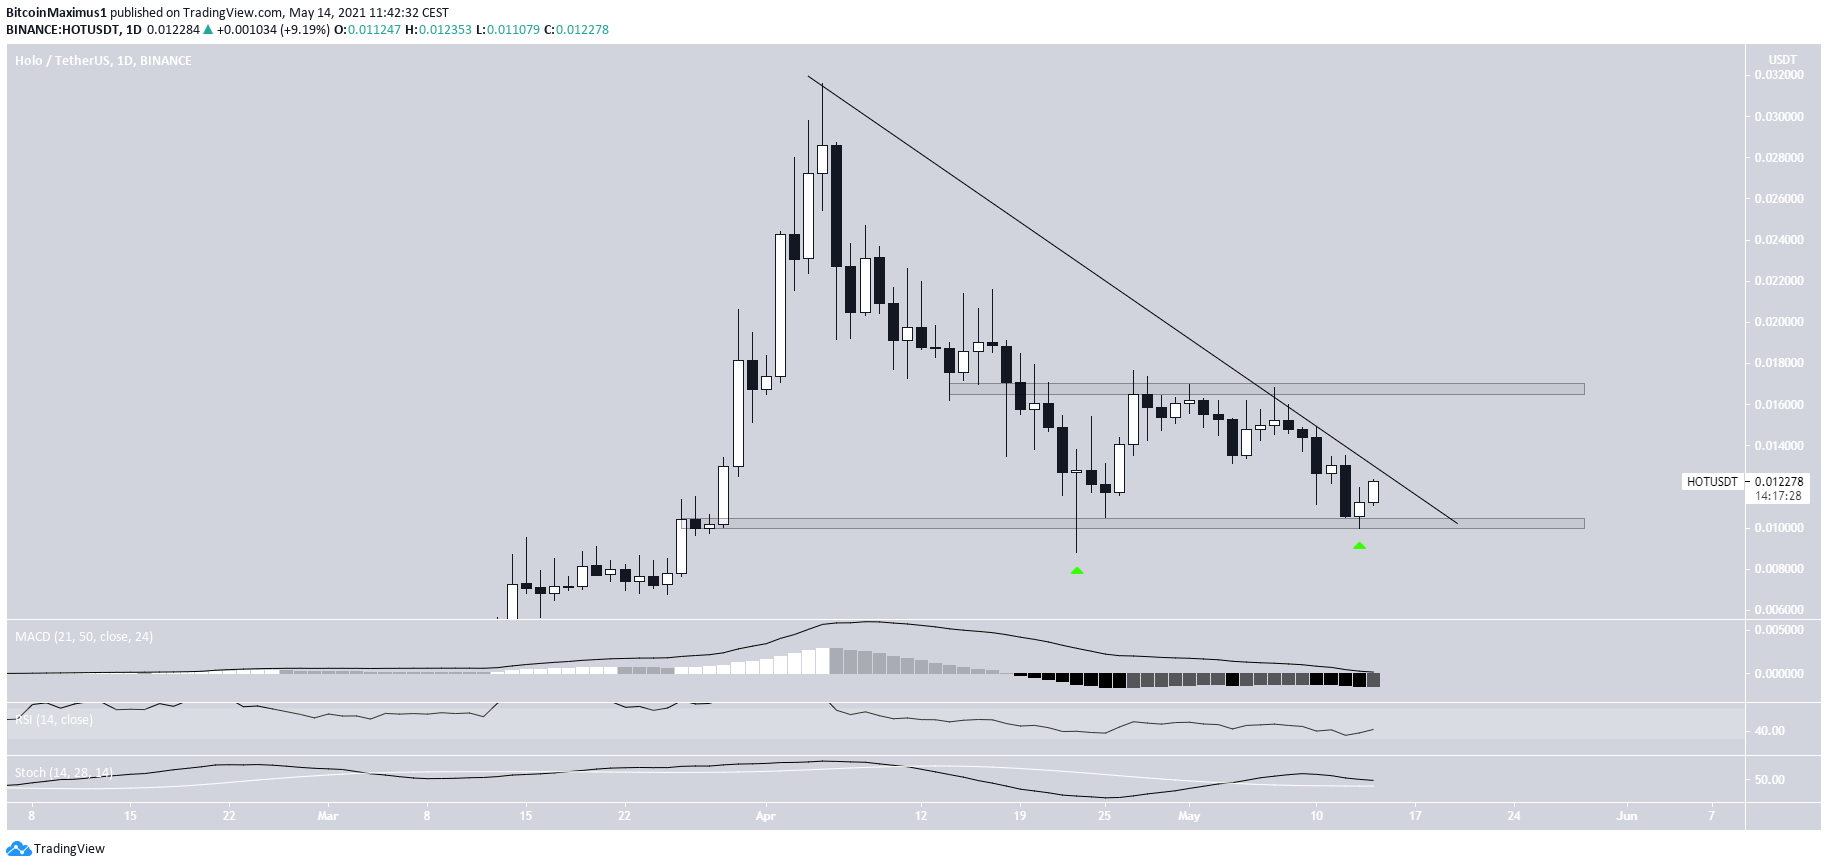
HOT
HOT has been moving downwards since reaching an all-time high price on April 5. Throughout the decrease, it has been following a descending resistance line.
On April 23, it reached a low of $0.0088 and bounced. It is currently attempting to create a higher low above the $0.01 support area. Technical indicators are also gradually turning bullish.
A breakout from the line would likely take HOT to the $0.017 resistance area.
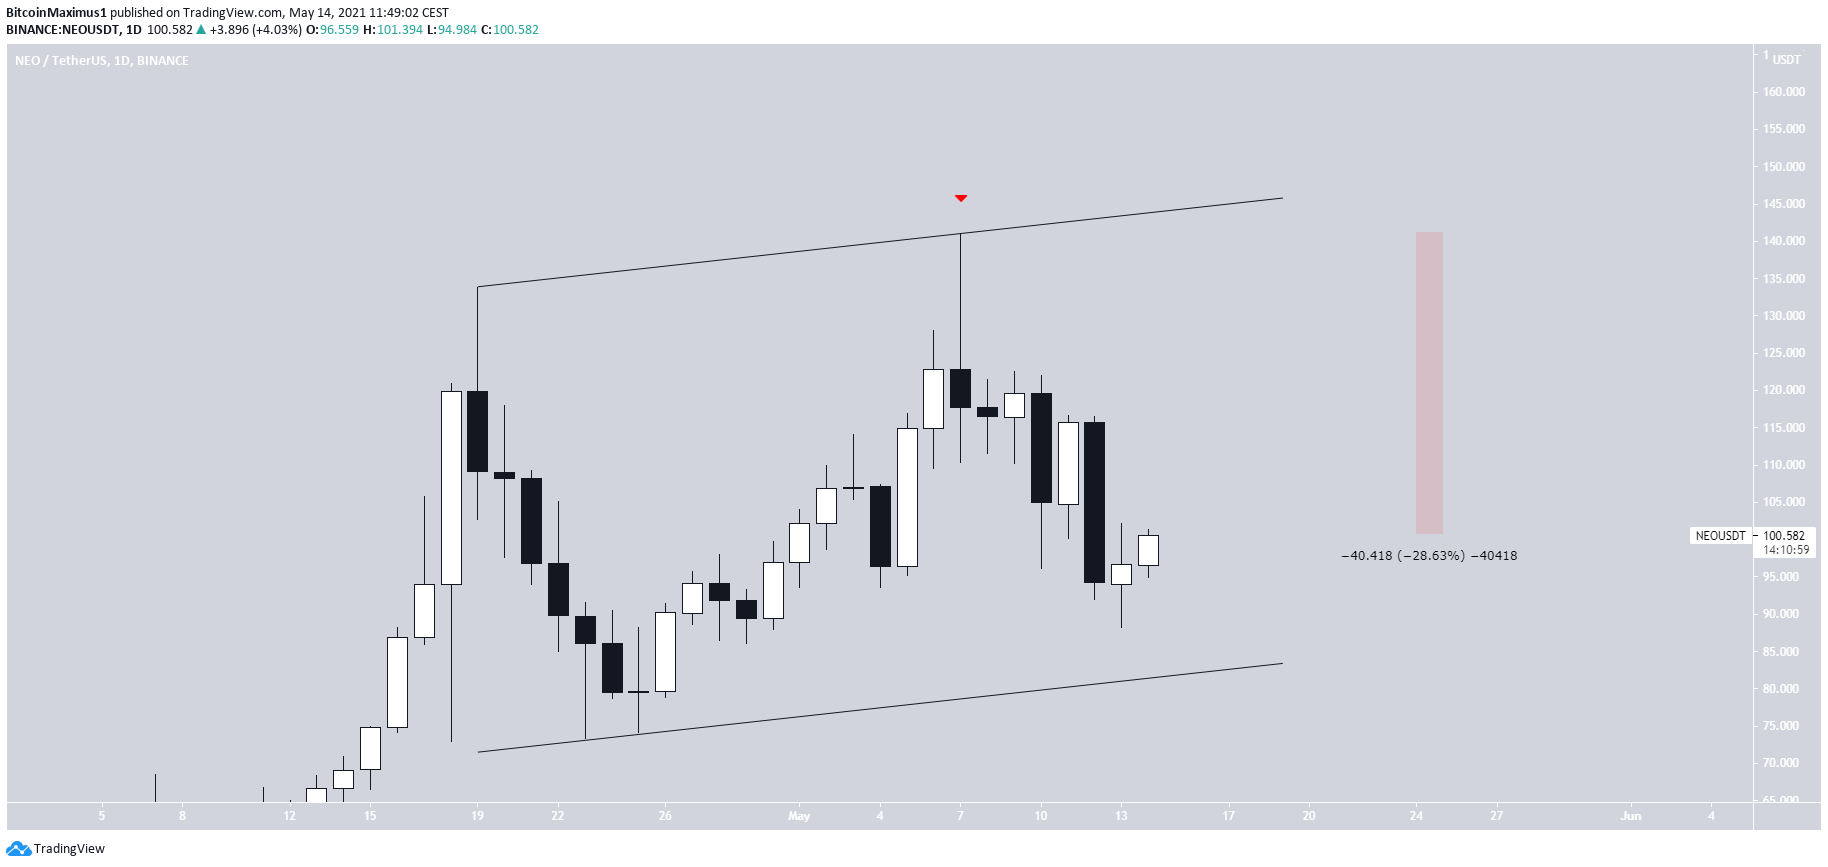
NEO
NEO has been moving downwards since May 7, when it reached a high of $414. So far, it has decreased by 28.6%.
Despite the drop, it is still trading inside a parallel ascending channel, which is often a corrective movement. It is currently very close to the support line of the channel.
Therefore, an eventual breakout is probable.
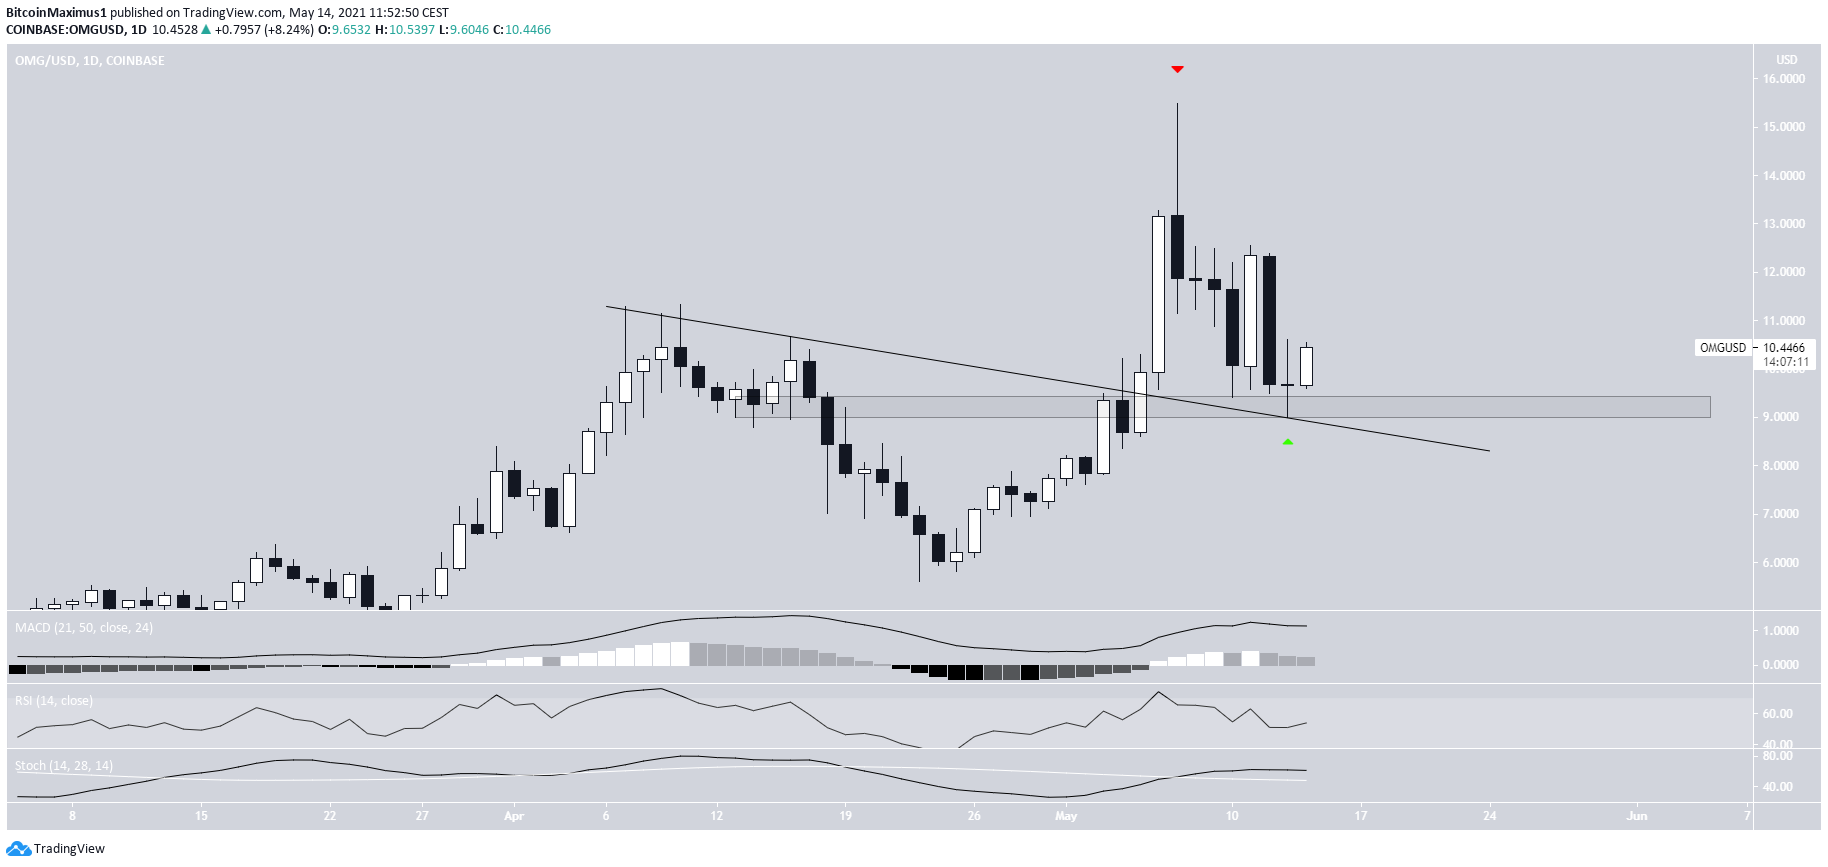
OMG
OMG has been moving downwards since May 7, when it reached a high of $15.50.
The downward movement continued, until a low of $9 was reached on May 13. This validated the $9 horizontal support level and also re-tested a descending resistance line from which OMG had broken out.
Technical indicators are also bullish. Therefore, it is likely that this was a retest and the trend is still bullish.
ZRX
ZRX has been trading inside an ascending parallel channel since reaching a high of $2.18 on Feb. 5. The movement inside it has been extremely choppy, indicative of a corrective structure.
Therefore, it is possible that this is a running flat correction.
If so, an eventual breakout and new all-time high price would be expected.
However, technical indicators in the daily time-frame are neutral.

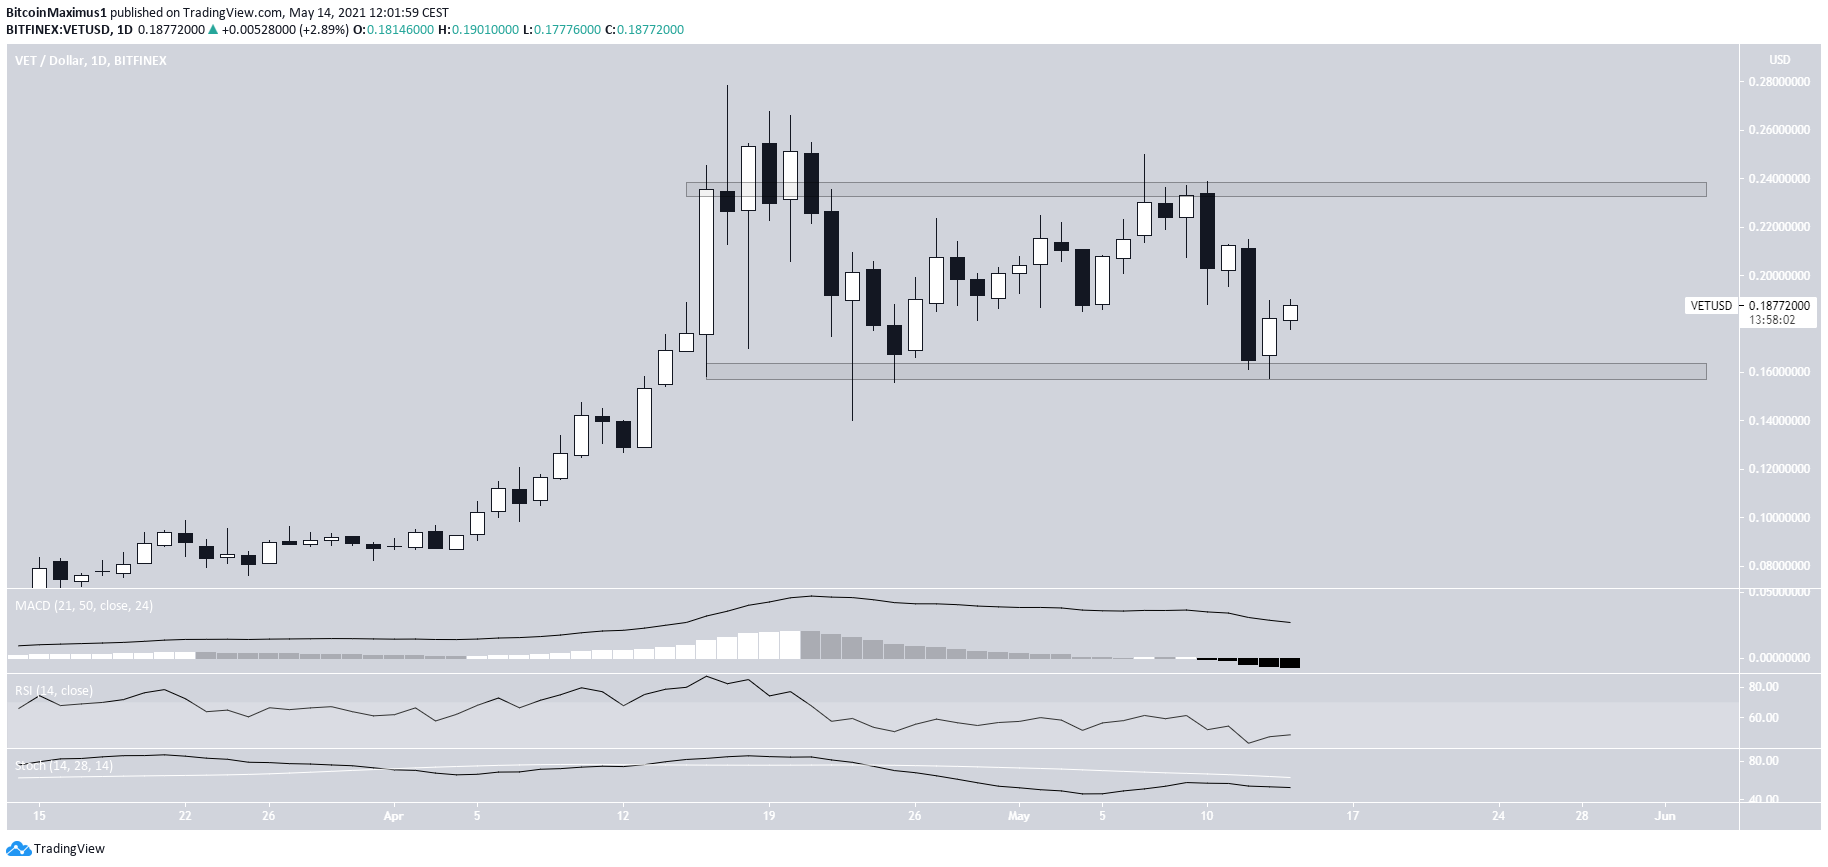
VET
VET has been moving downwards since April 17, when it reached a high of $0.278. The decrease continued until April 23, when VET bounced at the $0.16 support area.
After a failed attempt at initiating an upward movement, it was rejected by the $0.235 area and has been moving downwards since.
It reached the $0.16 area once more on May 12.
Technical indicators are neutral.
Therefore, it is likely that the token will continue to consolidate inside this range.
For BeInCrypto’s latest bitcoin (BTC) analysis, click here.
Trusted
Disclaimer
In line with the Trust Project guidelines, this price analysis article is for informational purposes only and should not be considered financial or investment advice. BeInCrypto is committed to accurate, unbiased reporting, but market conditions are subject to change without notice. Always conduct your own research and consult with a professional before making any financial decisions. Please note that our Terms and Conditions, Privacy Policy, and Disclaimers have been updated.
