

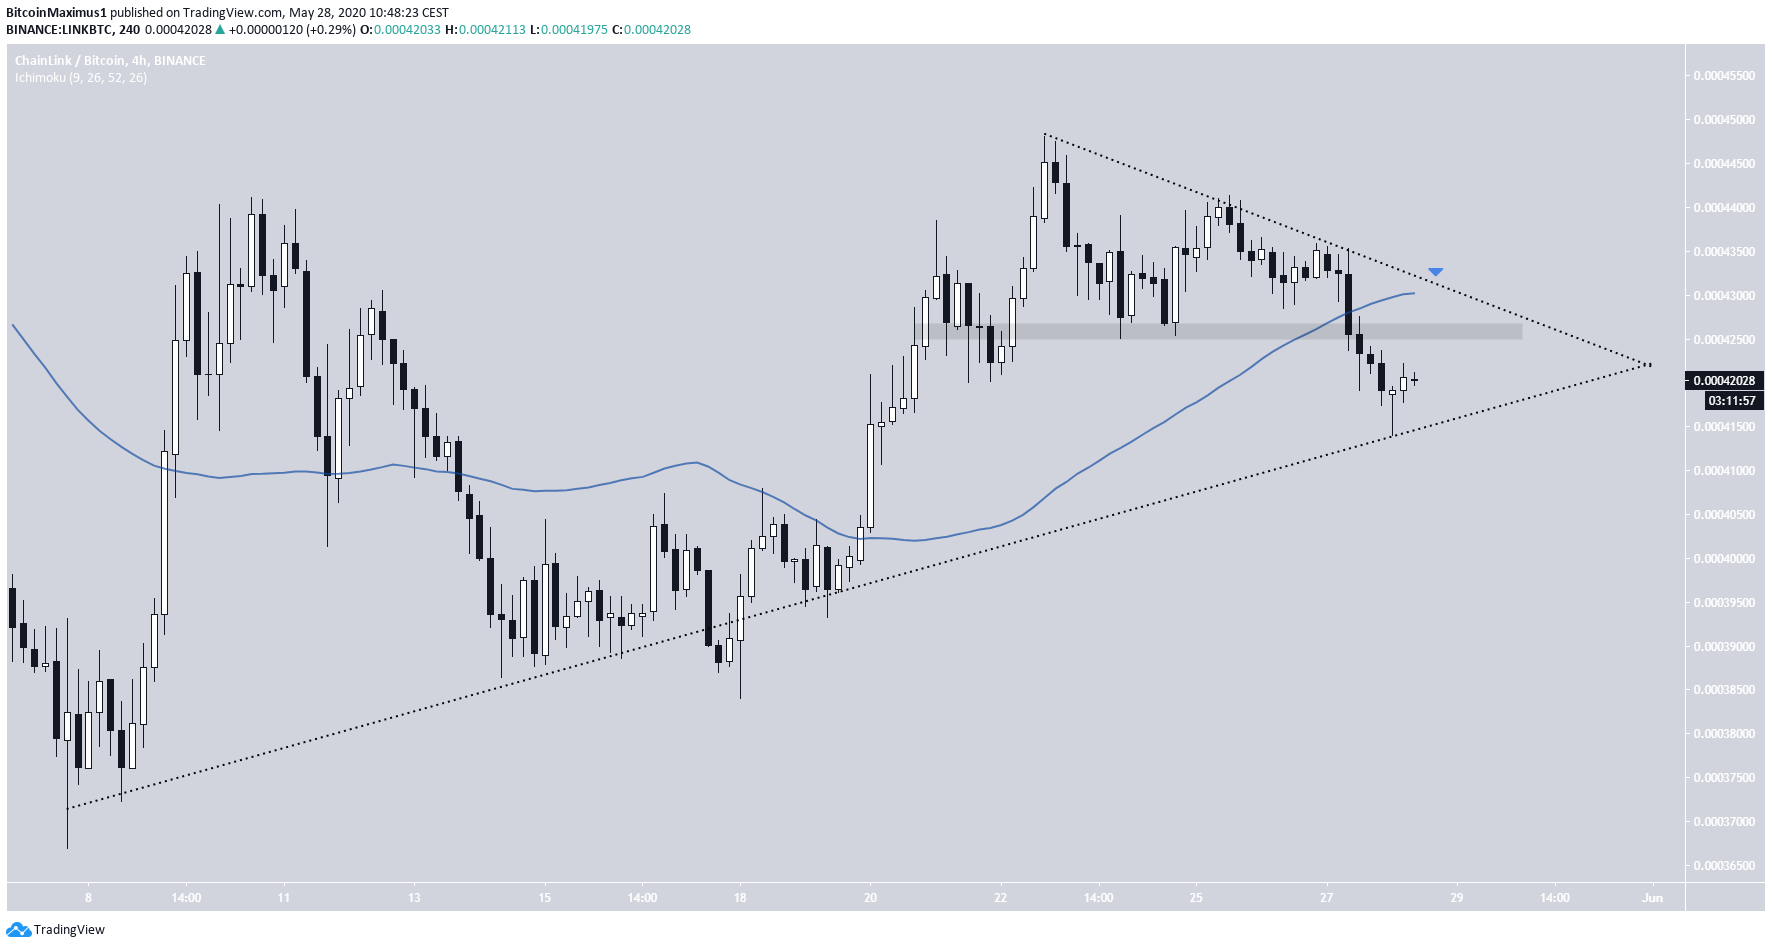
ChainLink has been decreasing since May 22 but has bounced at a minor support level. However, there is considerable resistance overhead. Tezos is also trading inside an important support level but has broken down from a short-term ascending support line.
Well-known trader @PostyXBT outlined a LINK chart that shows a breakdown from a symmetrical triangle:
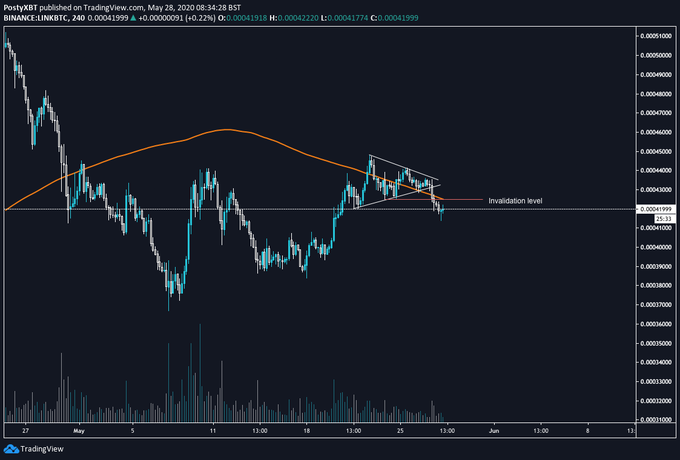
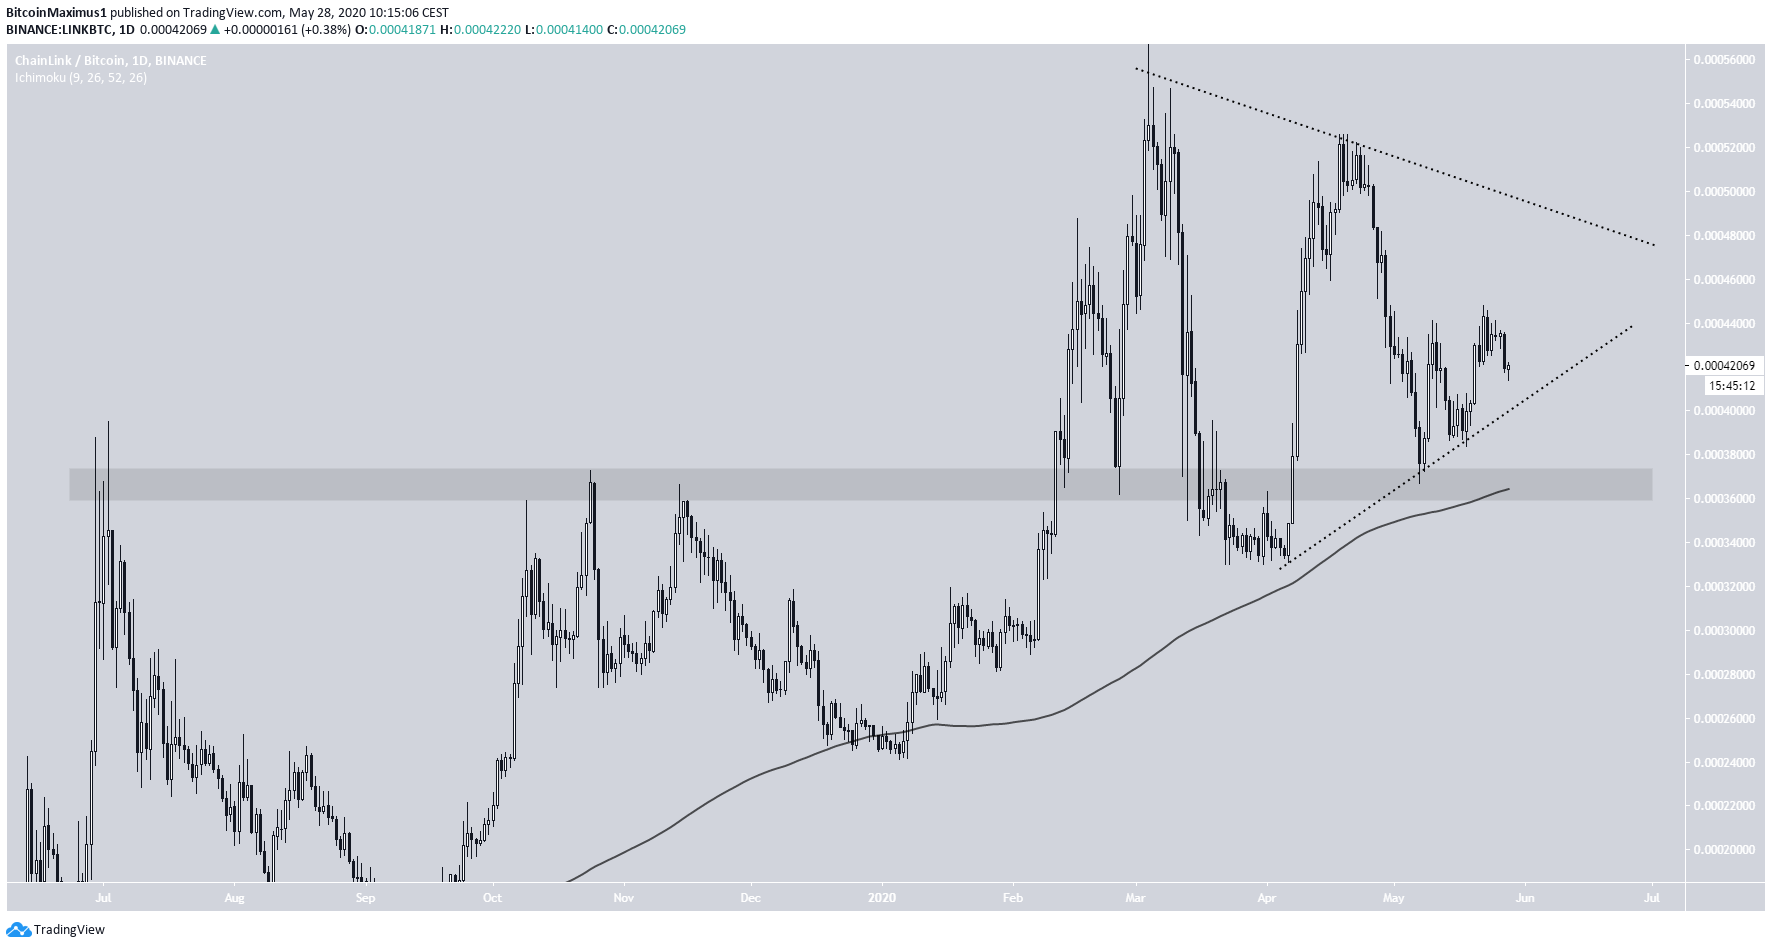
Stopped out just below the clean invalidation level BTC volatility is always a threat when trading alts Until next time, marinesThe LINK price has been decreasing since it reached an all-time high price of 56,739 satoshis on March 14. However, as long as it is trading above the 36,500 satoshi area that previously acted as resistance and has since turned to support, its price movement can be considered bullish. This support area is also strengthened by the presence of the 200-day moving average (MA).
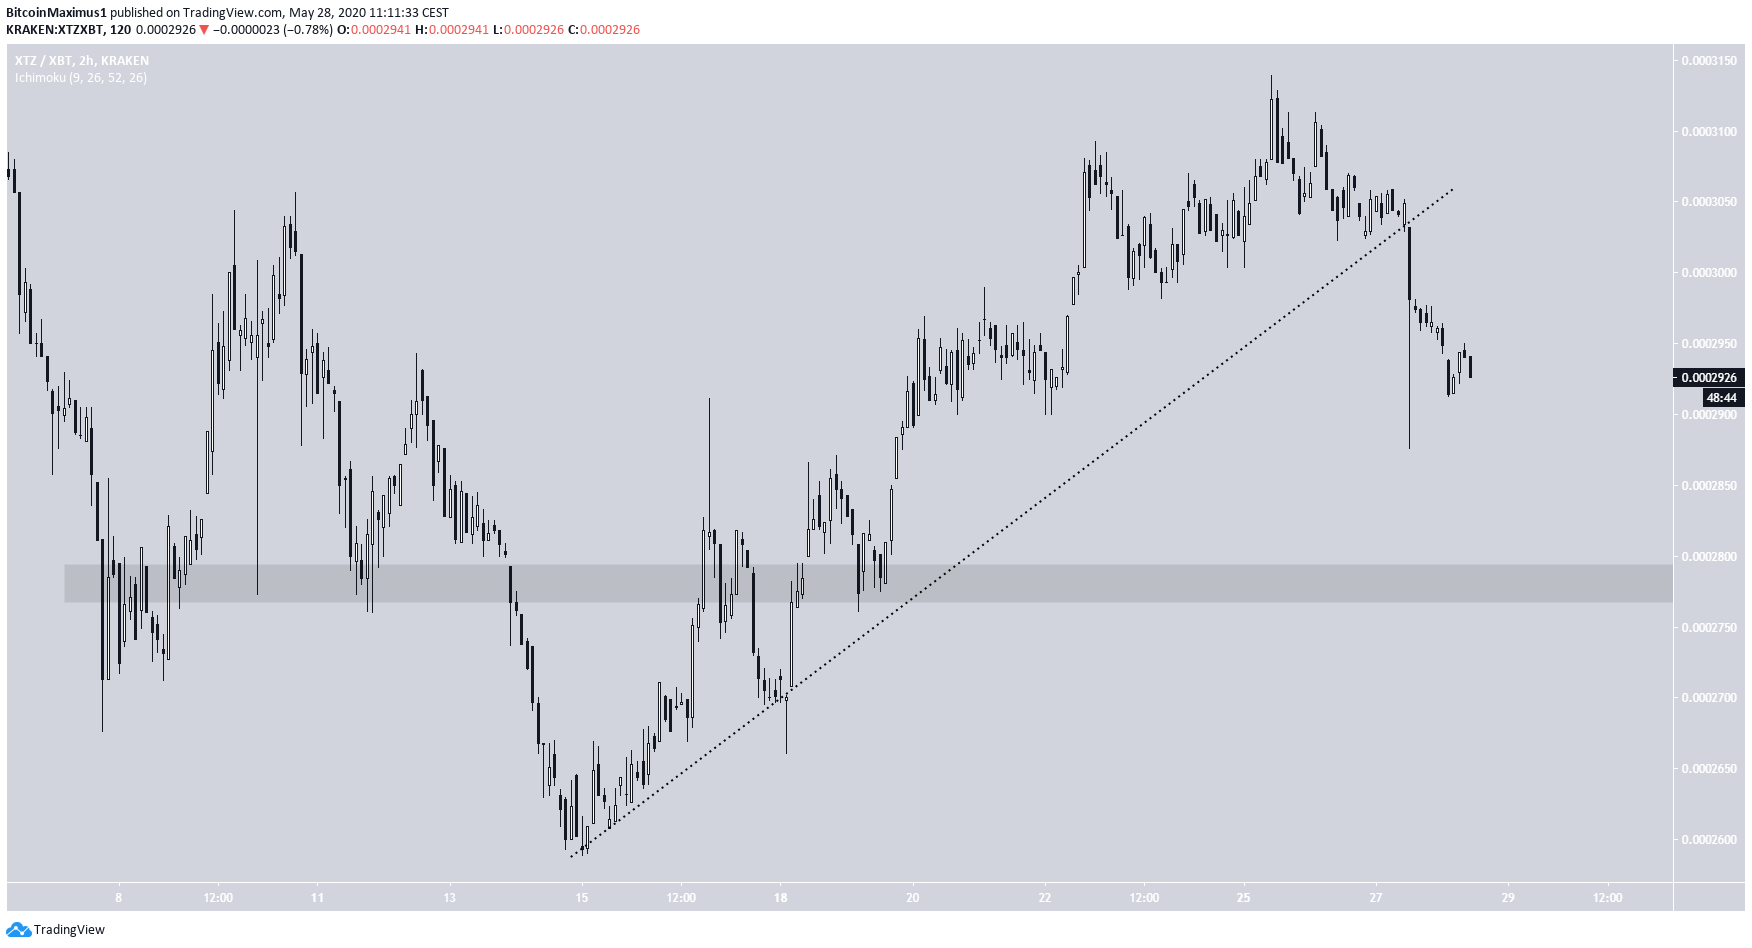
Tezos (XTZ)
Another altcoin that has often been compared to LINK is Tezos (XTZ). The most important level is found at 29,500 satoshis, where the price is currently trading. If the price breaks down, the next significant support level is found at 25,000 satoshis, supported by the 200-day MA. On the other hand, the closest resistance level is found at 33,000 satoshis, between the 0.5-0.618 Fibonacci levels of the previous decrease.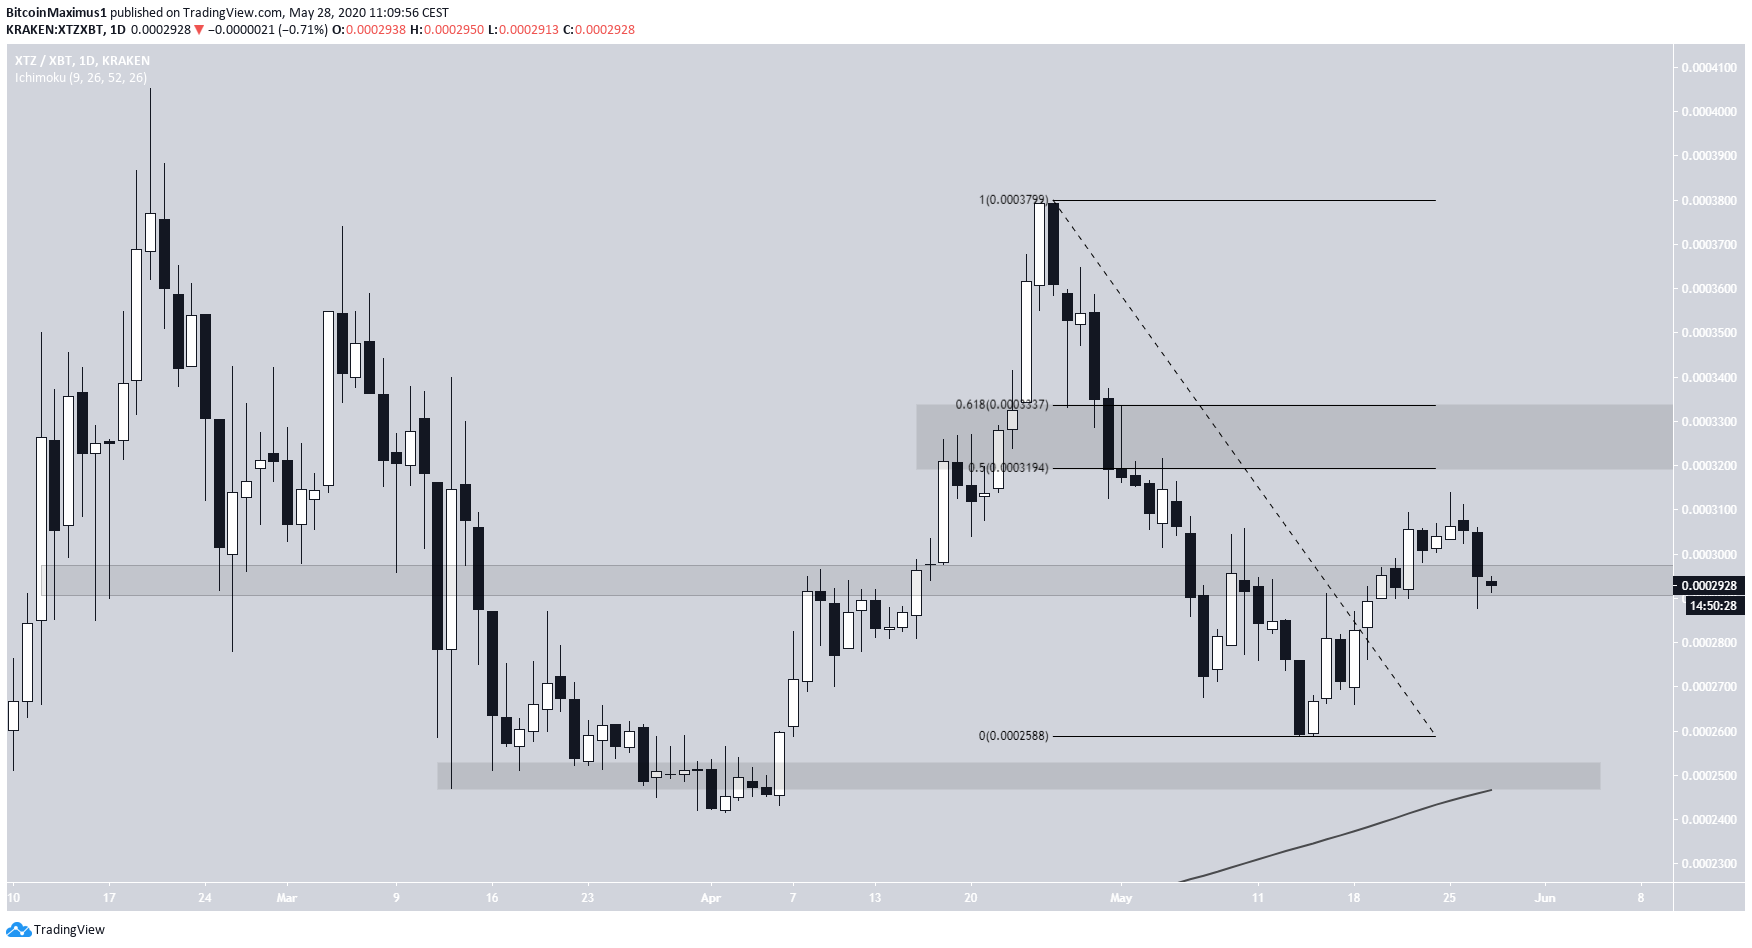
Top crypto projects in the US | April 2024
Trusted
Disclaimer
In line with the Trust Project guidelines, this price analysis article is for informational purposes only and should not be considered financial or investment advice. BeInCrypto is committed to accurate, unbiased reporting, but market conditions are subject to change without notice. Always conduct your own research and consult with a professional before making any financial decisions. Please note that our Terms and Conditions, Privacy Policy, and Disclaimers have been updated.

Valdrin Tahiri
Valdrin discovered cryptocurrencies while he was getting his MSc in Financial Markets from the Barcelona School of Economics. Shortly after graduating, he began writing for several different cryptocurrency related websites as a freelancer before eventually taking on the role of BeInCrypto's Senior Analyst.
(I do not have a discord and will not contact you first there. Beware of scammers)
READ FULL BIO
Sponsored
Sponsored