

Ontology (ONT) is in the process of breaking out from a horizontal and diagonal resistance levels. If successful, the rate of increase could accelerate greatly.
ONT has been decreasing since reaching an all-time high of $2.95 in May 2021. Since Sept, it has been following a descending resistance line, which led to an all-time low price of $0.19 in June.
While Ontology is still following a descending resistance line, the weekly RSI has already broken out from its resistance. Such breakouts in the RSI often precede breakouts in the price.
If the price manages to break out, the $0.45 area would be expected to provide resistance. This is a crucial area since it had previously provided support since $0.45.

Cryptocurrency trader @Coinqts tweeted a chart of ONT, stating that it could double in price soon.
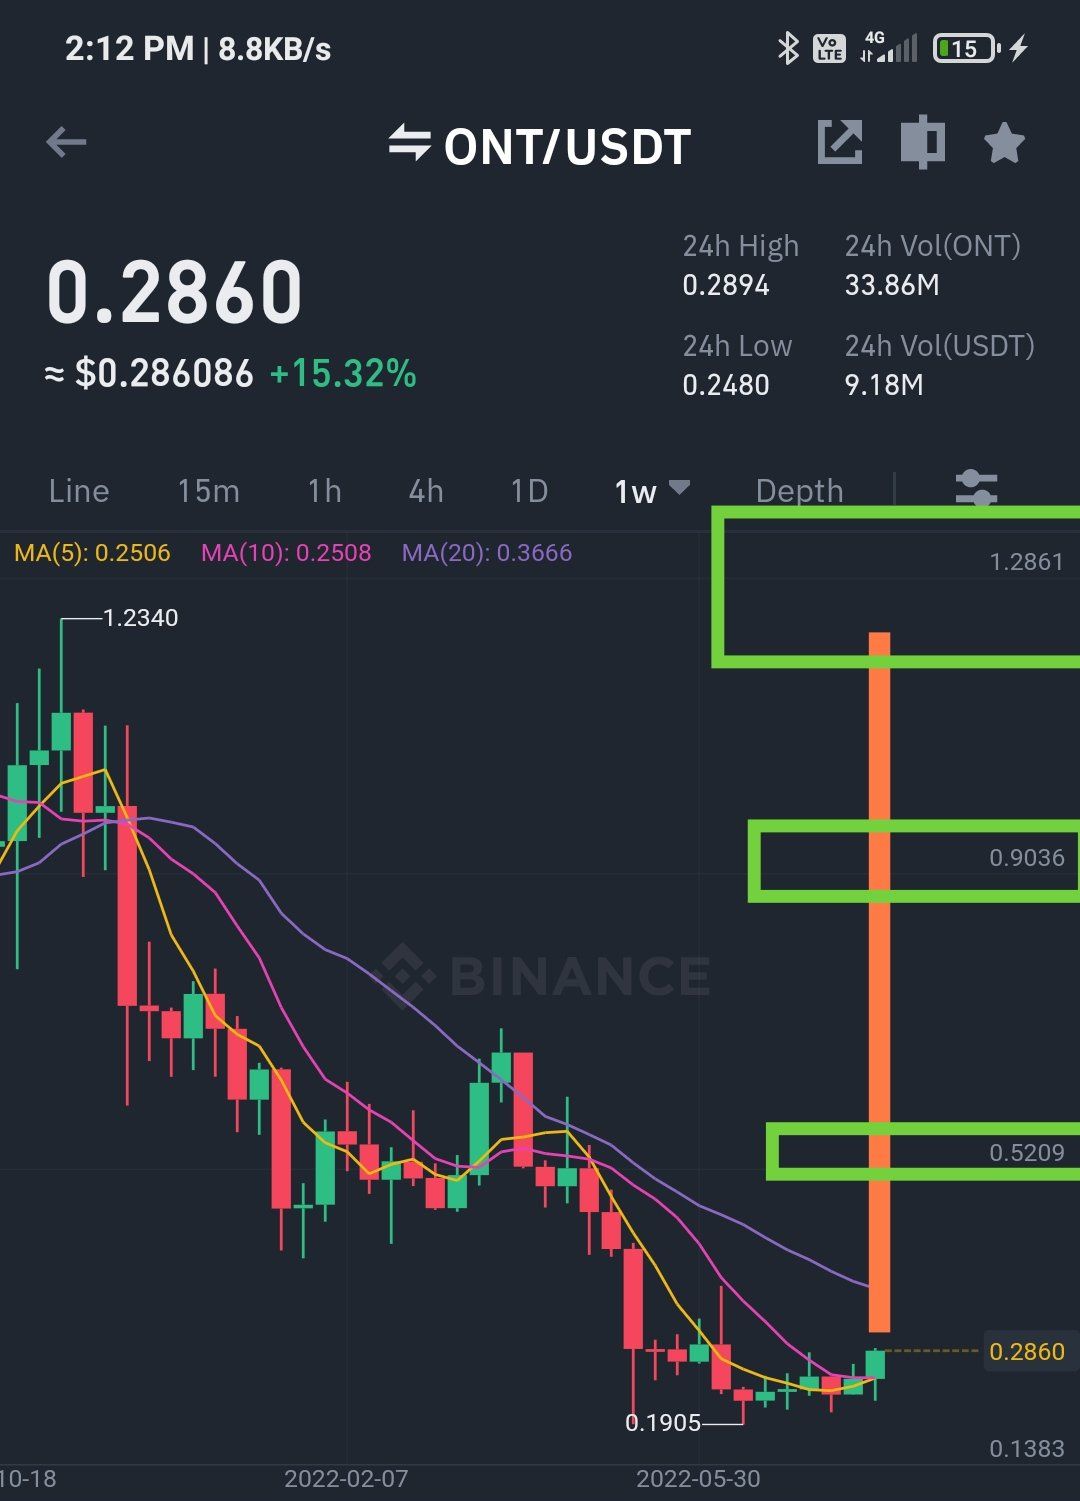
If the price manages to break out, it would likely reach the $0.45 area, which is nearly double the current price.
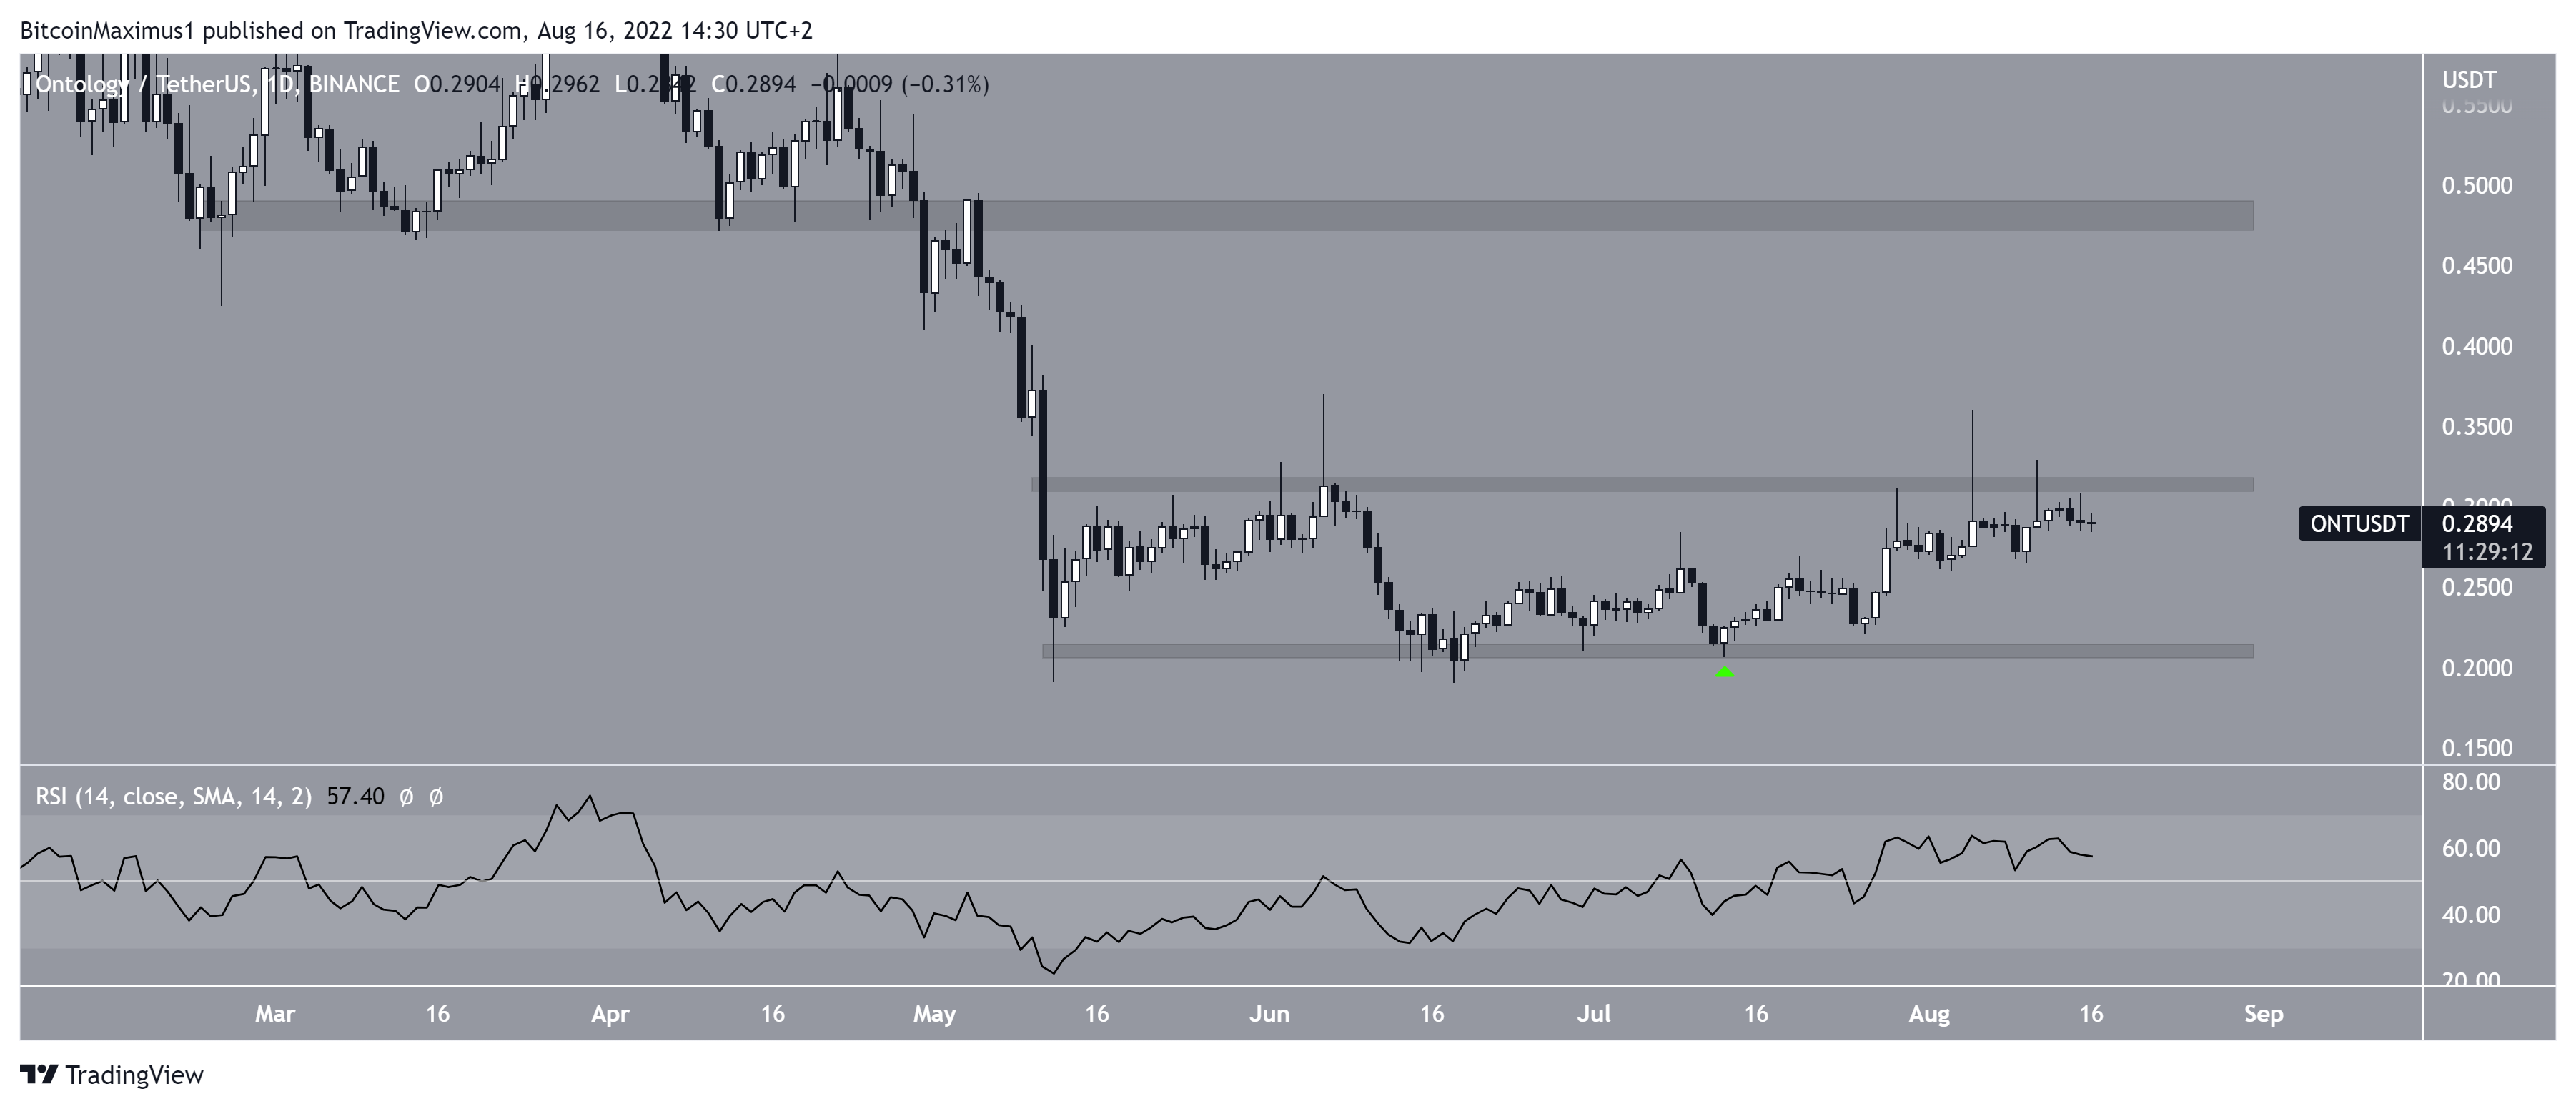
Short-term movement
The daily chart shows that ONT has been trading inside a range between $0.21 and $0.315 since May. More recently, it bounced at the support of the range on and has been increasing since July (green icon). It is currently making an attempt at breaking out.
The daily chart indicates that the most likely scenario is an eventual breakout. The two reasons for this are the fact that the RSI has moved above 50 and that the price has already made several attempts at breaking out.
If a breakout occurs, the closest resistance in the daily timeframe is at $0.48, aligning with the previously outlined long-term resistance.
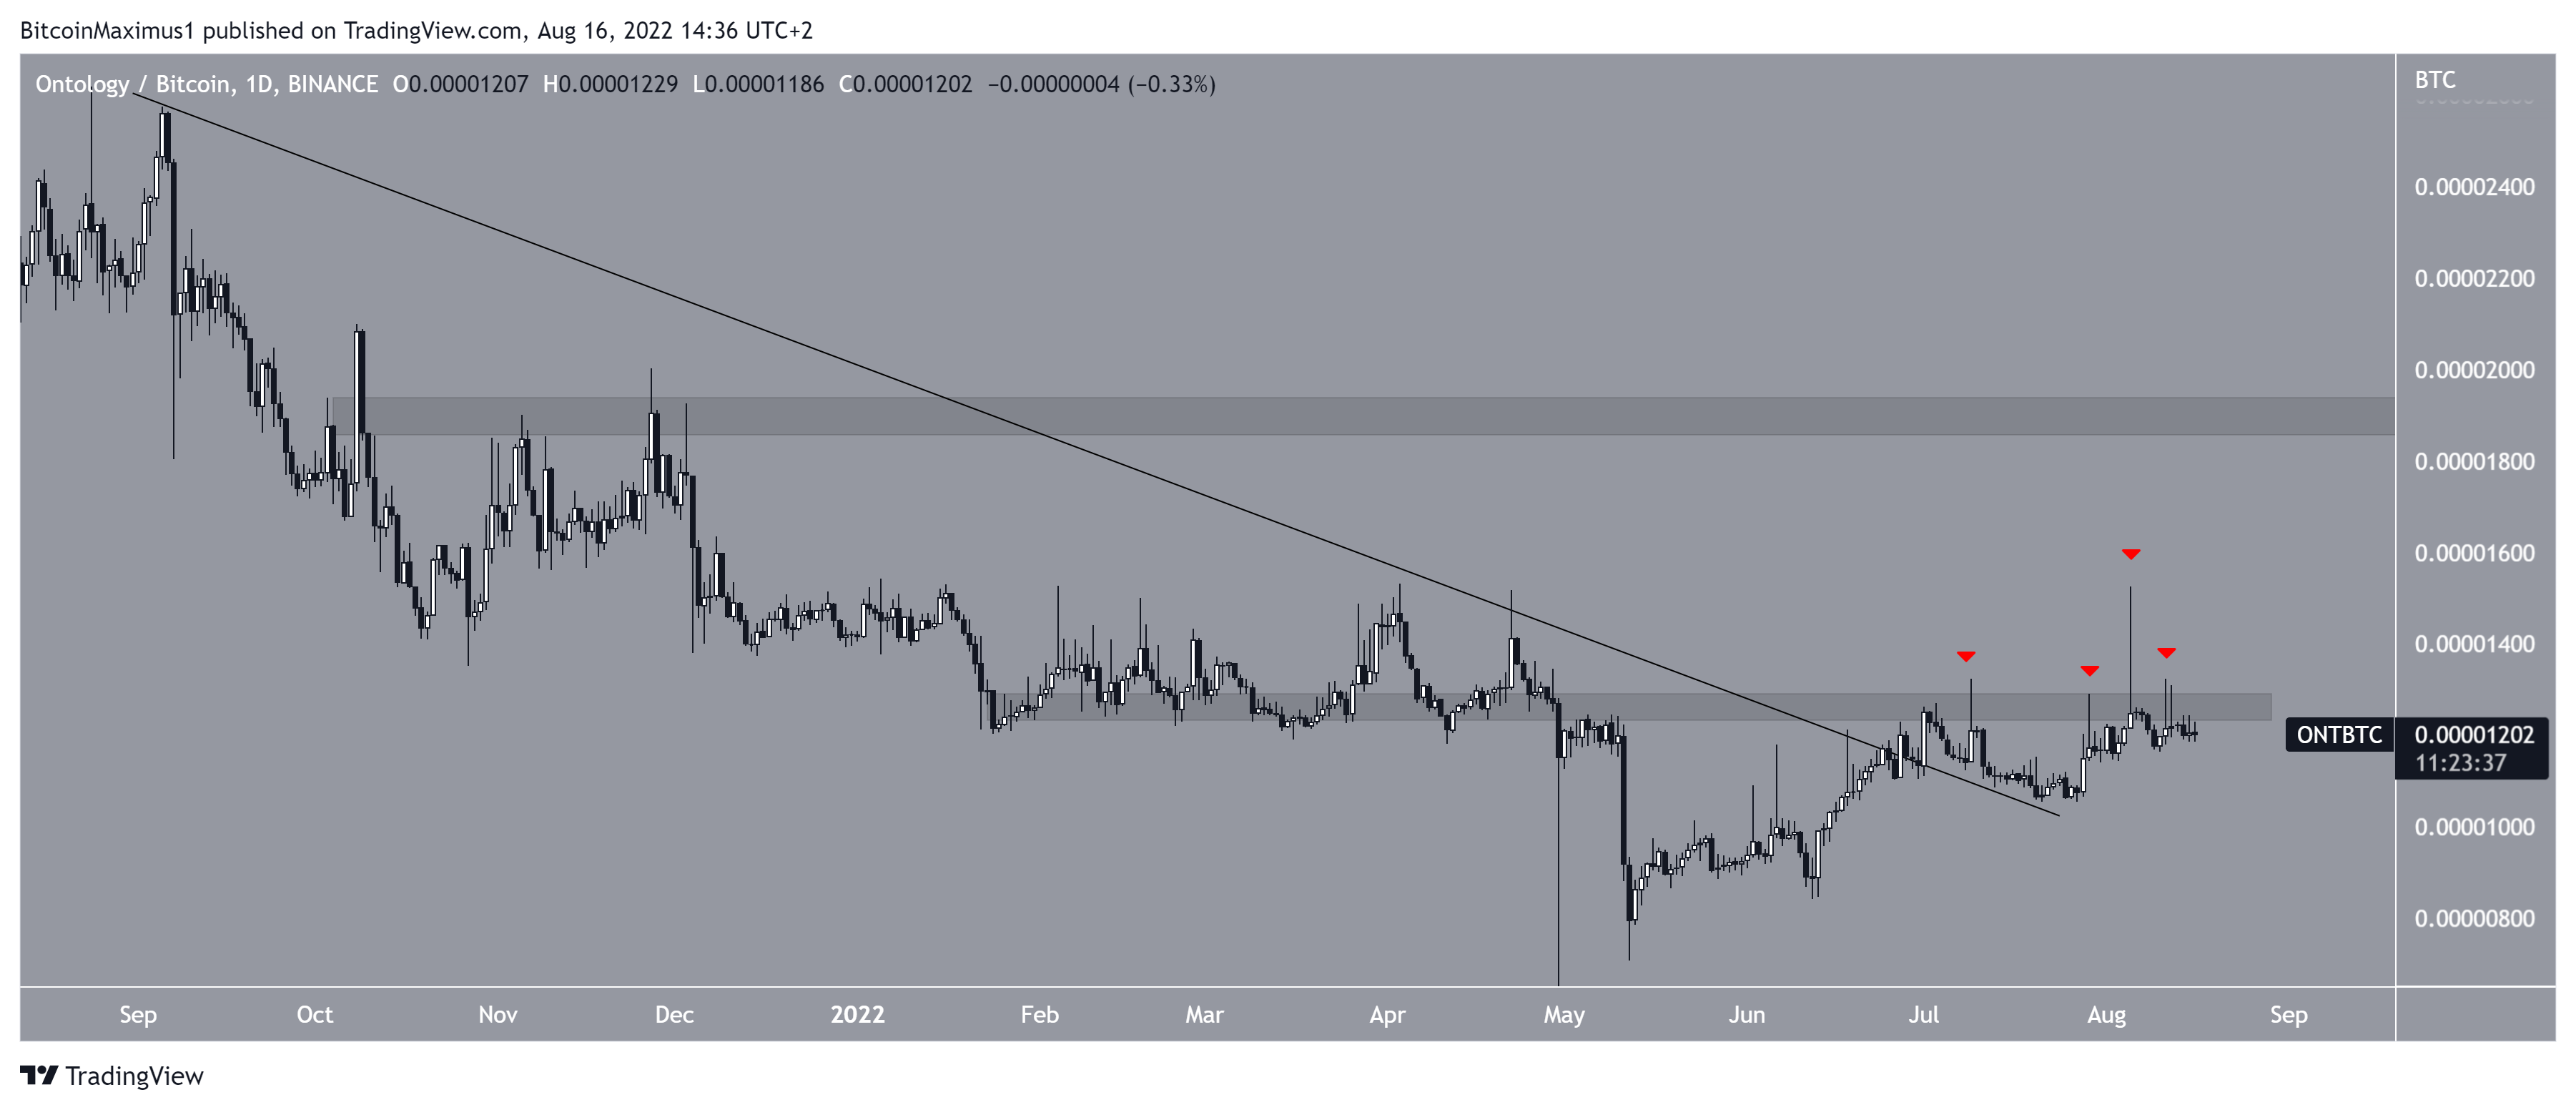
ONT/BTC
The chart for ONT/BTC is more bullish than the USD counterpart, since the price has already broken out from a descending resistance line. It has currently made four attempts at breaking out from the 1,260 satoshi horizontal resistance area.
If it is successful in breaking out, it could increase rapidly towards 1,900 satoshis.
For Be[in]Crypto’s latest Bitcoin (BTC) analysis, click here
Trusted
Disclaimer
In line with the Trust Project guidelines, this price analysis article is for informational purposes only and should not be considered financial or investment advice. BeInCrypto is committed to accurate, unbiased reporting, but market conditions are subject to change without notice. Always conduct your own research and consult with a professional before making any financial decisions. Please note that our Terms and Conditions, Privacy Policy, and Disclaimers have been updated.
