
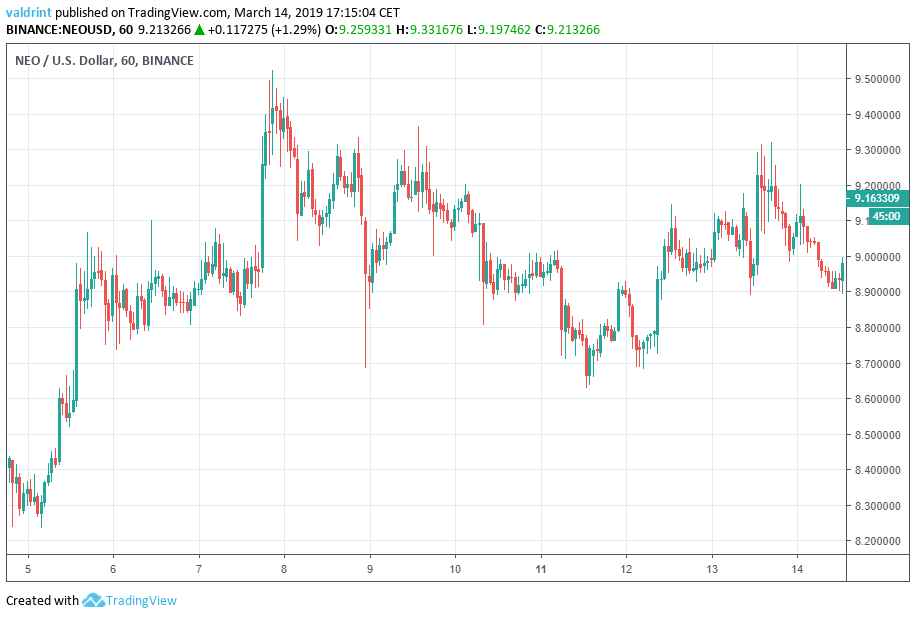
On March 4, 2019, the price of NEO (NEO) made a low of near $8. It has been on a gradual uptrend since. How long can it continue?
Before we answer that question, here’s a look at NEO’s price from Mar 4 to Mar 14.
 Based on today’s we believe that slight price increases are to be expected in the near future. At some point in the future, a rapid upward or downward movement may follow.
Key Highlights For Mar 14
- The price has been on an uptrend since Mar 5.
- The price is trading inside a symmetrical triangle.
- There is bearish divergence developing in the RSI and the MACD.
- There are resistance areas near $0.098 and $0.108.
- There are support areas near $0.082 and $0.07.
Ascending Support
The price of NEO on Binance is analyzed at one-hour intervals from Mar 4 to Mar 14. The price made a low of $8.12 on Mar 4 before initiating a rapid upward movement. As market cycles were completed along this upward trend, each low was higher than the last. Afterward, every successive low has been higher than the preceding one. Tracing these successively higher lows gives us the ascending support line.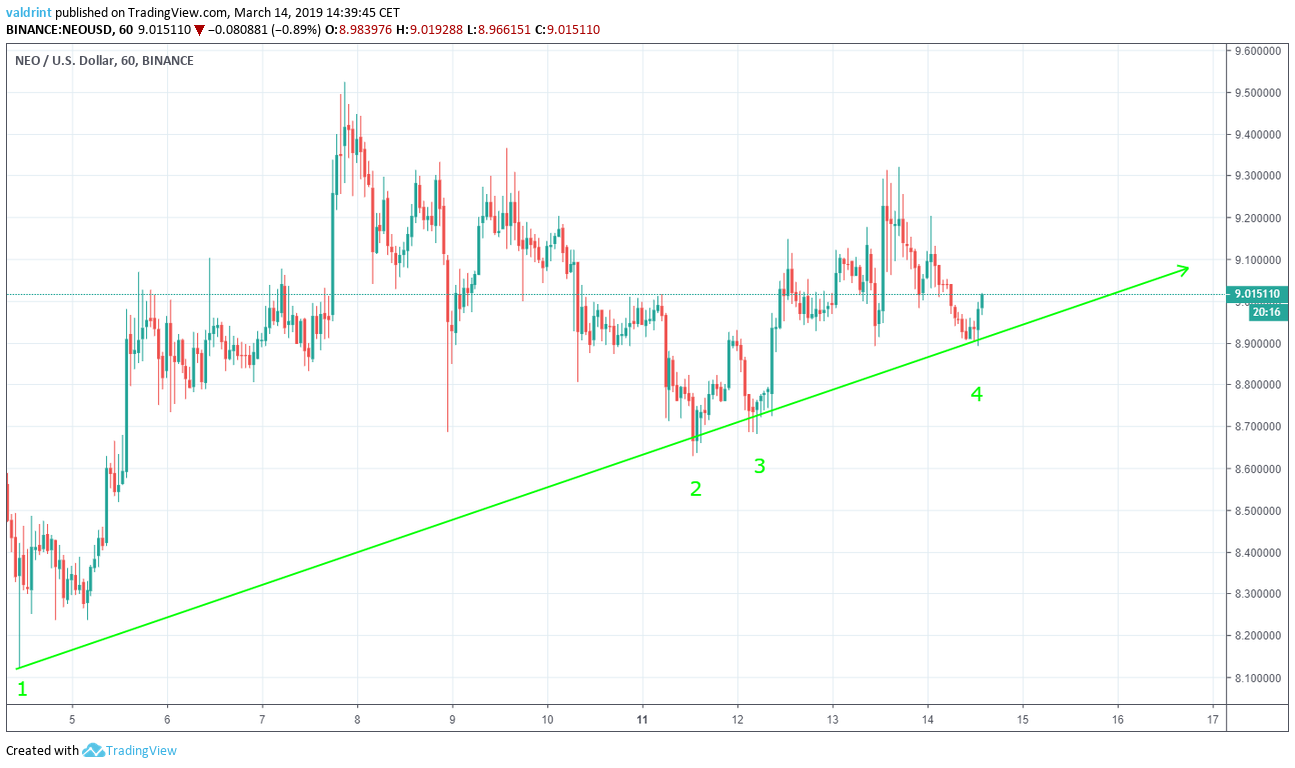 The ascending support line acts as a floor to price, preventing further downward movement. It is supposed to trace the lower limits of the price. It also serves to gauge the rate of price increases.
Between Mar 5 and 11, the price increased at a higher rate than by the support line. Since Mar 11, it has revisited the support line three times giving us a total of four points.
As price appears to stabilize around the support, we expect the upward trend to continue at the current rate until a peak is reached.
The ascending support line acts as a floor to price, preventing further downward movement. It is supposed to trace the lower limits of the price. It also serves to gauge the rate of price increases.
Between Mar 5 and 11, the price increased at a higher rate than by the support line. Since Mar 11, it has revisited the support line three times giving us a total of four points.
As price appears to stabilize around the support, we expect the upward trend to continue at the current rate until a peak is reached.
Symmetrical Triangle
On Mar 7, the price made a high of $9.52. It has made lower highs since. Tracing these highs gives us adescending resistance line.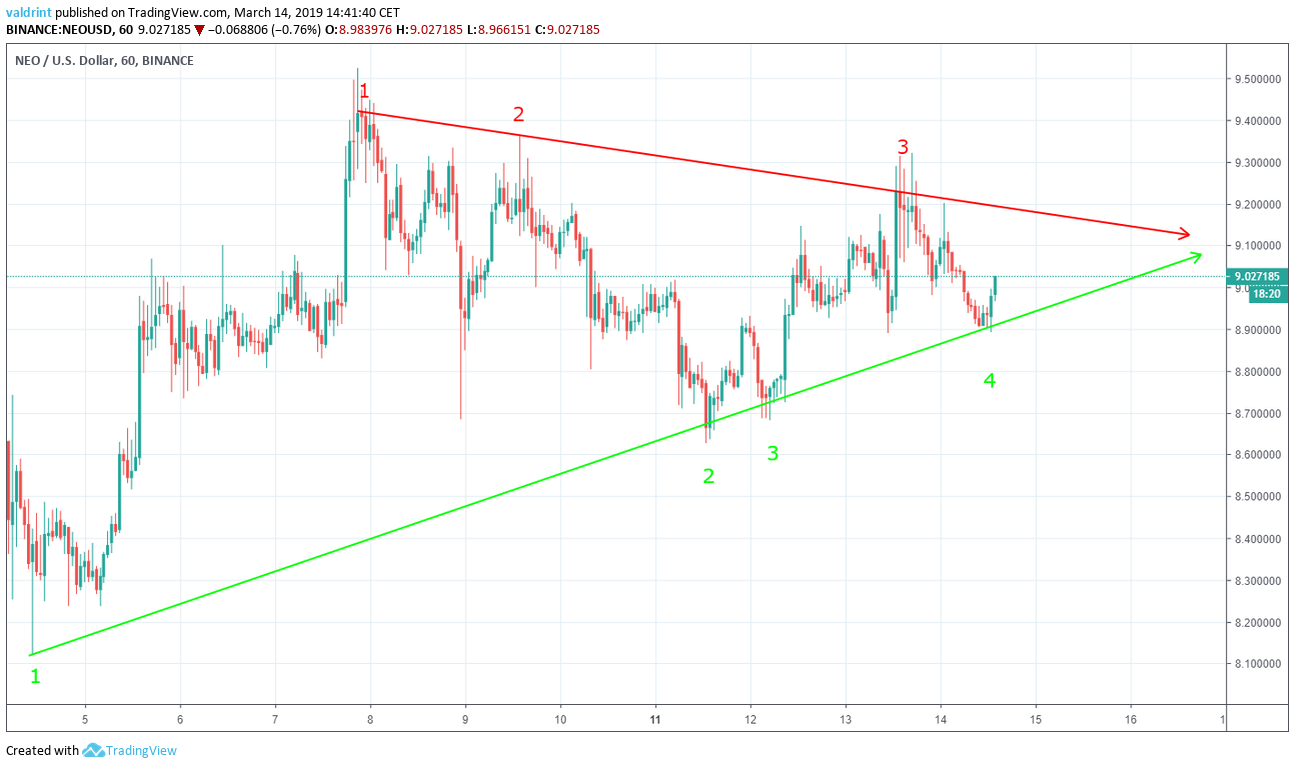
Bearish Divergence
In order to successfully predict the direction of the move, we take a closer look at the indicators. The moving average convergence divergence (MACD) is a trend indicator that shows the relationship between two moving averages (long and short-term) and the price. It is used to measure the strength of a move. The relative strength index (RSI) is an indicator which calculates the size of the changes in price in order to determine oversold or overbought conditions in the market. Combining MACD and RSI bullish/bearish divergence with support/resistance essentially predicts price fluctuations.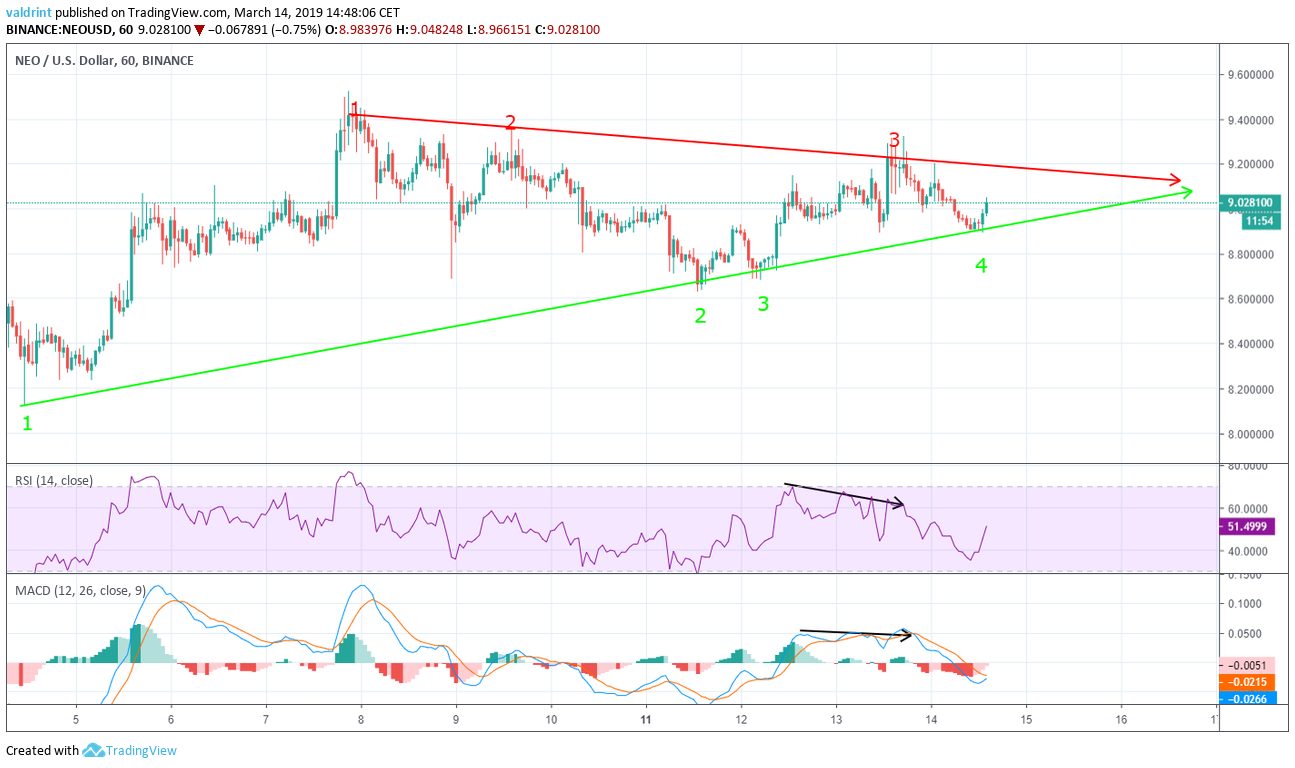 On Mar 12, the price made a high of $9.14. It proceeded to make a higher high on Mar 13, at $9.31.
The MACD and RSI both made the first high on Mar 12. However, they continued to make lower highs since.
This is called bearish divergence and often precedes drops in price. A partial drop has already occurred. Furthermore, the level of divergence is not very significant. Greater drops may be expected, but they can be definitively inferred from these indicators.
Using these indicators and the creation of a neutral pattern, a price increase and decrease are both likely, however, the presence of divergence makes a breakdown slightly more likely.
On Mar 12, the price made a high of $9.14. It proceeded to make a higher high on Mar 13, at $9.31.
The MACD and RSI both made the first high on Mar 12. However, they continued to make lower highs since.
This is called bearish divergence and often precedes drops in price. A partial drop has already occurred. Furthermore, the level of divergence is not very significant. Greater drops may be expected, but they can be definitively inferred from these indicators.
Using these indicators and the creation of a neutral pattern, a price increase and decrease are both likely, however, the presence of divergence makes a breakdown slightly more likely.
Reversal Areas
The price of NEO on Binance is analyzed at six-hour intervals from Jan 7 to Mar 14, in order to better visualize potential reversal areas in the future.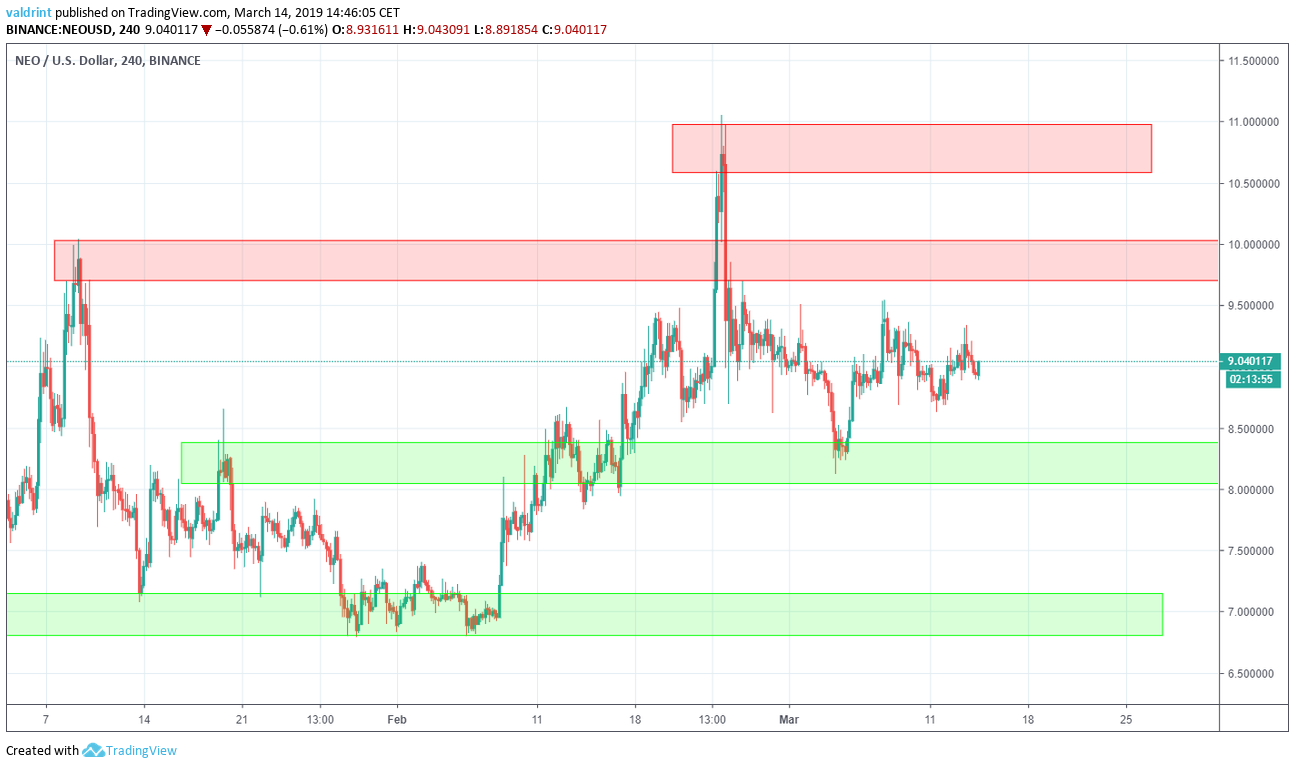
Summary of Analysis
Based on this analysis, the price of NEO is likely to trade inside the symmetrical triangle before making a decisive move. While the market view is quite neutral, we believe a breakdown may be slightly more likely than a breakout. If the price touches the resistance and support areas several times, the prediction will be partially validated. If it then continues to break down, it will be fully validated. Do you think the price of NEO will make an upward or a downward move? Let us know in the comments below. Disclaimer: This article is not trading advice and should not be construed as such. Always consult a trained financial professional before investing in cryptocurrencies, as the market is particularly volatile.
Top crypto projects in the US | April 2024
Trusted
Disclaimer
In line with the Trust Project guidelines, this price analysis article is for informational purposes only and should not be considered financial or investment advice. BeInCrypto is committed to accurate, unbiased reporting, but market conditions are subject to change without notice. Always conduct your own research and consult with a professional before making any financial decisions. Please note that our Terms and Conditions, Privacy Policy, and Disclaimers have been updated.

Valdrin Tahiri
Valdrin discovered cryptocurrencies while he was getting his MSc in Financial Markets from the Barcelona School of Economics. Shortly after graduating, he began writing for several different cryptocurrency related websites as a freelancer before eventually taking on the role of BeInCrypto's Senior Analyst.
(I do not have a discord and will not contact you first there. Beware of scammers)
READ FULL BIO
Sponsored
Sponsored