

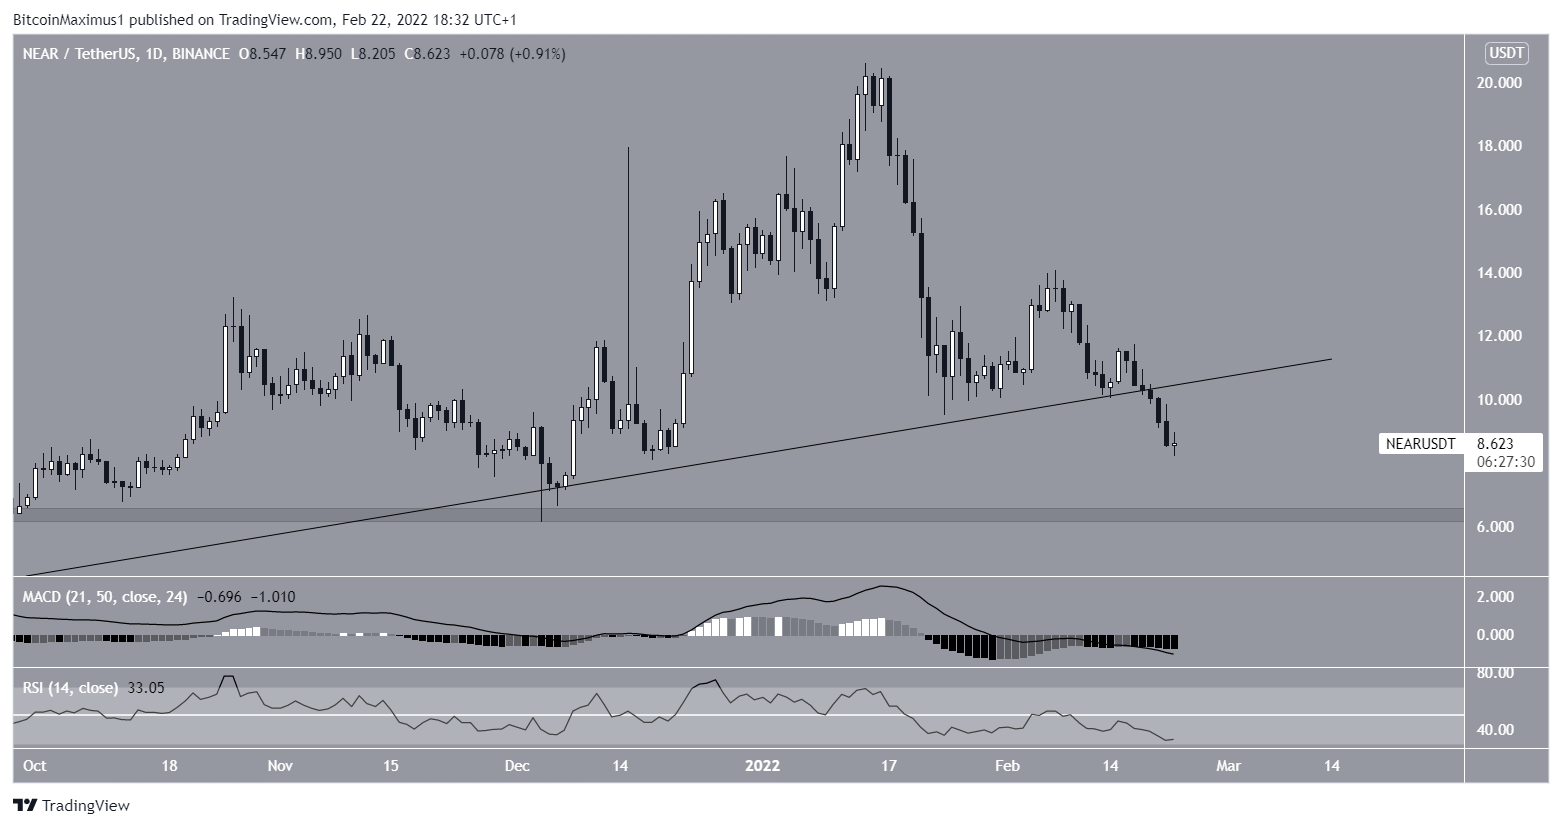
Near Protocol (NEAR) has broken down from a long-term ascending support line, invalidating its bullish structure in the process.
NEAR has been falling since reaching an all-time high price of $20.54 on Jan 14. On Feb 19, the price broke down from an ascending support line that had previously been in place since July 2021.
So far, the price has decreased by 58%, culminating with a low of $8.20 on Feb 22.
If the downward movement continues, the closest support area would be at $6.40. The area has not been reached since Dec 2021.

Ongoing NEAR decrease
Cryptocurrency trader @AltcoinSherpa tweeted a chart of NEAR, stating that the $8-$12 region could provide strong support.
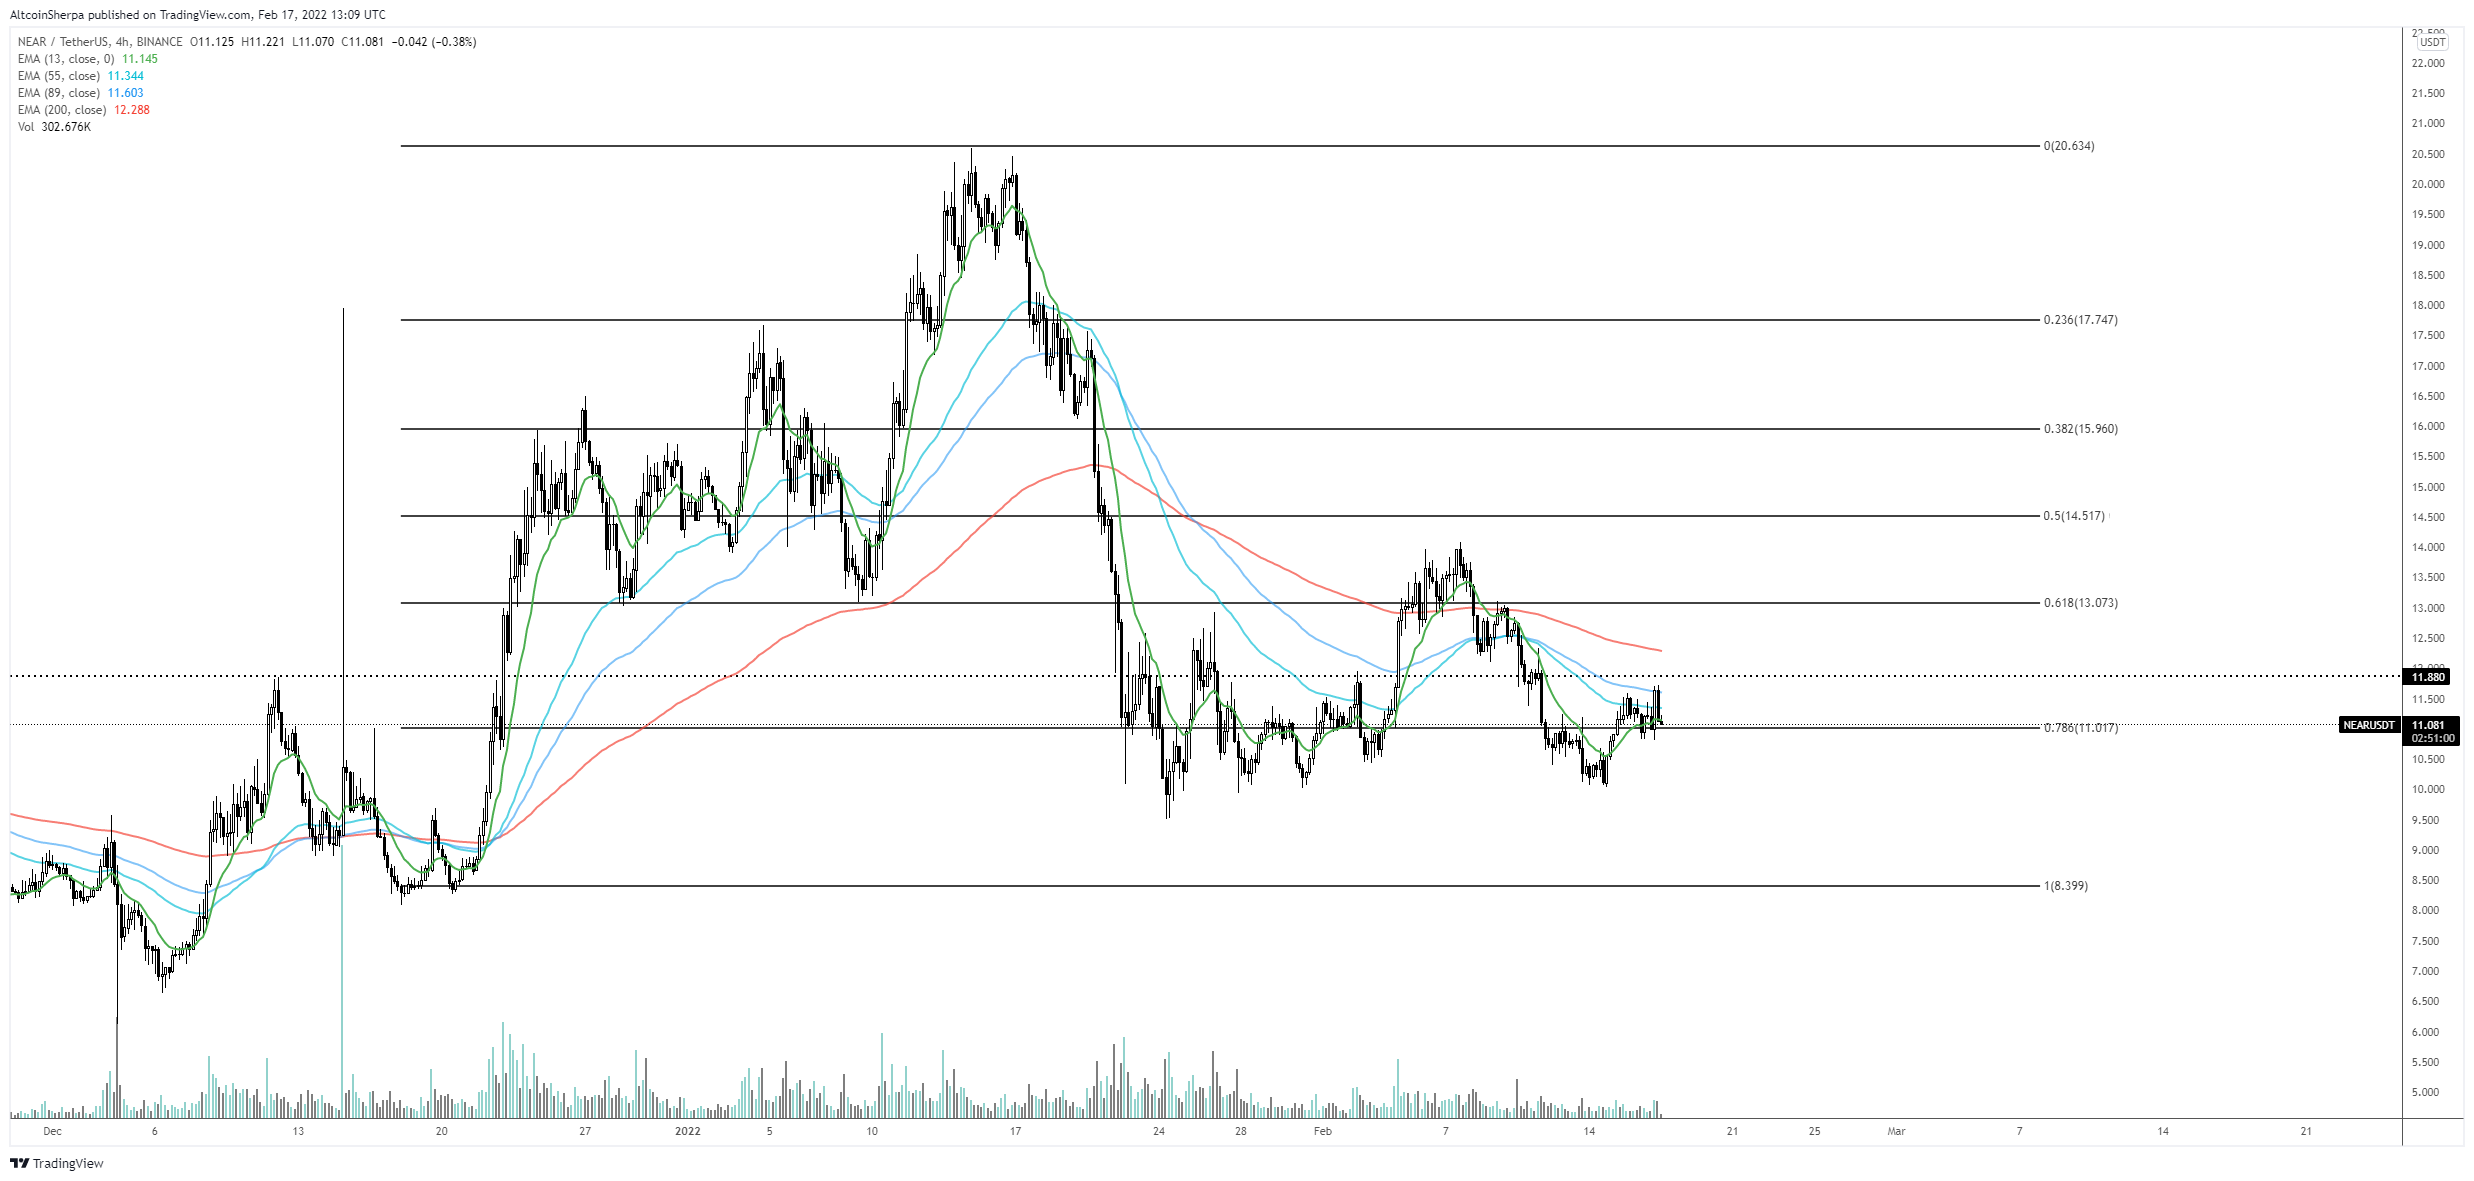
Since the tweet, NEAR has reached the lower portion of this region. However, technical indicators are still bearish.
Both the MACD and RSI are decreasing. Furthermore, the former is negative while the latter is below 50. Both of these are signs of a bearish trend. Finally, there are no signs of a developing bullish divergence, which often precedes bullish trend reversals.
Therefore, the daily time-frame outlook supports the continuation of the decrease at least to the $6.40 horizontal support area.
Short-term movement
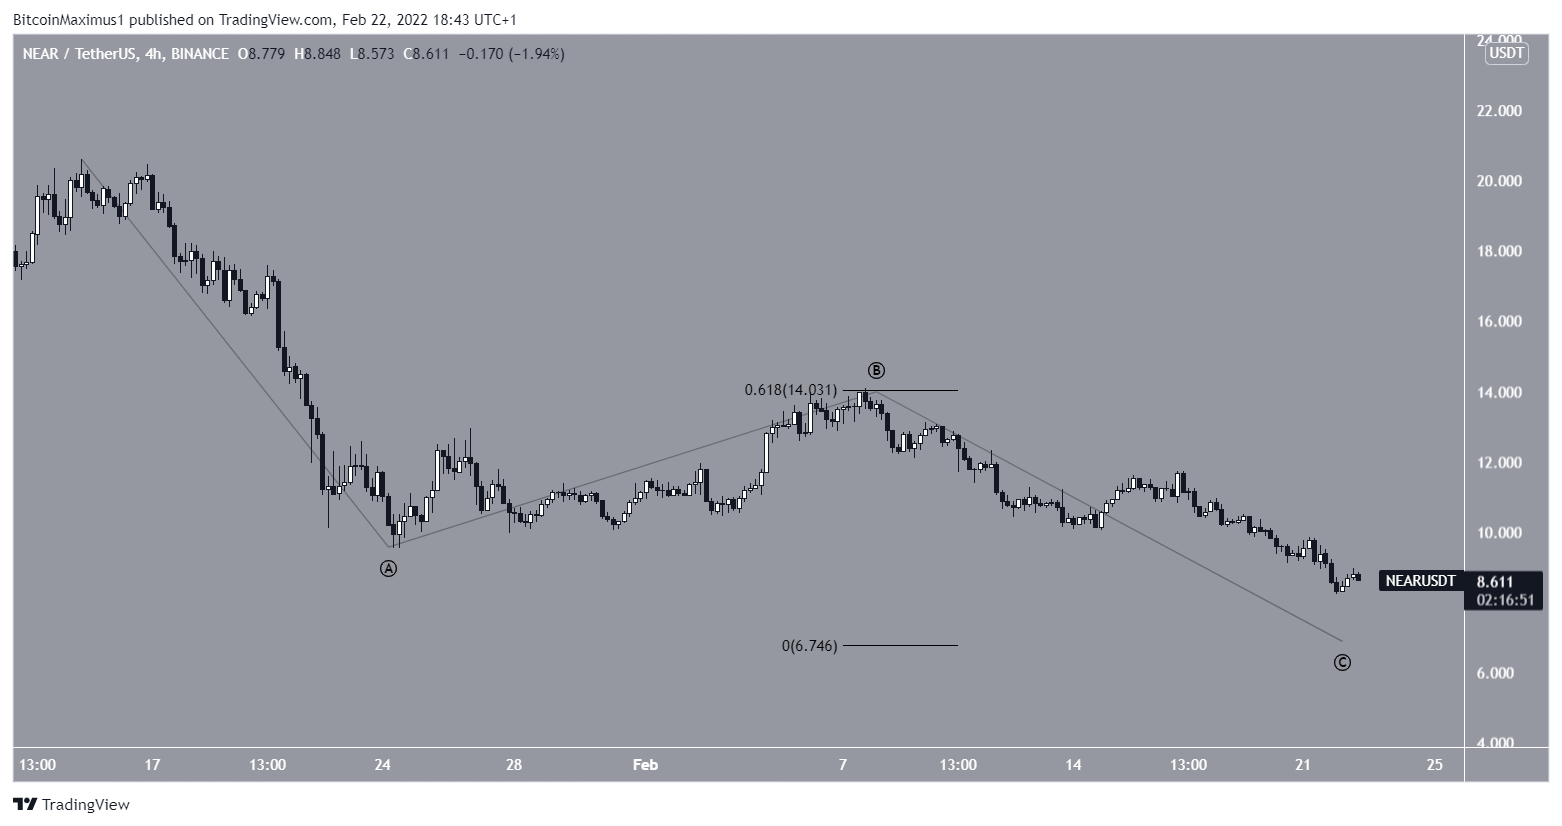
Measuring from the all-time high, it is possible that the decrease is an A-B-C corrective structure (black). If so, then NEAR is currently in the C and final wave of this decrease.
Giving waves A:C a 1:0.618 ratio would lead to a low of $6.75, very close to the previously outlined $6.40 horizontal support area.
This ratio further adds to the confluence near the $6.40 region and supports the possibility that a bottom will be reached there. Therefore, if NEAR reaches this area, the presence of bullish reversal signs will be key in determining if a reversal will transpire.
For BeInCrypto’s latest Bitcoin (BTC) analysis, click here
Trusted
Disclaimer
In line with the Trust Project guidelines, this price analysis article is for informational purposes only and should not be considered financial or investment advice. BeInCrypto is committed to accurate, unbiased reporting, but market conditions are subject to change without notice. Always conduct your own research and consult with a professional before making any financial decisions. Please note that our Terms and Conditions, Privacy Policy, and Disclaimers have been updated.
