

The Matic Network (MATIC) price has returned to a support level that has been in place since May.
The lack of a strong reaction from the area suggests that the price will eventually breakdown.
MATIC Long-Term Support
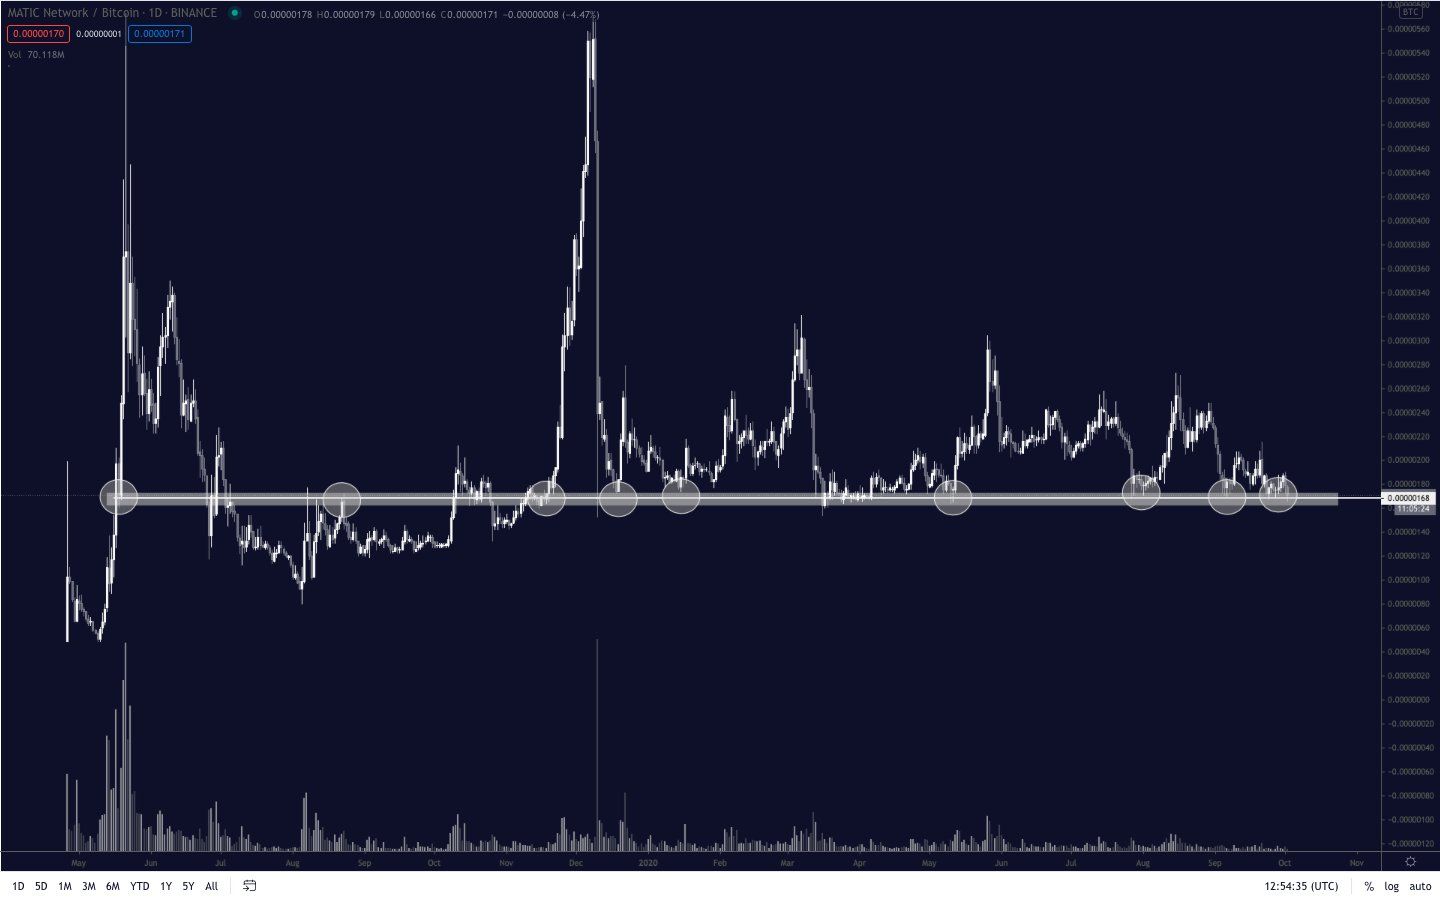
At the beginning of May, the MATIC price reached the 170 satoshi support level and began an upward move that led to a high of 304 satoshis being reached. However, the higher prices could not be sustained and MATIC has been decreasing since. While MATIC has revisited the support area multiple times, each bounce has been weaker than the preceding one, a sign of diminishing buyer strength. A breakdown from the 170 satoshi support could potentially trigger a sharp drop.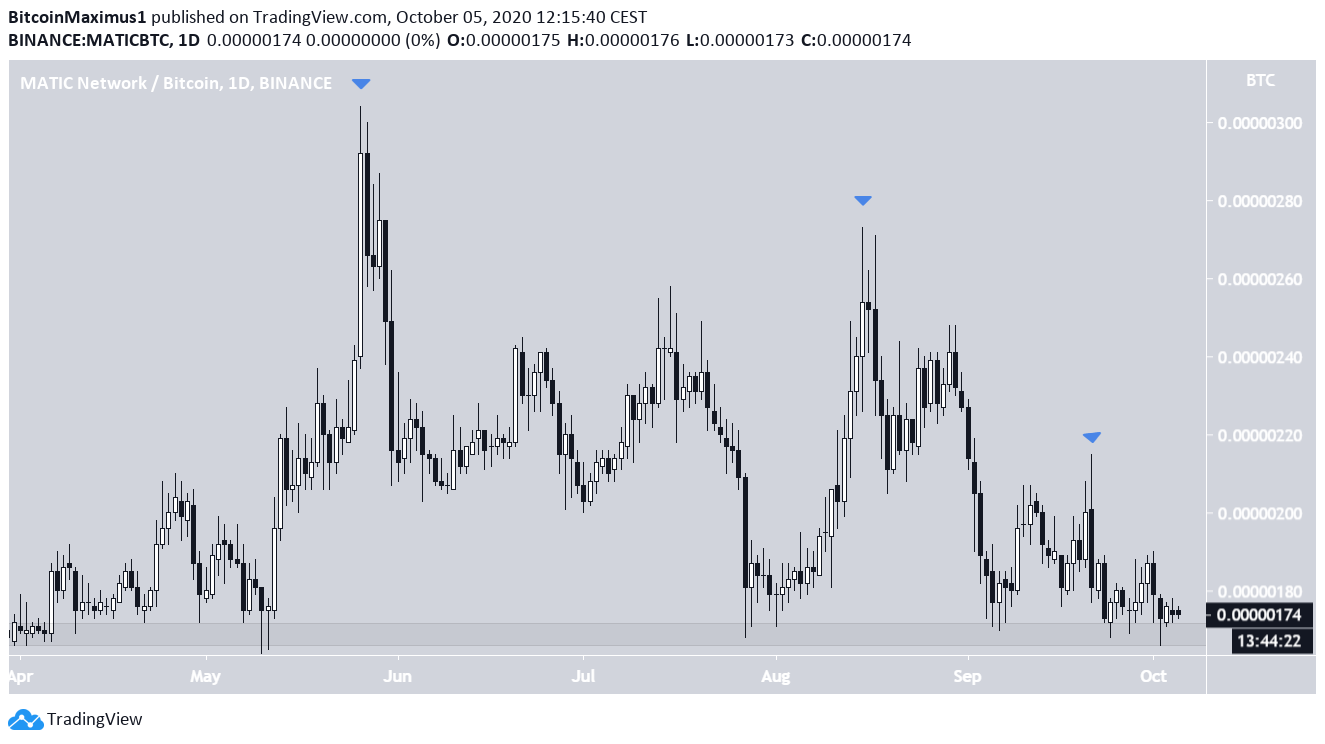
Potential Breakdown
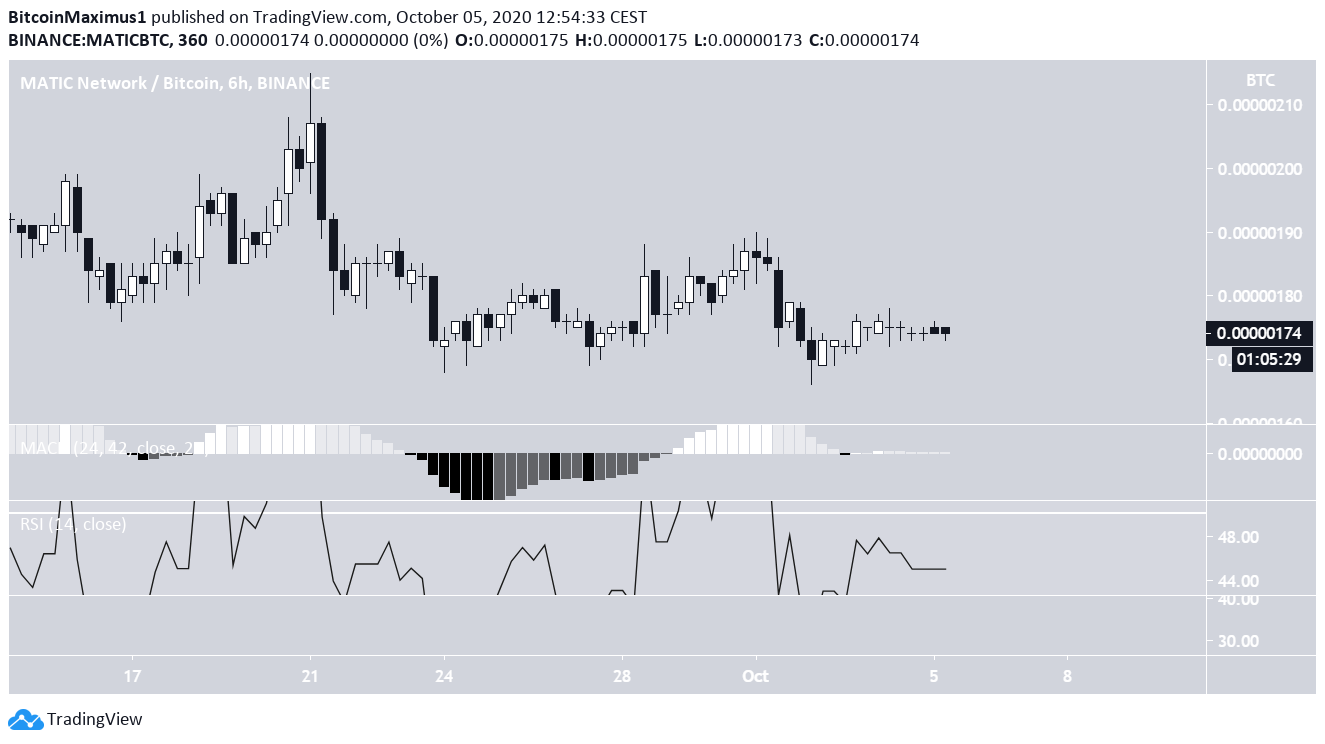
A closer look at the daily chart shows that the price is following a descending resistance line that is found within the 170 satoshi support area, and created a descending triangle. which is normally considered a bearish reversal pattern. Technical indicators are leaning on being bullish, but have not confirmed anything yet. While the MACD is increasing and the RSI has generated bullish divergence, the latter is below 50 and the Stochastic Oscillator has not yet made a bullish cross.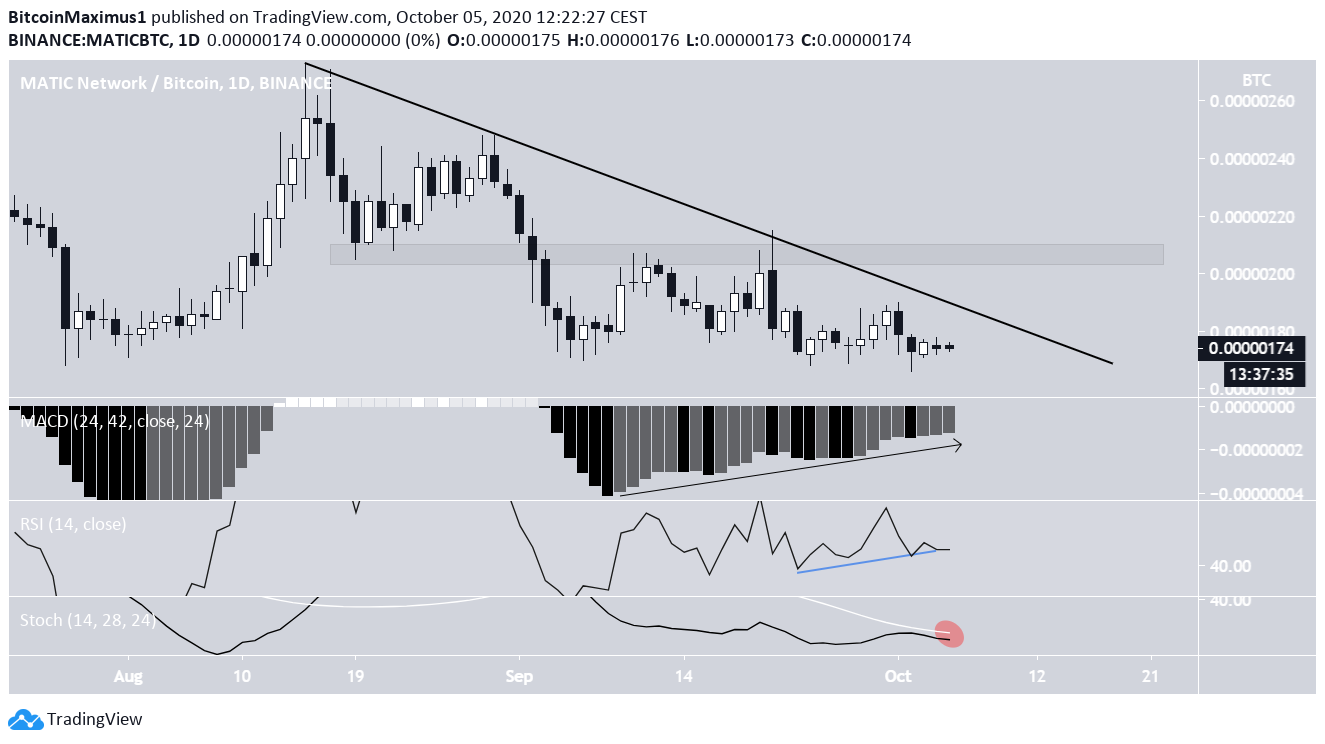
Conclusion
To conclude, the two likeliest possibilities for MATIC’s movement is either a breakdown from the 170 support area or a bounce upwards toward the 205 satoshi resistance area. Due to the diminishing strength and lack of bullish reversal signs, the former scenario option seems more likely.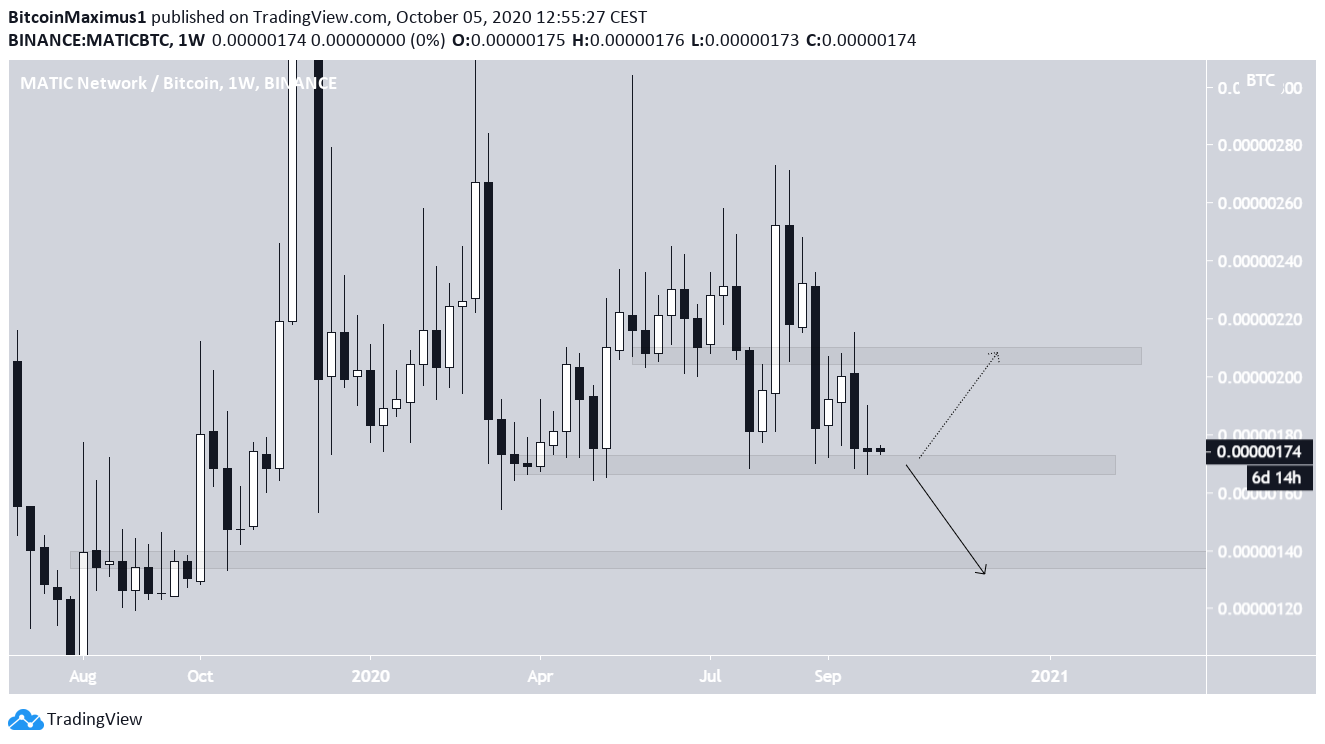
Top crypto projects in the US | April 2024
Trusted
Disclaimer
In line with the Trust Project guidelines, this price analysis article is for informational purposes only and should not be considered financial or investment advice. BeInCrypto is committed to accurate, unbiased reporting, but market conditions are subject to change without notice. Always conduct your own research and consult with a professional before making any financial decisions. Please note that our Terms and Conditions, Privacy Policy, and Disclaimers have been updated.

Valdrin Tahiri
Valdrin discovered cryptocurrencies while he was getting his MSc in Financial Markets from the Barcelona School of Economics. Shortly after graduating, he began writing for several different cryptocurrency related websites as a freelancer before eventually taking on the role of BeInCrypto's Senior Analyst.
(I do not have a discord and will not contact you first there. Beware of scammers)
READ FULL BIO
Sponsored
Sponsored