

In this article, BeInCrypto takes a look at the seven altcoins that have increased the most over the past seven days (Feb. 19 – 26):
- Fantom (FTM) – 172%
- Holo (HOT) – 92%
- Pundi X (NPXS) – 64%
- Solana (SOL) – 43.61%
- Ravencoin (RVN) – 42.59%
- Matic Network (MATIC) – 40.65%
- OKB (OKB) – 31.78%
Fantom (FTM)
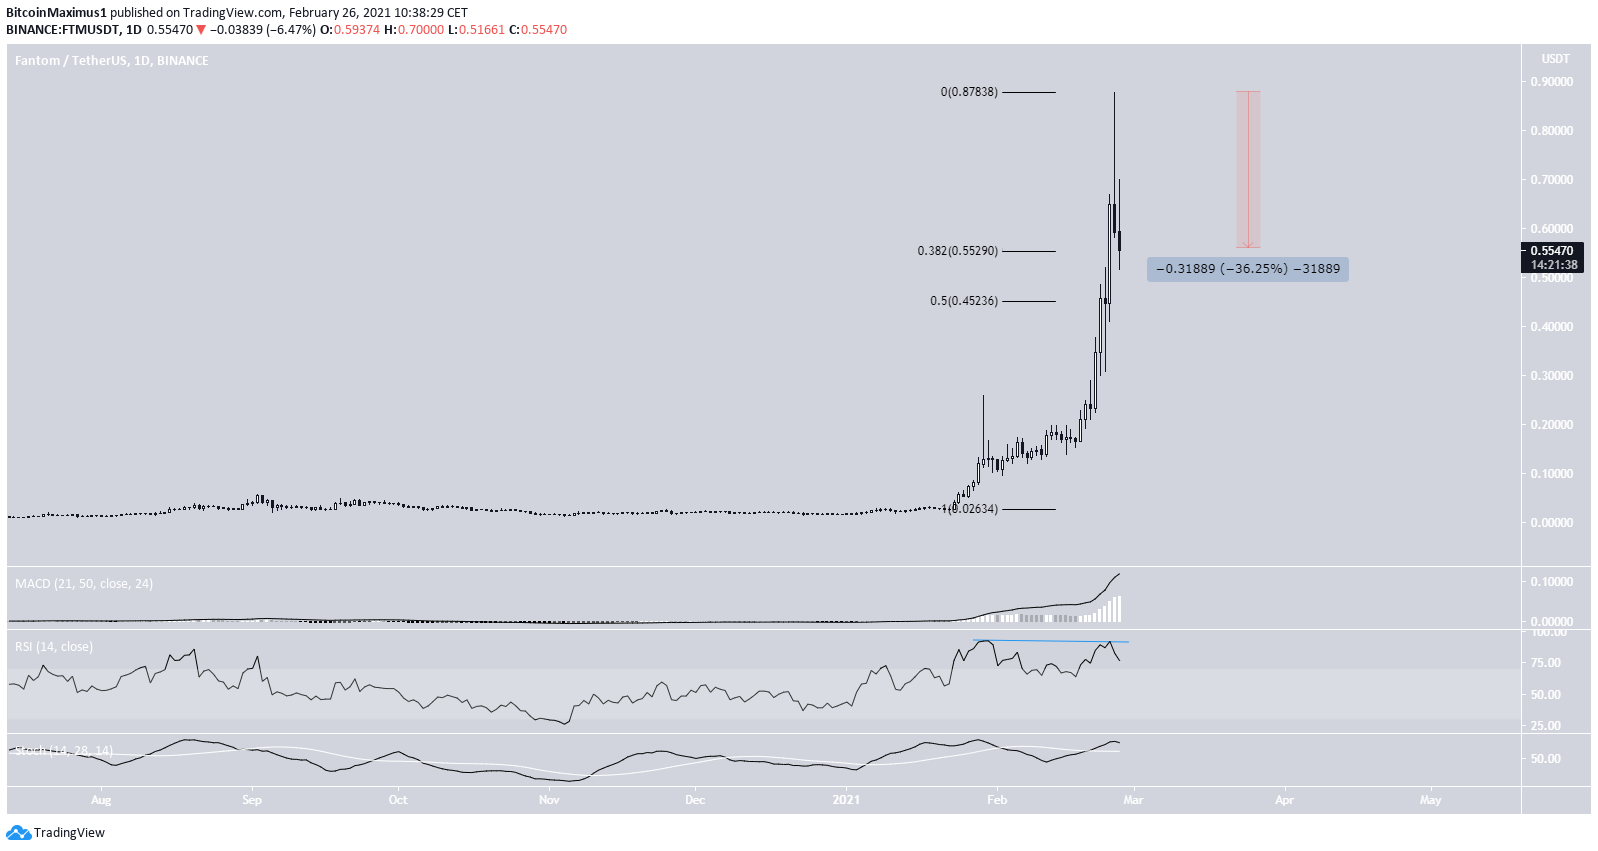
FTM increased considerably last week, moving all the way to #49 based on its market capitalization.
On Feb. 25, it reached an all-time high price of $0.87 but has decreased considerably since then. So far, it has lost 36% of its value and is currently trading at $0.55.
While the MACD and Stochastic oscillator are still increasing, the daily RSI has generated a considerable bearish divergence. This is a sign of a possible top.
This is also strengthened by the fact that the rally has become completely parabolic and formed a shooting star candlestick on Feb. 25.
Currently, FTM is at the 0.382 Fib retracement support level. However, another decrease could take it back to the 0.5 Fib retracement at $0.45.
Holo (HOT)
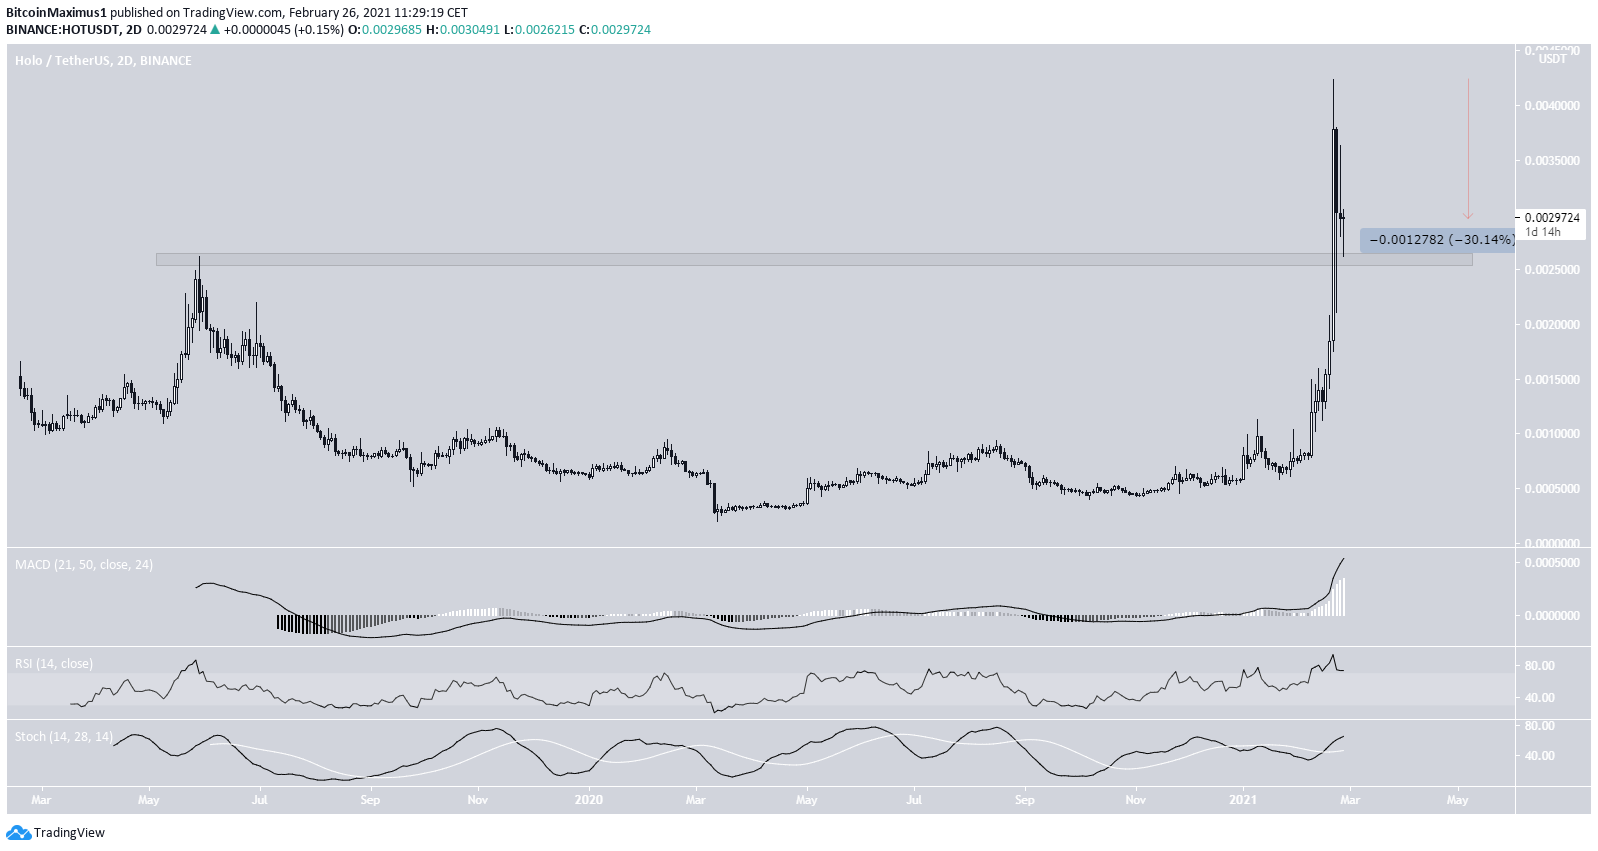
HOT has been decreasing since reaching an all-time high price of $0.0042 on Feb. 21. So far, it has decreased by 30%. Despite the drop, HOT has moved into the top-100 based on its market capitalization, currently ranking at #90.
Nevertheless, HOT has validated the previous all-time high resistance area at $0.0026 and looks to be bouncing.
As long as HOT is trading above this level, the possibility for upwards continuation remains high.
Despite the rally being parabolic, technical indicators do not yet show any weakness.
On Feb. 24, the HOT team held a live Youtube AMA, which could have influenced the surge.
Pundi X (NPXS)
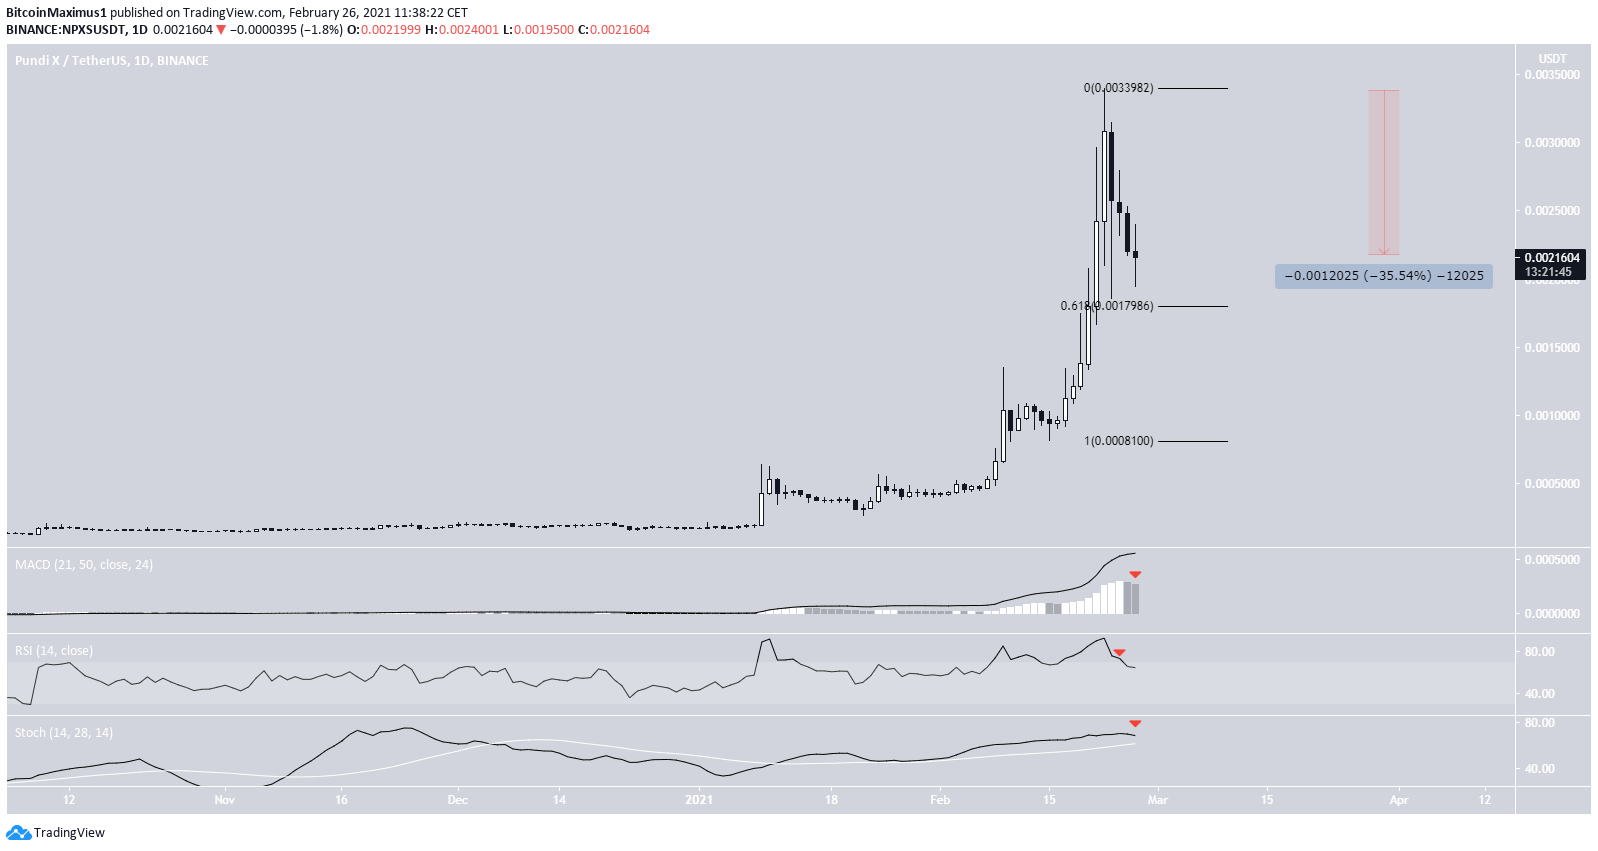
NPXS has been decreasing since Feb. 22, when it reached a high of $0.0034. Since then, it has lost 35% of its value. Despite the drop, NPXS has moved into the #87 spot by market cap.
NPXS is approaching the 0.618 Fib retracement level of the most recent upward movement, which could potentially initiate a bounce.
Nevertheless, technical indicators have begun to show weakness. This is evidenced by the RSI cross below 70, the lower momentum bar in the MACD, and the possibility of a bearish cross in the Stochastic oscillator.
A system upgrade was performed on Feb. 19, so it’s possible that this had a positive effect on the price.
Solana (SOL)
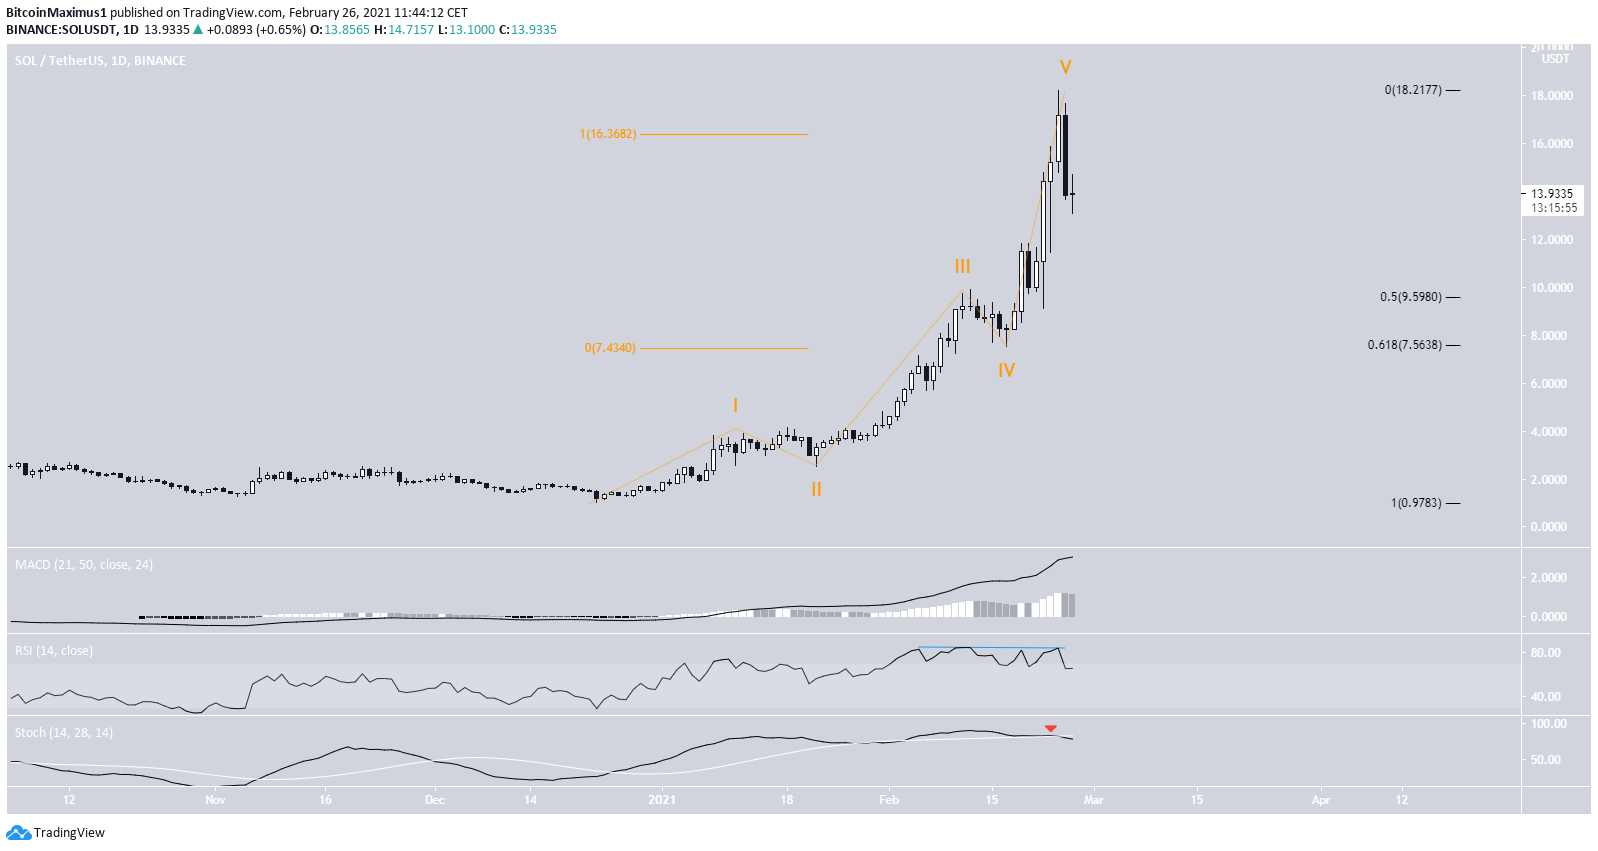
SOL has been decreasing since reaching an all-time high of $18.21 on Feb. 24. The next day, it created a bearish engulfing candlestick.
Despite the trop, SOL is still ranked #21 based on its market capitalization.
However, the rally is showing considerable weakness. The RSI has generated a very significant bearish divergence and the Stochastic oscillator has made a bearish cross.
The increase looks like a completed five-wave impulse, after which a significant correction usually follows. If so, the next closest support areas would be found at $9.60 and $7.60.
On Feb. 25, SOL was listed on the Bitfinex exchange. Interestingly, this had a negative effect on SOL, which fell in price soon after.
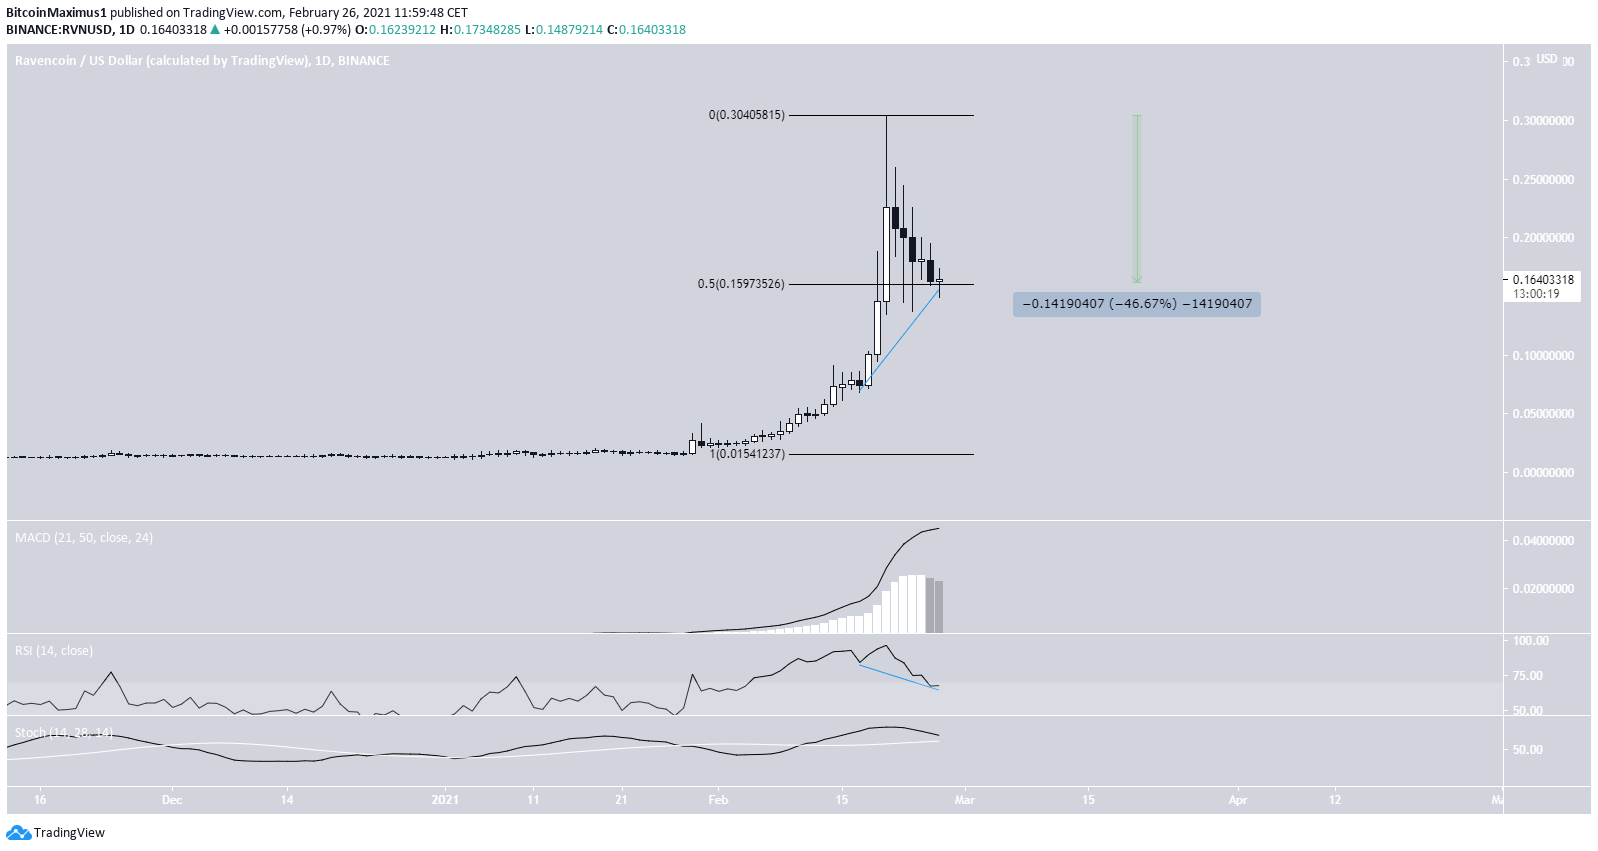
Ravencoin (RVN)
RVN has increased parabolically in February, moving all the way to #52 based on its market capitalization.
The increase led RVN to an all-time high price of $0.30, reached on Feb. 20. Since then, RVN has dropped considerably, losing 46% of its value. It’s currently trading near $0.16 (0.5 Fib retracement level).
Despite the drop, there are no clear signs of a bearish reversal. The Stochastic oscillator has yet to make a bearish cross and the RSI has generated a hidden bullish divergence.
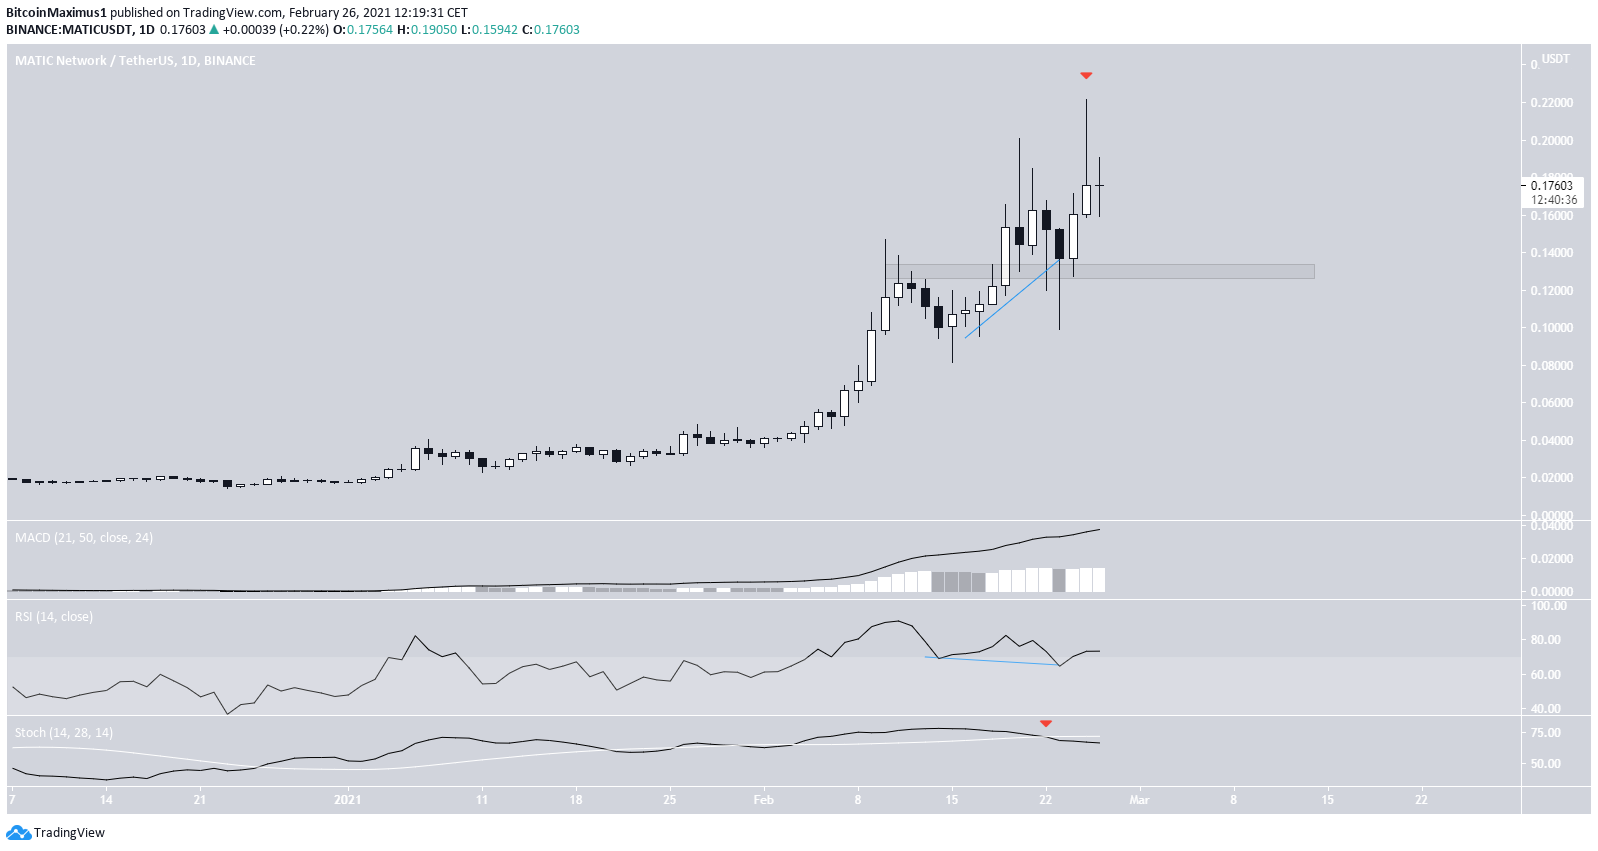
Matic Network (MATIC)
Unlike the majority of the market, MATIC regained all of its losses from Feb. 22-23 and reached an all-time high price of $0.221 on Feb. 25. Currently, MATIC is ranked #68 based on its market capitalization.
However, MATIC created a shooting star candlestick on Feb. 25, and has decreased slightly since.
On Feb. 23, MATIC was listed on the CoinBene exchange, slightly preceding its all-time high price.
Technical indicators are mixed. The MACD is neutral, the RSI has generated a hidden bullish divergence, while the Stochastic oscillator has made a bearish cross.
As long as MATIC is trading above the $0.13 support area, the probability of upwards continuation remains high.
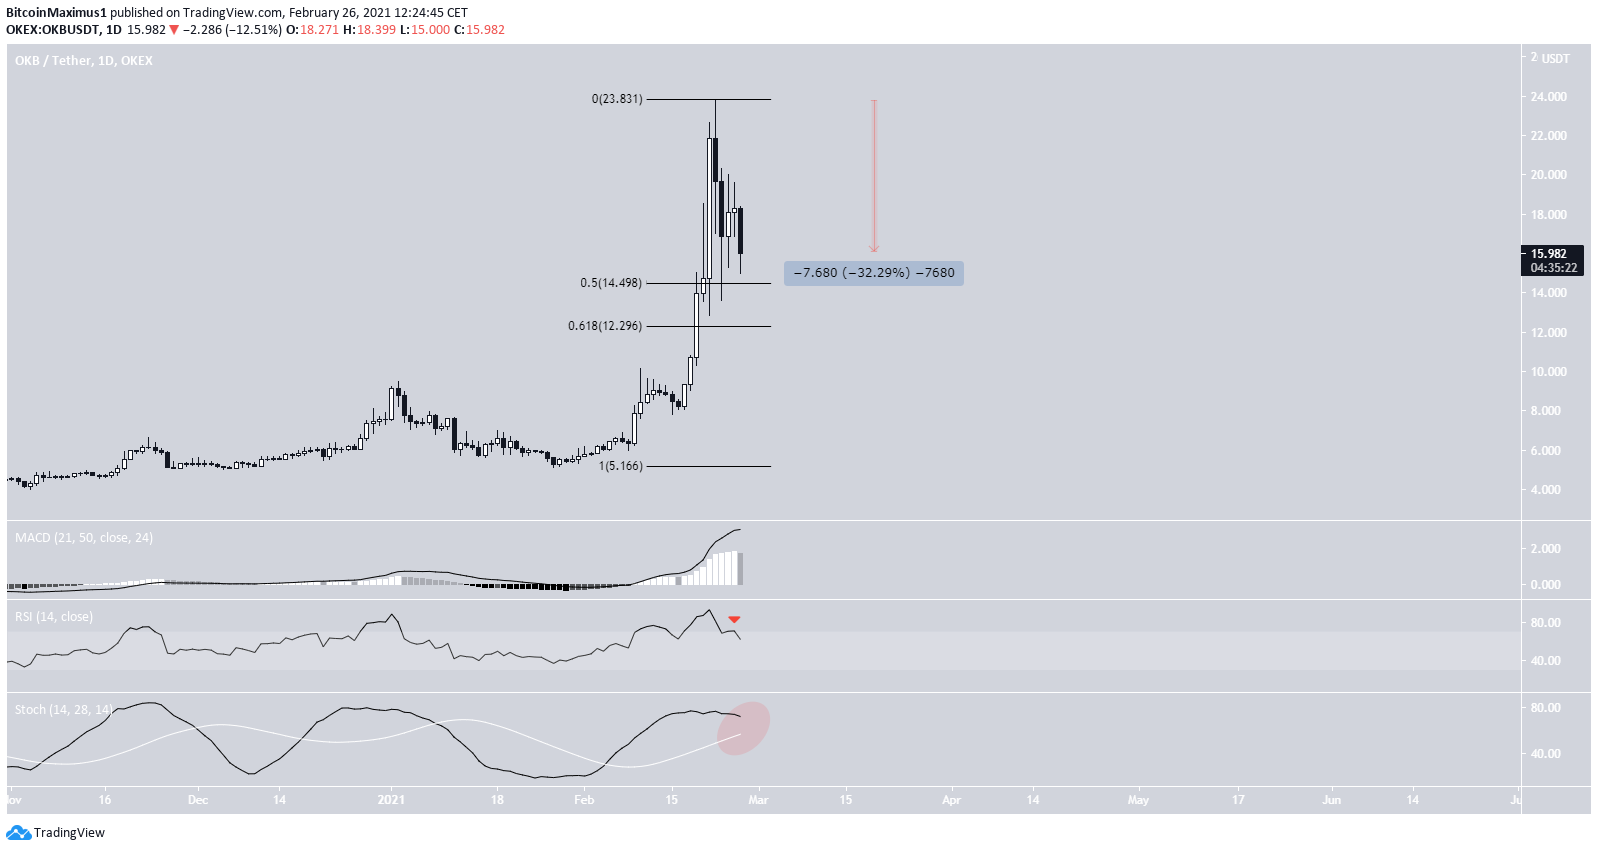
OKB (OKB)
OKB has been decreasing since reaching an all-time high price of $23.80 on Feb. 22. Since then, it has dropped by more than 30% and is currently trading at $15.80.
Despite the drop, OKB is ranked #66 in market capitalization.
However, technical indicators have begun to show weakness. This can be seen in the RSI cross below 70 and the potential bearish cross in the Stochastic oscillator.
OKB is trading just above the 0.5 Fib retracement support level at $14.50. However, a continued decrease could cause it to drop to the 0.618 Fib at $12.30.
For BeInCrypto’s latest Bitcoin (BTC) analysis, click here
Trusted
Disclaimer
In line with the Trust Project guidelines, this price analysis article is for informational purposes only and should not be considered financial or investment advice. BeInCrypto is committed to accurate, unbiased reporting, but market conditions are subject to change without notice. Always conduct your own research and consult with a professional before making any financial decisions. Please note that our Terms and Conditions, Privacy Policy, and Disclaimers have been updated.
