
Lunyr (LUN) is a relatively small coin. At the time of writing, it was ranked 411 by market capitalization.
However, Lunyr does have a useable platform which showcases how a decentralized encyclopedia on the blockchain may disrupt the wiki industry. This may bode well for prices in the near future.
Key Highlights for March 5
- The price of Lunyr has gradually increased since Feb 6, 2019.
- On Feb 24, a flash crash affecting the whole market caused Lunyr to lose around 30% of its value.
- A recovery brought Lunyr to new highs on Feb 26.
- Subsequent volatility has left Lunyr trading at around $2.10 on Mar 5.
- Price recently broke out of the symmetrical triangle.
- There are resistance areas at $2.18, $2.31 and $2.48
Landing Support
The price of LUN on binance was analyzed on two-hour intervals from Feb 6 to Mar 5. Lunyr experienced a low of $1.5 on Feb 6. A gradual rise ensued, in which price continuously made ascending lows.
Tracing the ascending highs creates the ascending support line. The number of times the line is touched and its validity have a positive correlation. The line for LUN was validated five times.
Lunyr experienced a low of $1.5 on Feb 6. A gradual rise ensued, in which price continuously made ascending lows.
Tracing the ascending highs creates the ascending support line. The number of times the line is touched and its validity have a positive correlation. The line for LUN was validated five times.
Tracing The Resistance
The descending resistance line is created by inverting the method used for the ascending support line. Descending highs, rather than ascending lows, are traced.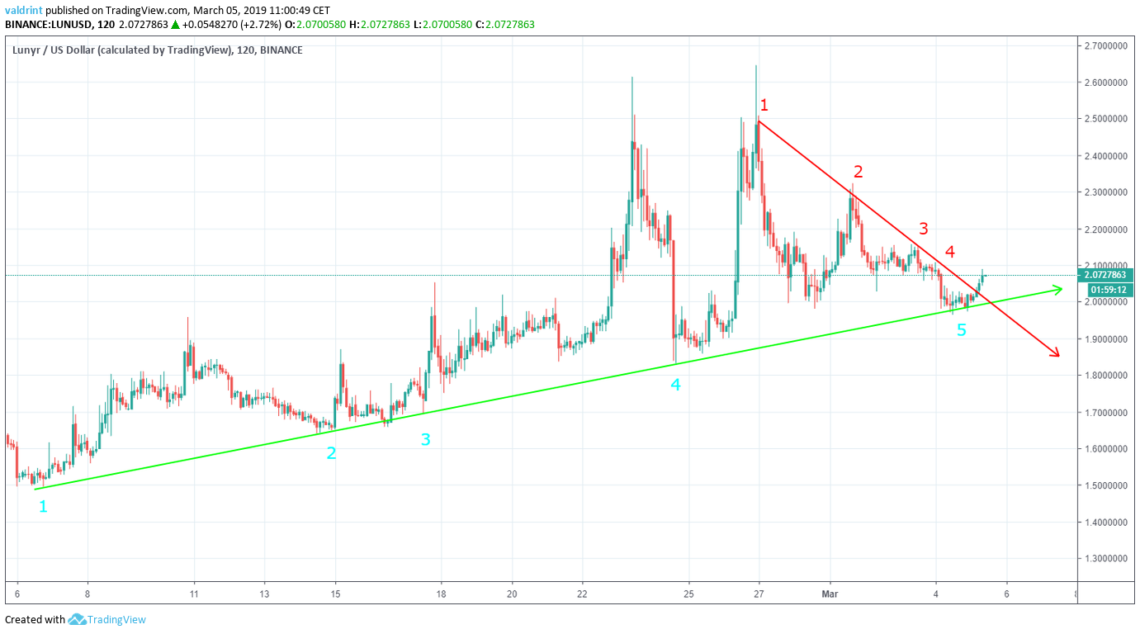 After reaching the Feb 26 high at $2.60, the price continuously generated descending highs. The line was validated four times. The price seems to be decreasing at the same rate as predicted by the descending highs.
The descending resistance line combined with the ascending support line create a symmetrical triangle.
After reaching the Feb 26 high at $2.60, the price continuously generated descending highs. The line was validated four times. The price seems to be decreasing at the same rate as predicted by the descending highs.
The descending resistance line combined with the ascending support line create a symmetrical triangle.
A look at the RSI & Volume
The relative strength index (RSI) is an indicator which calculates the size of the changes in price in order to determine oversold or overbought conditions in the market. It ranges from 0-100, values >70 indicating overbought conditions and <30 indicating oversold ones.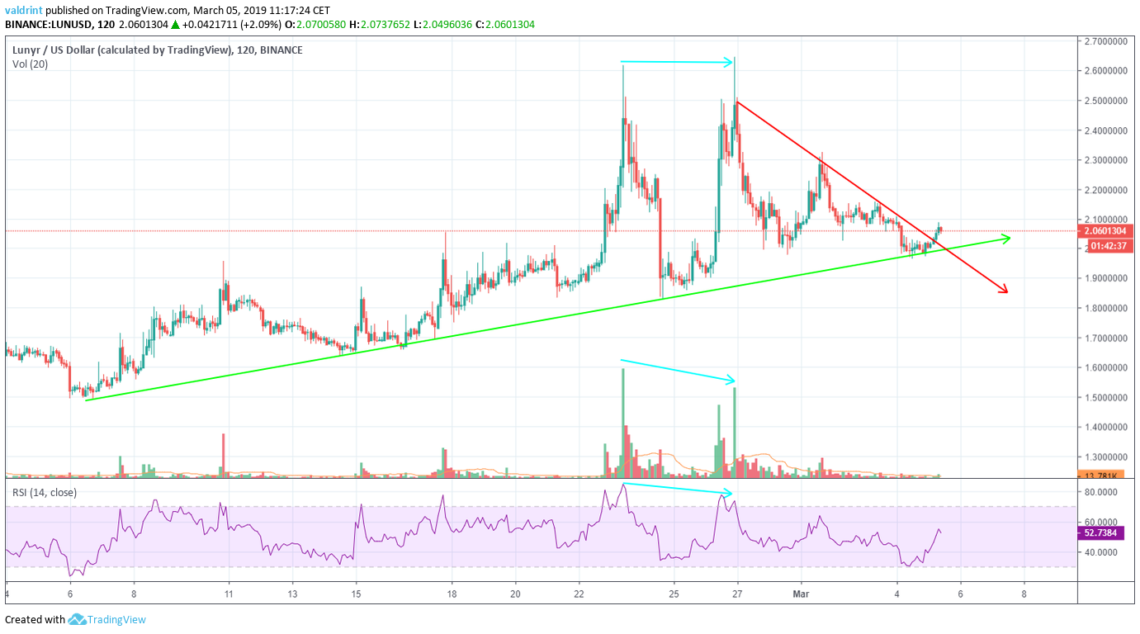 While price reached a high of on both Feb 23 and Feb 26, the RSI did not. The high on Feb 26 had a RSI level of 80, compared to 86 on Feb 23 . This is called a bearish divergence and often precedes drops in price.
Furthermore, the same divergence at the tops occurred in volume. The divergence in volume serves to add further validity to the RSI analysis.
While price reached a high of on both Feb 23 and Feb 26, the RSI did not. The high on Feb 26 had a RSI level of 80, compared to 86 on Feb 23 . This is called a bearish divergence and often precedes drops in price.
Furthermore, the same divergence at the tops occurred in volume. The divergence in volume serves to add further validity to the RSI analysis.
After the Breakout
Resistance and support areas are created when the price reaches a certain level numerous times. Resistance acts as the floor while support acts as the ceiling. Together they form a structure which is supposed to limit the scope of the price movements.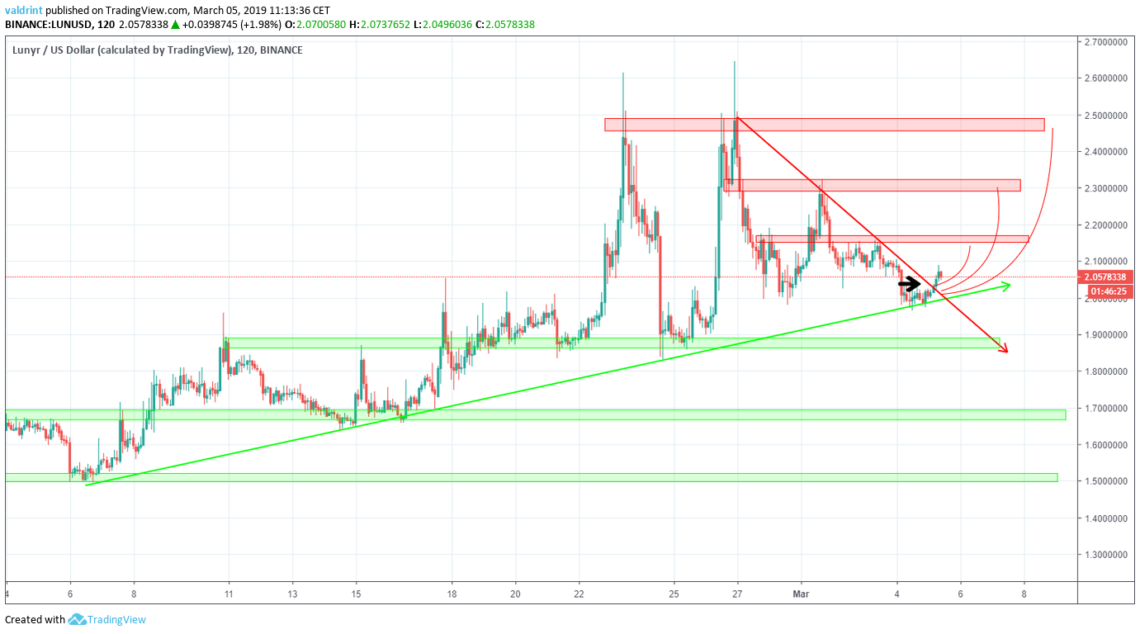 In the image above, we can see that price broke out above the descending resistance line on Mar 5. The areas outlined above (red) can be helpful in predicting where price will come to a stop.
If a breakdown were to occur, the inverse would be true, and we would be using the support areas (green) in the prediction.
In the image above, we can see that price broke out above the descending resistance line on Mar 5. The areas outlined above (red) can be helpful in predicting where price will come to a stop.
If a breakdown were to occur, the inverse would be true, and we would be using the support areas (green) in the prediction.
Final Analysis
Combining RSI bullish/bearish divergence with a support/resistance essentially predicts price fluctuations. Afterward, the support/resistance lines are used to forecast where the price is likely headed. Support and resistance areas are used after the breakout/breakdown materializes in order to predict possible areas where price is likely to come to a stop. In conclusion, LUN may reach the first resistance area near $2.18, before dropping back to the ascending support line. Do you think LUN will break out above the first resistance area? Let us know what you think in the comments below! While you’re at it, check out our long-term Bitcoin (BTC) price prediction! Disclaimer: This article is not trading advice and should not be construed as such. Always consult a trained financial professional before investing in cryptocurrencies, as the market is particularly volatile.
Top crypto projects in the US | April 2024
Trusted
Disclaimer
In line with the Trust Project guidelines, this price analysis article is for informational purposes only and should not be considered financial or investment advice. BeInCrypto is committed to accurate, unbiased reporting, but market conditions are subject to change without notice. Always conduct your own research and consult with a professional before making any financial decisions. Please note that our Terms and Conditions, Privacy Policy, and Disclaimers have been updated.

Valdrin Tahiri
Valdrin discovered cryptocurrencies while he was getting his MSc in Financial Markets from the Barcelona School of Economics. Shortly after graduating, he began writing for several different cryptocurrency related websites as a freelancer before eventually taking on the role of BeInCrypto's Senior Analyst.
(I do not have a discord and will not contact you first there. Beware of scammers)
READ FULL BIO
Sponsored
Sponsored