

The Litecoin price has successfully validated the ₿0.007 level as support and has been moving upwards since. After a short-term retracement, LTC has been increasing since reaching a low on Feb 19.
Litecoin (LTC) Price Highlights
- Support and resistance levels exist at ₿0.007 and ₿0.0095 respectively.
- The weekly RSI is bullish.
- A golden cross has transpired.
- The price is trading inside an ascending channel.
$LTCBTC
— George (@George1Trader) February 24, 2020
Looks ripe. Not in this one since I'm already in ethbtc, but this looks hella bullish imo. Blue next. pic.twitter.com/Hb5SVQ6nP2
Weekly Outlook
The Litecoin price has indeed flipped the ₿0.007 area as support with a strong bullish candlestick last week. This area has been historically significant, most notably in October 2017 and December 2018 when it provided support. The weekly RSI has clearly moved above 50, a sign that the downward trend has ended and LTC wants to move upwards. The next resistance area is found at ₿0.0095.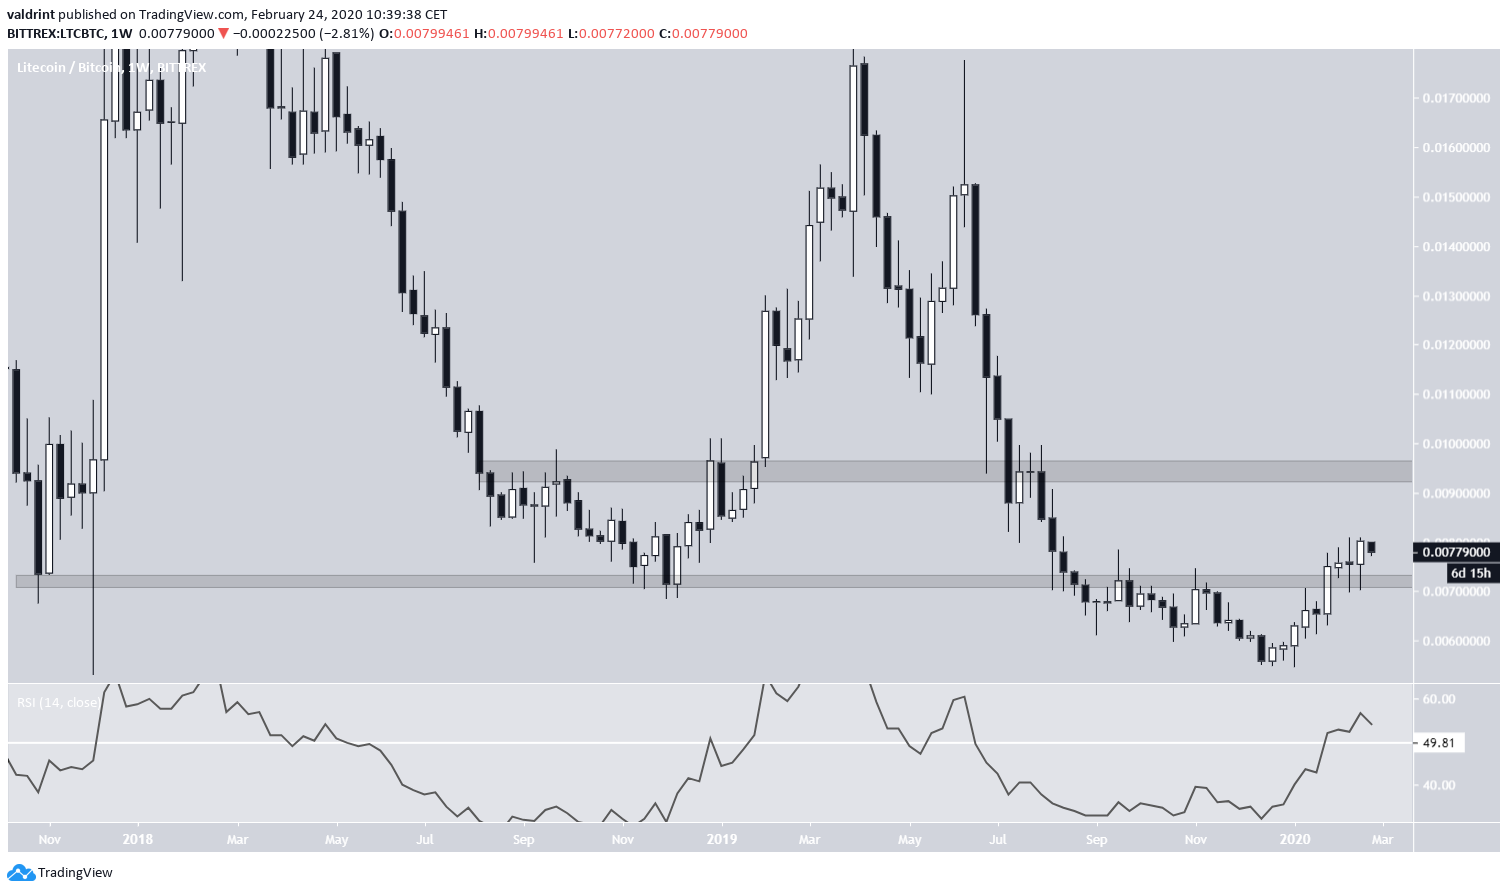
Ascending Channel
The Litecoin price has been trading inside an ascending channel since Feb 8, having validated both the resistance and support lines numerous times. The price touched the support line on Feb 19 for the final time and has been increasing since. A bullish cross between the 50 and 200-day moving averages (MA) transpired on Feb 13 and the price is trading above both these MAs, a sign that it wants to continue moving upwards. However, the possibility remains that LTC creates a double top and decreases instead.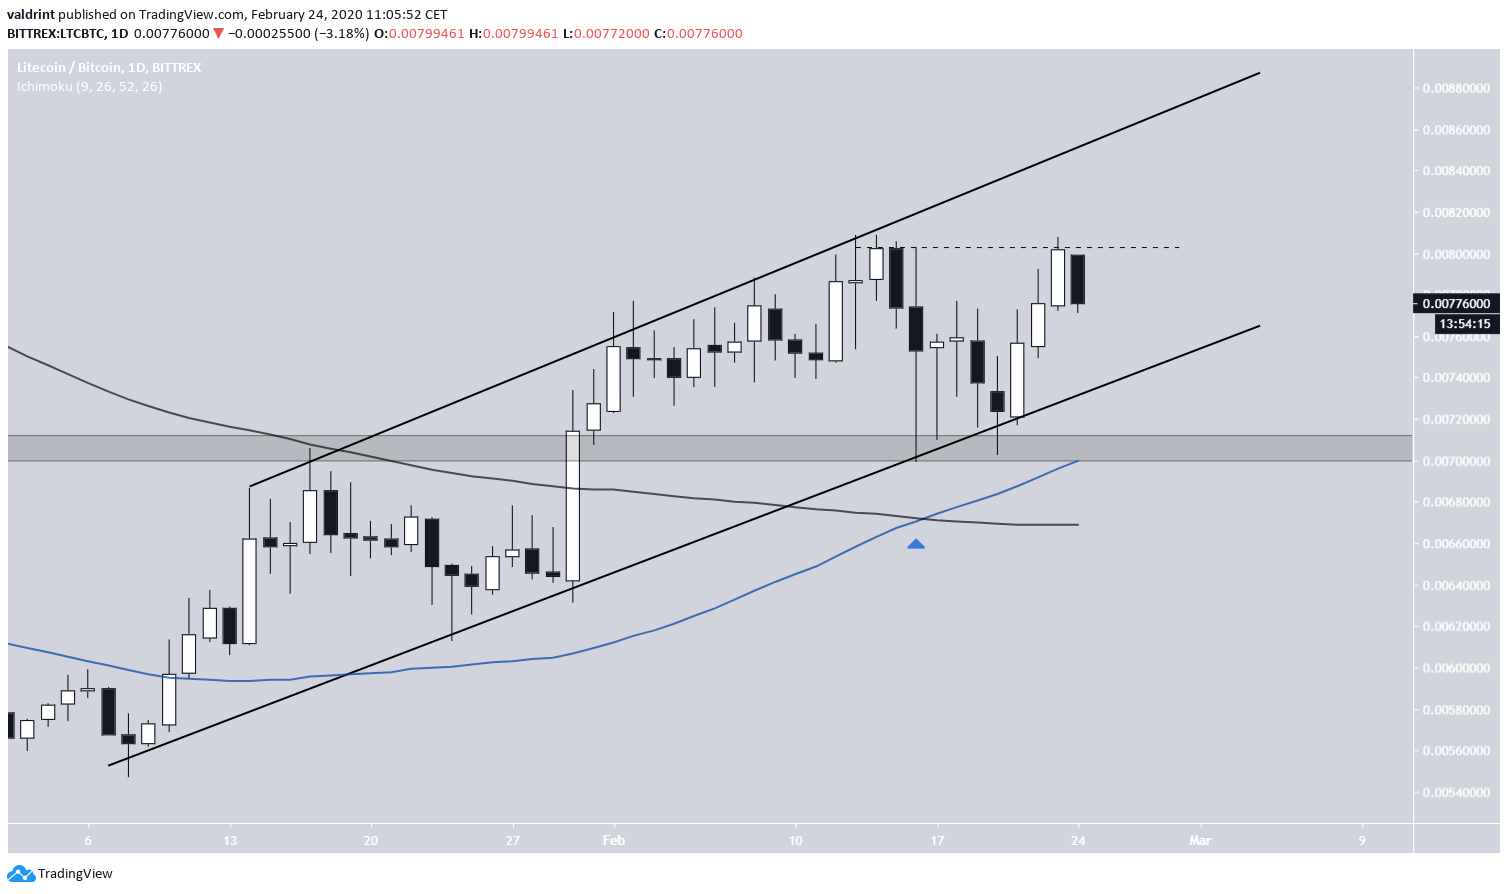
Possible Double Top?
We can see that the RSI shows no bearish divergence whatsoever to indicate a price decrease. Also, the price has flipped the minor ₿0.0075 level as support. After possibly validating it once more, which would also cause the RSI to validate the 50-line, the price is expected to move upwards and reach the resistance line at ₿0.0087. If the price continues to increase at the rate predicted by the channel, it would reach the resistance area of ₿0.0095 outlined in the tweet around March 20.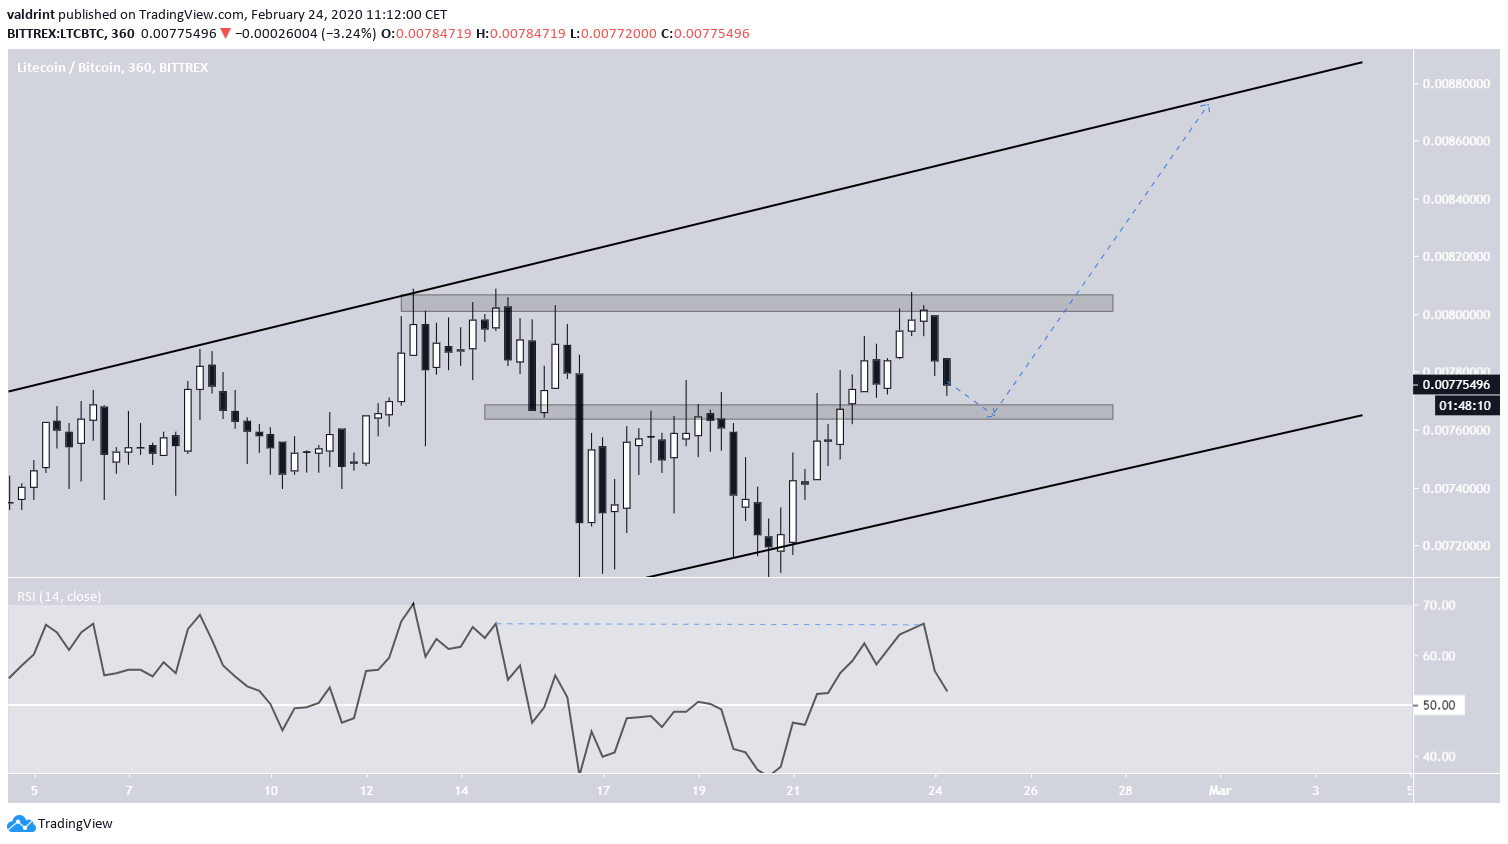 To conclude, the LTC price has been increasing since touching the support line of its channel on Feb 19. The increase will likely continue until the price reaches the resistance line of the same channel.
Top crypto projects in the US | April 2024
Trusted
Disclaimer
In line with the Trust Project guidelines, this price analysis article is for informational purposes only and should not be considered financial or investment advice. BeInCrypto is committed to accurate, unbiased reporting, but market conditions are subject to change without notice. Always conduct your own research and consult with a professional before making any financial decisions. Please note that our Terms and Conditions, Privacy Policy, and Disclaimers have been updated.

Valdrin Tahiri
Valdrin discovered cryptocurrencies while he was getting his MSc in Financial Markets from the Barcelona School of Economics. Shortly after graduating, he began writing for several different cryptocurrency related websites as a freelancer before eventually taking on the role of BeInCrypto's Senior Analyst.
(I do not have a discord and will not contact you first there. Beware of scammers)
READ FULL BIO
Sponsored
Sponsored