
Imagine a multi-lane highway, allowing multiple vehicles to run at once without incessant honking or traffic jams. Well, Zilliqa is this; in blockchain form. In this Zilliqa price prediction piece, we will discuss why this smart contract ecosystem is worth looking at. What makes Zilliqa scalable and differentiates this project from other altchains? We will consider this within a detailed analysis of ZIL — Zilliqa’s native cryptocurrency. Is Zil a worthy investment option? What does the future hold for this coin? Let’s dive right in, starting with the fundamentals.
- Zilliqa price forecast and the role of fundamentals
- Zilliqa price prediction and the tokenomics
- Zilliqa price prediction and other important metrics (2022-23 insights)
- Zilliqa price prediction using technical analysis
- Zilliqa (ZIL) price prediction 2023
- Zilliqa (ZIL) price prediction 2024
- Zilliqa (ZIL) price prediction 2025
- Zilliqa (ZIL) price prediction 2030
- Zilliqa (ZIL’s) long-term price prediction until 2035
- Is the Zilliqa price prediction accurate?
- Frequently asked questions
Want to get ZIL price prediction weekly? Join BeInCrypto Trading Community on Telegram: read ZIL price prediction and technical analysis on the coin, ask and get answers to all your questions from PRO traders! Join now
Zilliqa price forecast and the role of fundamentals
The success of a project, especially price-wise, is closely related to what real-world problem it solves. Zilliqa makes a strong case for itself as one of the few chains to offer an impressively high transaction speed. The focus on throughput and scalability is what makes Zilliqa desirable.
But that’s just scratching the surface. Here are a few additional insights about Zilliqa.
- It is home to many DApps. As of June 2022, Zilliqa hosted over 250 projects.
- The ecosystem supports yield farming and staking.
- The mainnet went live in 2019, meaning Zilliqa has some historical data.
- It claims to be the first chain to be on a completely sharded network. (Remember the highway reference we used earlier).
- Its native token, ZIL, helps execute smart contracts (as fees) and even process transactions.
- It aims to become the go-to chain for enterprise solutions.
- The consensus mechanism is a hybrid of BFT and PoW, making the network even more secure.
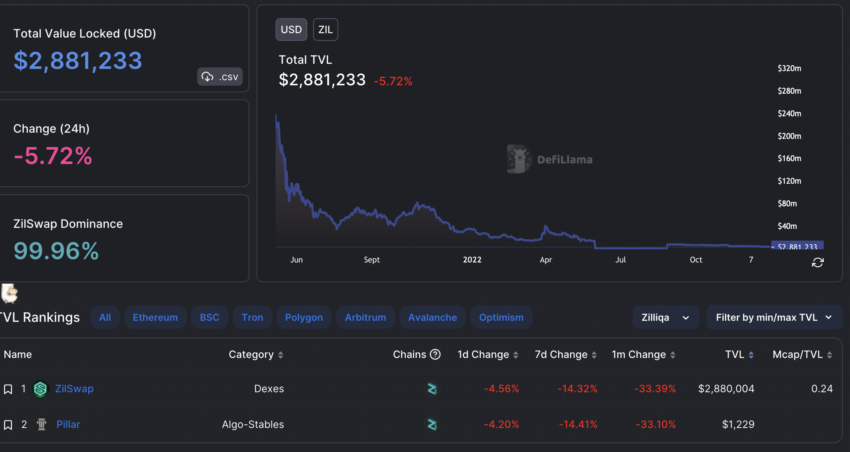
- Zilliqa has a growing DeFi presence led by the ZilSwap DEX. It is ranked 123 in terms of DeFi TVL, as of Feb 2024.
While the fundamentals look fine, blockchains promising scalability are already around. Ethereum’s layer-2 picks lead the charge in this segment, which might slow Zilliqa’s adoption.
Zilliqa price prediction and the tokenomics
Zilliqa’s tokenomics resemble that of a quintessential mineable blockchain, all thanks to the PoW element. The token supply has a 21 billion cap. According to the whitepaper, all tokens should become a part of the circulation by 2029 — 10 years after the mainnet launch. The issuance is fixed. This means the rate at which the ZIL tokens enter circulation remains steady yearly until 100% of the supply enters circulation. The last reported yearly issuance rate was 2%, close to where Cardano is currently.
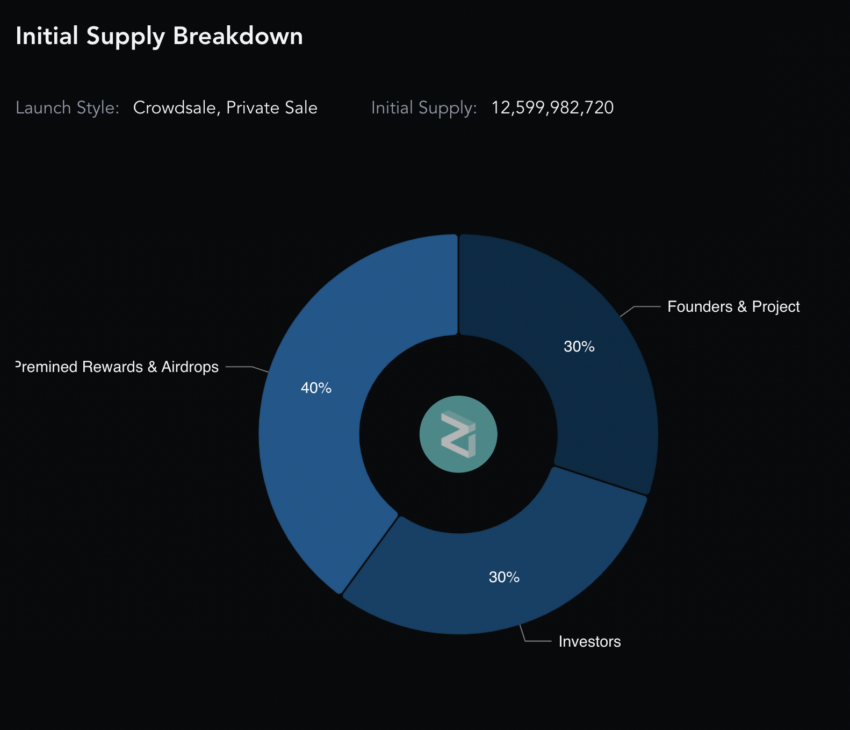
Also, the ZIL coin comes with a utility, helping Zilliqa devs work better with smart contracts and rewarding miners. The only pressing thing here is the distribution aspect.
Did you know? The project and founders hold 30% of the total supply, which might be disconcerting in the event of a market-wide sell-off.
However, there is a three-year vesting period after each unlock event. This works as a failsafe during the bearish phase of the crypto market.
Zilliqa price prediction and other important metrics (2022-23 insights)
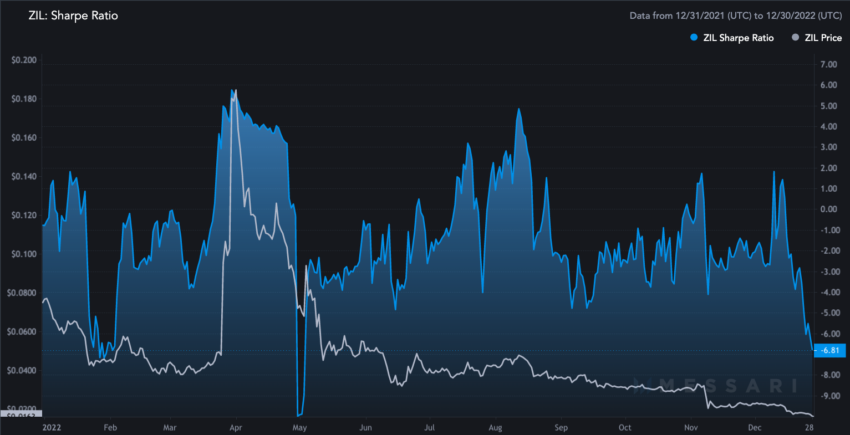
If you are an investor looking to put in those hard yards at Zilliqa’s counter, here is the yearly Sharpe ratio chart to look at as of December 2022. Do note that ZIL’s Sharpe ratio peaked in late March 2022 at over 5.5, which sent prices soaring. Since then, prices have been in a downtrend. This is despite the Sharpe ratio going above four a number of times up until December 2022.
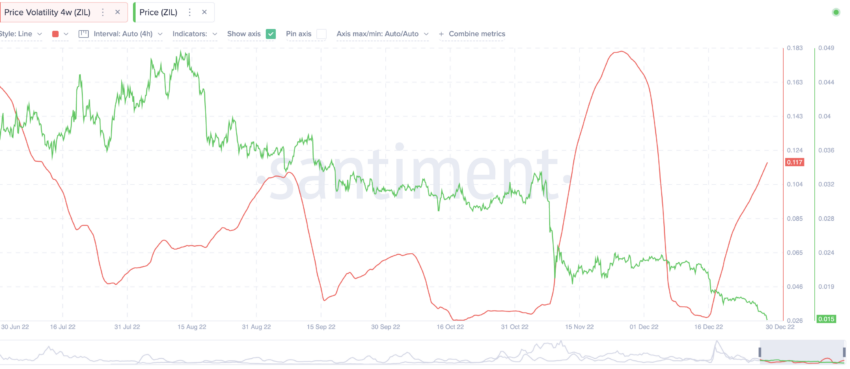
The 4-week volatility at ZIL’s counter in 2022 peaked after Nov. 15, when the prices started dropping. The chart shows that volatility is again in an uptrend. This might not be good for the short-term future price of the ZIL coin. Historically, prices have peaked whenever volatility has dropped.
It is evident that the crypto market needs to become steadier for the short-term Zilliqa price forecast to turn positive.
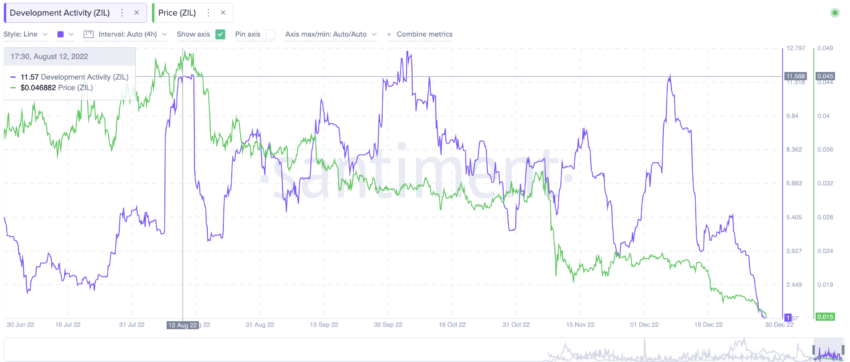
As a smart contract ecosystem, the future of ZIL depends a lot on how the development activity is within the ecosystem. The prices and development activity were seen touching new lows in 2022, but as per historical data, prices usually see an uptrend when development activity peaks. Something similar happened in August 2022 when both development activity and the price of ZIL started scaling upwards.
Zilliqa price prediction using technical analysis
We shall now move to the technical analysis to predict the Zilliqa (ZIL) price moves in the short and long term. Analyzing the charts allows for all-important pattern location. With this, we can formulate a price forecast from data-backed insights.
Here is the raw weekly chart.
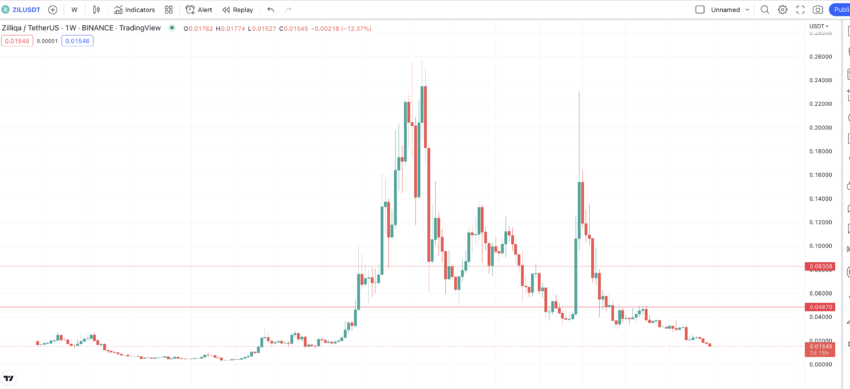
The weekly chart shows a clear pattern. The initial range-bound region of the chart resembles the one made by the current price of ZIL. This shows the crypto price might just be completing a set pattern.
We have marked the start and end of the pattern using circles just to highlight the pattern points. Within the range-bound zones, ZIL makes a high, followed by another high, and then a peak. After reaching the peak, there is a lower high followed by a higher one. We expect this pattern to continue for Zilliqa.
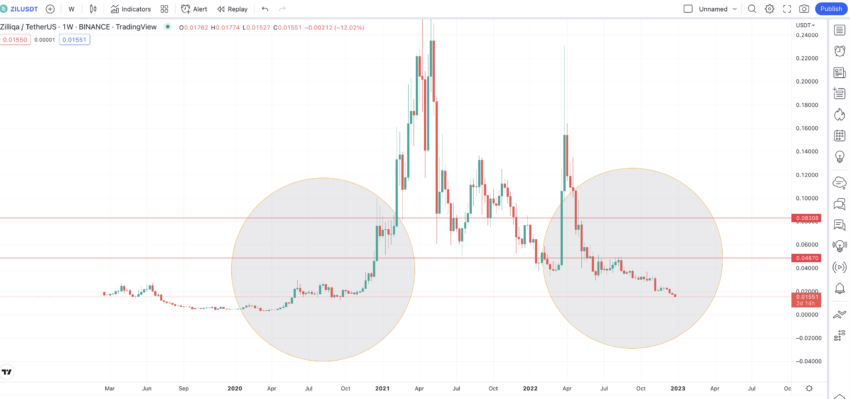
The first circle, when compared with the second circle, shows that the current price of Zilliqa is yet to make a low. The standard rounded bottom formation is visible as part of the early formation. Our task is to locate the next bottom and the subsequent highs to allow for a long-term Zilliqa crypto price forecast.
Price changes
Here is the weekly chart, but with all the points mentioned.
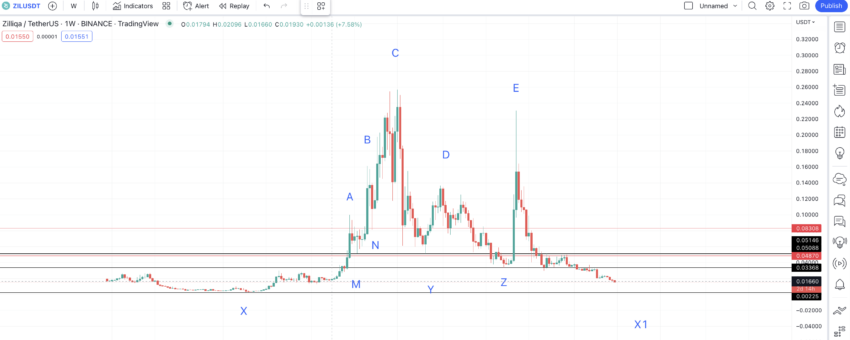
We shall find the distance and price difference between these points to gather data for locating the new points. Our first task is to find the X1. Then we can find the price difference and distance between two adjacent points using the chart above:
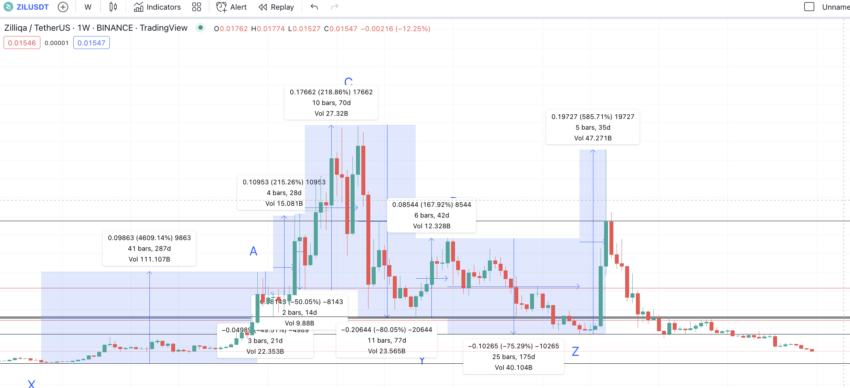
Data set 1 is as follows: X to A = 287 days and 4609.14% price change; A to M = 21 days and -49.51% price change; M to B = 28 days and 215.26% price change; B to N = 14 days and -50.05% price change; N to C = 70 days and 218.86% price change
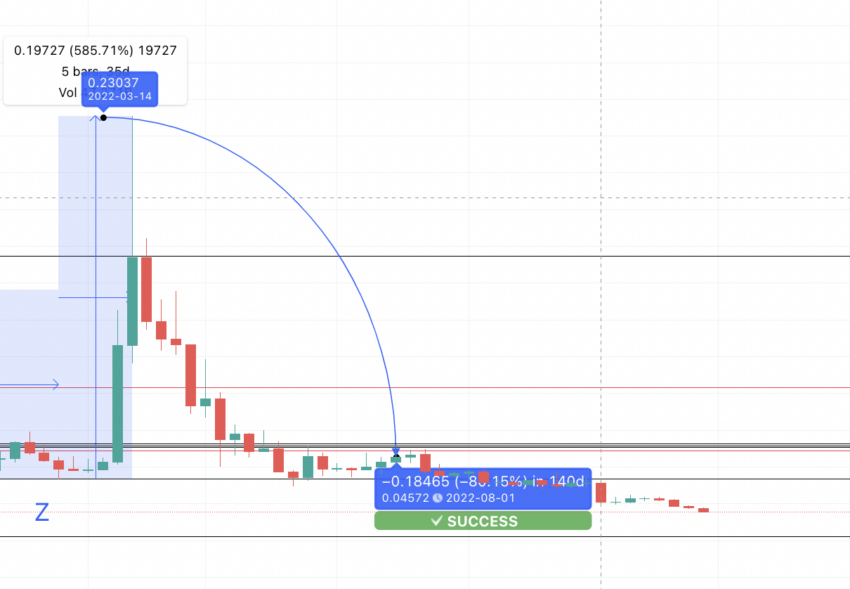
Data set 2 is as follows: C to Y = 77 days and -80.05% price change; Y to D = 42 days and 167.92% price change; D to Z = 175 days and -75.26% price change; Z to E = 35 days and 585.71% price change
Now, if we take the low-to-high and high-to-low averages, we get the following information:
Calculations
The low-to-high average distance and percentage gain is 92 days and 188.41%. We have excluded X to A as the value is incredibly high, and we might not see a move like this anytime soon.
The high-to-low average distance and percentage drop: 72 days and 63.72%.
Therefore, from E, the next point X1 should be in 72 days and 63.72%. As we are in a bear market, the max distance and percentage drop can surface in 175 days and at 80.05%, according to the figures in the data set above.
The forecast line shows that the level is anywhere around $0.0457, a level ZIL broke long back. Therefore, we shall now look for a new low and mark it X1.
If we look at the first part of the chart, the distance from A to X is 287 days, and the price drop is -96.70. Therefore, if the pattern symmetry is concerned, E to Z1 should take nearly the same time. Now, if we draw a line from E, the low surfaces at $0.00730 or the right X1.
Zilliqa (ZIL) price prediction 2023
ZIL successfully reached the prices we predicted for it in 2023. Here is how we went about the analysis:
If we consider the Sharpe ratio and volatility, the Zilliqa price prediction for 2023 doesn’t look bright, at least not to start with. Therefore, the new low — $0.00730 — surfacing in 2023 looks practical. This hints at a quick short-term correction, as per the technical analysis.
Now we have the new low, we can use the low-to-high calculations to locate the next set of points.
Although the average low-to-high distance and % change values are 92 days and 188.41%, the price forecast takes the bear market into consideration. Hence, the max distance can be 287 days, and the minimum peak from the low can be 167.92% — per Table 1 and Table Two.
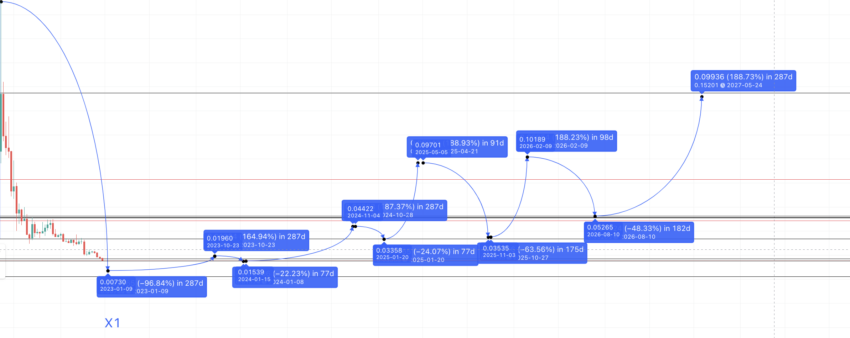
Therefore, the forecast line from X1 puts the high at $0.01934 by the end of 2023. We can mark this A1.

Short-term validation
ZIL is trading inside a falling edge pattern, which might be bullish if it breaks above the upper trendline. Plus, as per the daily chart, the RSI is in a highly oversold region, which might increase prices.
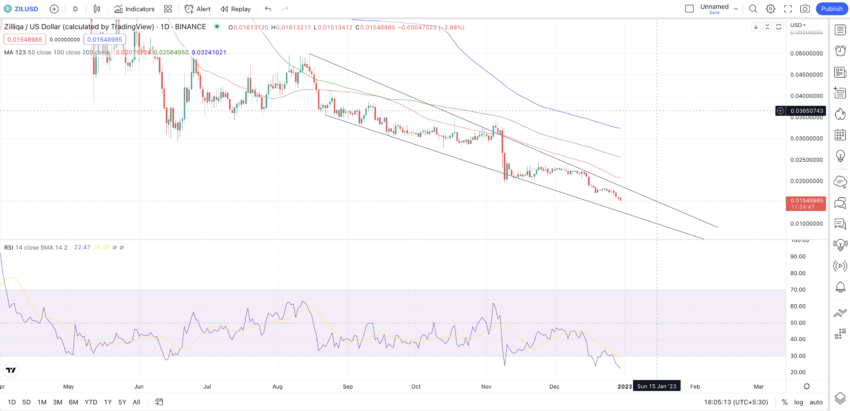
The bearish sign here is the red line (50-day moving average) diverging from the green line (100-day moving average). If the distance keeps increasing, we might see some more correction at ZIL’s counter in the short term.
Zilliqa (ZIL) price prediction 2024
Outlook: Bullish
Now we have A1 or the high in 2023, we can again use the high-to-low data to locate the new low, preferably in 2024. While the average drop could be 72 days and 63.72%, there is strong support at $0.01533 — a level that might show up anytime in early 2024.
The next high (B2) can follow the 92 days and 188.41% average, as inferred by the tables above. Yes, the distance might vary, depending on the current market condition, but the growth percentage can remain the same. The max distance can be 287 days, as per data set 1.
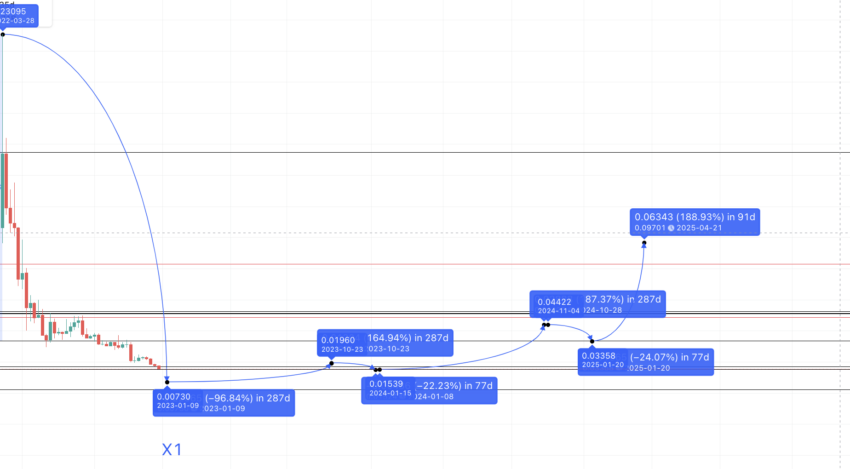
So the high by 2024 end can reach $0.044, which we can mark B1.
Projected ROI from the current level: 63%
Zilliqa (ZIL) price prediction 2025
Outlook: Bullish
From B1, we can trace a new low at N1, using the average of 72 days and 63.72%. While that translates into a drop to $0.01628, there is strong support at $0.03368. This should be the Zilliqa price prediction for 2025, especially when the low is concerned.
The high price prediction for 2025, using the low at $0.03368, surfaces at $0.097.
Projected ROI from the current level: 259%
Zilliqa (ZIL) price prediction 2030
Outlook: Bullish
Post the high of $0.097, preferably in 2025 (mark it as C1); we can locate the new low using the 72 days and 63.72% average, using the tables above. By now, the price of ZIL would have gained steam, and therefore, the new low could be at 175 days (max timeframe) from the high of 2025. This translates to a level of $0.03535 by the end of 2025.
We can again use the 188.41% price hike in 92 days from this level to find the 2026 high. Therefore, by early 2026, the price forecast for ZIL crypto might land at $0.1019. We might mark this D1.
Zilliqa price prediction 2026-27
This is where it gets interesting. Unlike pattern one, D1 is higher than C1, which marks a clear uptrend for Zilliqa. The low in 2026 can show up within 72 days or even 175 days at max, at a drop of 63.72%. However, there is strong support at $0.05260, which might be the low for 2026.
The next high could be in 287 days and at a high of 188.42%. By this time in 2026, peaking to new highs might take ZIL some time due to growing competition from Ethereum’s sharding.
This marks the 2027 high, which might surface at $0.1520. We can mark this point as E1.
Now we have a low in 2026 and a high in 2027, we can connect the points using the Fib indicator and push the price forecast of ZIL crypto to 2030. Using the same growth slope that Zilliqa has been following previously, we can trace the price of Zilliqa to $0.500 by 2030. Do note that this will be the new all-time high for ZIL.
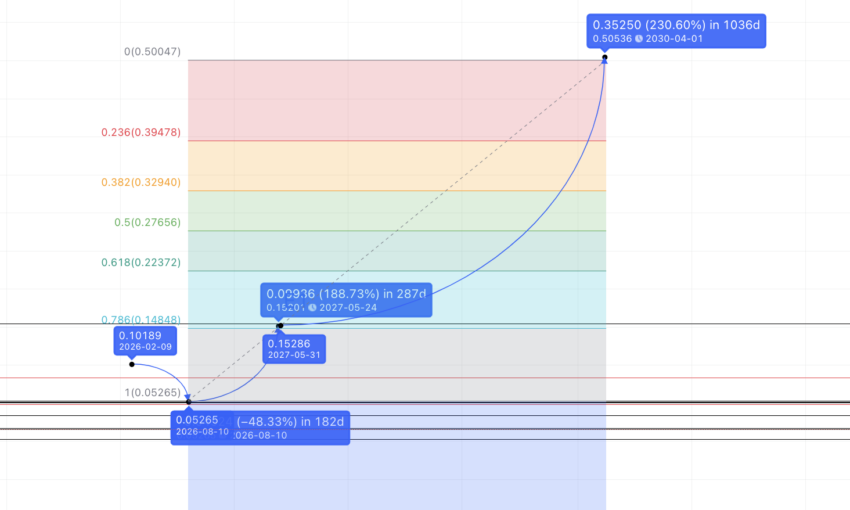
Projected ROI from the current level: 1751%
Zilliqa (ZIL’s) long-term price prediction until 2035
Outlook: Bullish
By now, we have all the crucial levels as per the Zilliqa price forecast and related calculations. However, with ZIL reaching a new all-time high by 2030, there might be different price action in the future. Therefore, we have prepared the below data to help map a price forecast of the ZIL crypto till 2035.
You can easily convert your ZIL to USD
| Year | Maximum price of ZIL | Minimum price of ZIL |
| 2024 | $0.044 | $0.01533 |
| 2025 | $0.097 | $0.03368 |
| 2026 | $0.1019 | $0.05260 |
| 2027 | $0.1520 | $0.1185 |
| 2028 | $0.2052 | $0.1600.56 |
| 2029 | $0.3078 | $0.2400.84 |
| 2030 | $0.500 | $0.39 |
| 2031 | $0.625 | $0.4875 |
| 2032 | $0.9375 | $0.7312 |
| 2033 | $1.40 | $1.092 |
| 2034 | $1.89 | $1.47 |
| 2035 | $2.46 | $1.92 |
Is the Zilliqa price prediction accurate?
Unlike many other Zilliqa price prediction pieces, this model considers fundamentals, network growth, and even tokenomics. The technical analysis is data-rich and considers long-term and short-term chart patterns. All these factors make the price forecast model for Zilliqa relatable, practical, and in sync with the dynamic conditions of the crypto market.
Frequently asked questions
Is ZIL a good investment 2024?
Can Zilliqa reach $10?
Should I invest in ZIL coin?
Is ZIL a stablecoin?
What is ZIL all time high?
Disclaimer
In line with the Trust Project guidelines, the educational content on this website is offered in good faith and for general information purposes only. BeInCrypto prioritizes providing high-quality information, taking the time to research and create informative content for readers. While partners may reward the company with commissions for placements in articles, these commissions do not influence the unbiased, honest, and helpful content creation process. Any action taken by the reader based on this information is strictly at their own risk. Please note that our Terms and Conditions, Privacy Policy, and Disclaimers have been updated.