

SAND, the native token of The Sandbox ecosystem, went as high as $0.91 in 2023, aligning with our 2023 SAND price prediction levels. It was evident that the market-wide crypto rallies acted as harbingers of hope for SAND, or maybe the entire metaverse segment, for that matter. And the meteoric rise in 2023 means that a SAND price prediction for 2024 is in order. Is this an indication of a future stratospheric price for SAND? We investigate using technical analysis, fundamentals, and even on-chain metrics.
Want to get SAND price prediction weekly? Join BeInCrypto Trading Community on Telegram: read SAND price prediction and technical analysis on the coin, ask and get answers to all your questions from PRO traders! Join now
- The role of fundamental analysis and the Sandbox price forecast
- SAND price prediction and tokenomics
- The Sandbox price forecast and other key metrics
- SAND price prediction and technical analysis
- The Sandbox (SAND) price prediction 2023
- The Sandbox (SAND) price prediction 2024
- The Sandbox (SAND) price prediction 2025
- The Sandbox (SAND) price prediction 2030
- The Sandbox (SAND’s) long-term price prediction (up to 2035)
- Is the SAND price prediction model accurate?
- Frequently asked questions
This article may be outdated, we suggest you visit our new Sandbox Price Prediction tool.
The role of fundamental analysis and the Sandbox price forecast
What is The Sandbox? The ecosystem presents itself as a gaming platform with decentralization at its core. But that’s not where the feature list ends. The in-game assets relevant to this gaming platform can also be traded and monetized. This functionality helps content creators build new products on The Sandbox ecosystem — which is open for monetization and trading.
The Sandbox allows users to trade in LAND — NFT-like real estate with ERC-721 as the token standard and other digital collectibles. The Sandbox will likely tick your boxes if you are into user-generated content, especially in the digital realm.
Did you know? In Q2 2023, The Sandbox reported a 59% surge QoQ in the number of NFT mints. Even the NFT sales grew by 52% QoQ.
Here are some additional insights to learn more about The Sandbox fundamentally:
- SAND, the utility token, is meant for facilitating in-ecosystem transactions.
- The Sandbox thrives by combining the functionality of NFTs and DAOs (Decentralized Autonomous Organizations).
- This Ethereum-based play-to-earn model is directly correlated to the performance of other web3 gaming projects.
On top of that, The Sandbox has an elite lineup of organizational investors, including Coinbase Venture and Binance Labs.

SAND price prediction and tokenomics
An ERC-20 token, SAND comes with a slew of use cases. These include earning, trading, governance, playing, and standard trading. Coming to the token economics model, there is a capped supply of 3 billion tokens. At present, 70.62% of the total supply is the circulating supply.
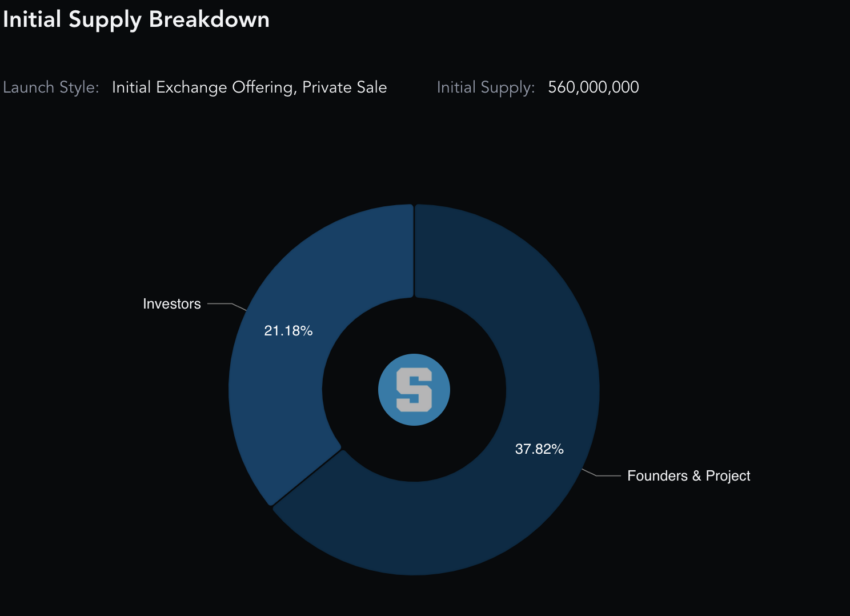
Regarding the distribution, the team members and founders, including Sebastien Borget and Arthur Madrid, manage 31% of the total supply. Also, per the initial supply model, where 560 million SAND tokens were opened, 21.18% went to retail investors.
The only issue here is that the top 100 SAND holders manage 93.32% of the circulating supply, which is quite a lot. However, this figure was January-specific, and if we now pull out the SAND analytics, it is clear that SAND whales only manage 76.37% of the total supply.
“The future of collaboration is the Metaverse”
Dave Waters, CEO of NVIDIA Omniverse: X
Additionally, the holding percentage is the highest, which shows that people aren’t selling and dumping their SAND tokens.
The Sandbox price forecast and other key metrics
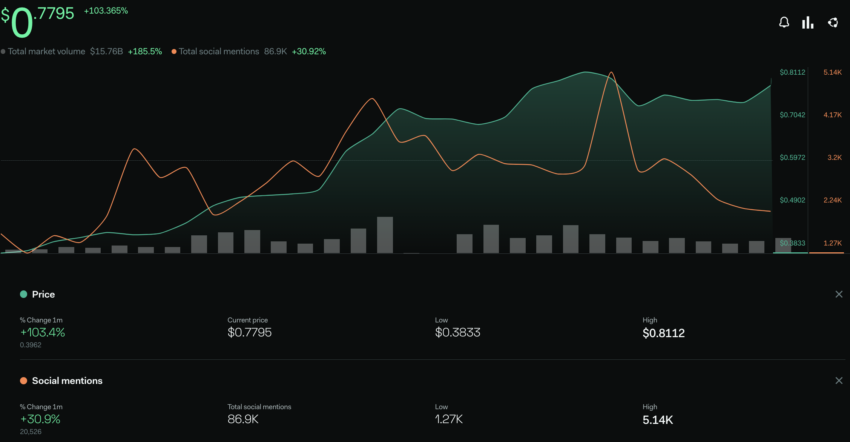
As a metaverse token, the price move of SAND relies a lot on social chatter. The below chart shows the number of social mentions surged by almost 31% over the past month, in January 2023. The price of SAND tokens responded positively, up by 103.33% at press time.
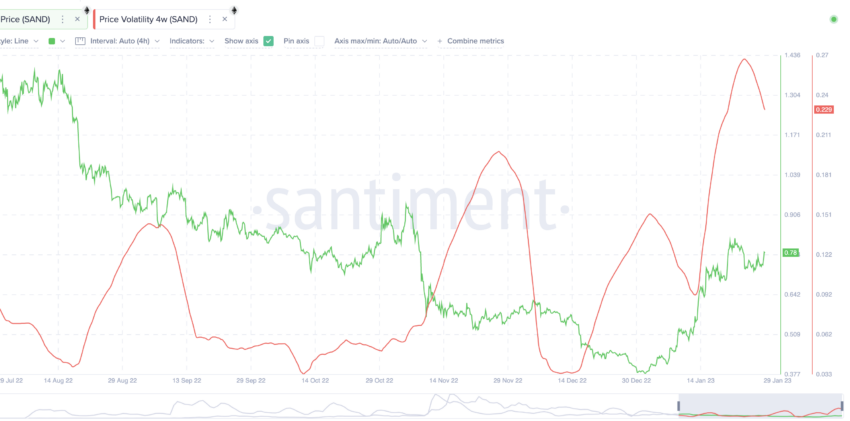
As an investor, the next chart didn’t look all that optimistic. The 4-week volatility in January 2023 was on its way up, and so were the prices. And the historical data reveals that every time the volatility has peaked, the prices of SAND have corrected. The prices of SAND did correct a bit before moving towards the new 2023 high.
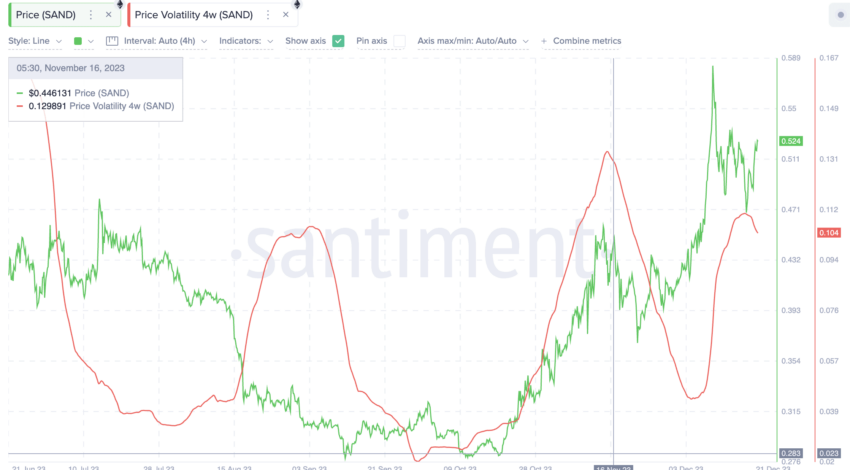
If you look at the current volatility metric — December 2023 — a lower high is on its way, showcasing the price strengthening at The Sandbox’s counter. If the volatility keeps dropping from this level, we can expect SAND prices to surge in the short term.
The number of active addresses since July 2022 has been steady, barring a peak in late November. However, the peak saw the prices go down, showing that a price surge might also mean increased selling pressure.
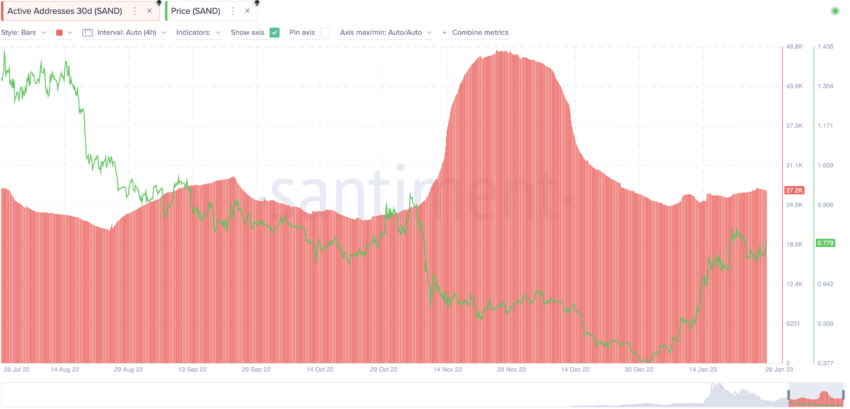
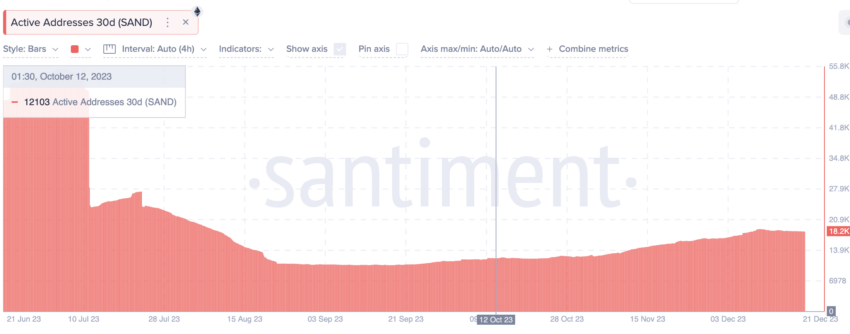
Therefore, if you look for a dip in the number of active addresses for SAND, you might be able to gauge a small upward move. Also, if you track the present active address chart, you will notice that since July 2023, the metric has almost flatlined, showing people are not transacting a lot using SAND and much rather, holding the same.
SAND price prediction and technical analysis
Before we look at the weekly chart to analyze the broad market patterns of SAND, here is a quick short-term analysis to help you gauge the direction SAND might take in the coming weeks.
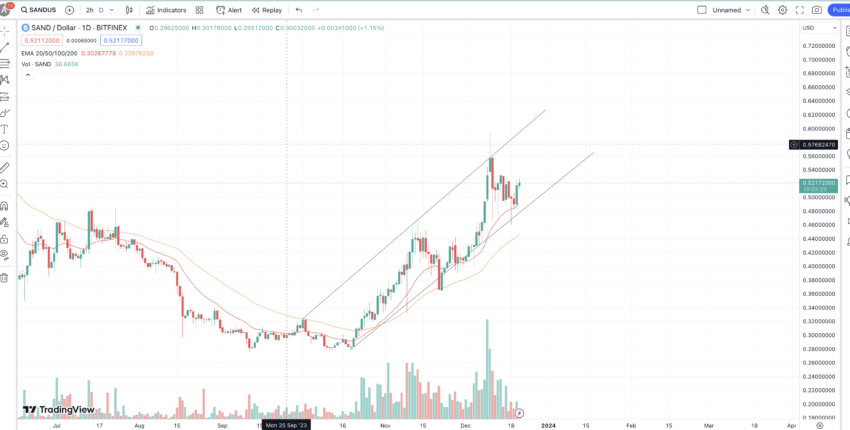
Our December 2023 analysis
Looking closely at SAND’s daily chart, you will notice an ascending channel pattern forming. Based on the dropping volumes, this might lead to a short-term correction with the 20-EMA (red line) acting as a support. However, a breach above the upper trendline and $0.60 can invalidate the bearish trend. For now, the focus should be on tracing the volume to the price.
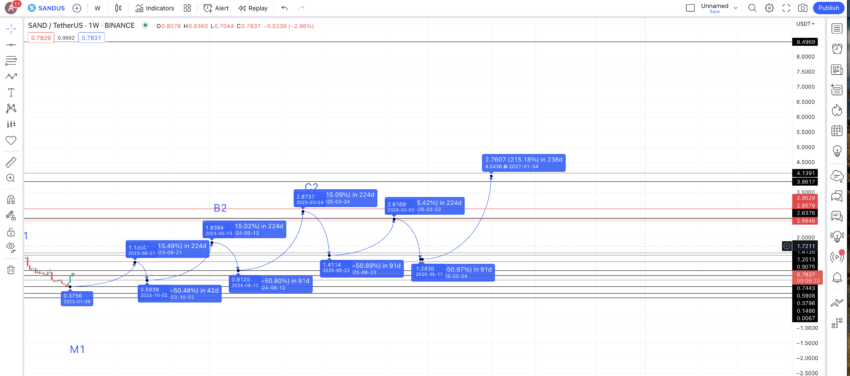
To kick off the technical analysis, here is a weekly chart for your reference:
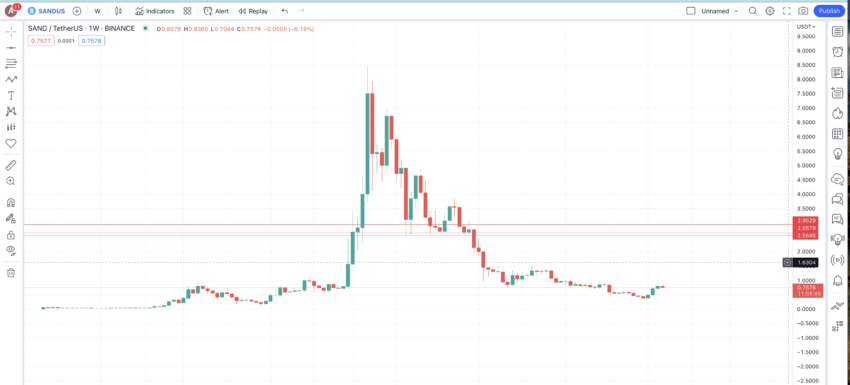
A clear pattern emerges, with the peak acting as a mirror with two symmetrical sides. Notice how the price of SAND started trading in a range, making a series of two higher highs on their way to the peak.
Things change from the peak. SAND starts making lower highs, four of them, to finally move toward pattern completion. Let us mark all the relevant points that might help us with the calculations.
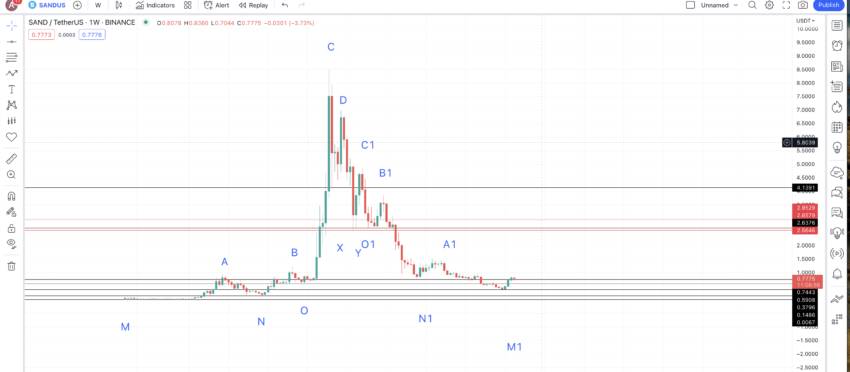
Notice that if another high comes to fruition post-A1, we can mark it as A2. That might even start a new pattern, similar to the left side of the chart, rife with higher highs — marking an uptrend.
Our next task is to locate the next high after M1. That could be the new A or A2 and mark the beginning of a strong trend for SAND tokens.
Price changes
As we expect a new pattern to surface after the price of SAND moves from M1 to A2 (not marked yet), we will need data for it. We can locate the price changes for two paths, M to C and M1 to C, to find the values to work with.
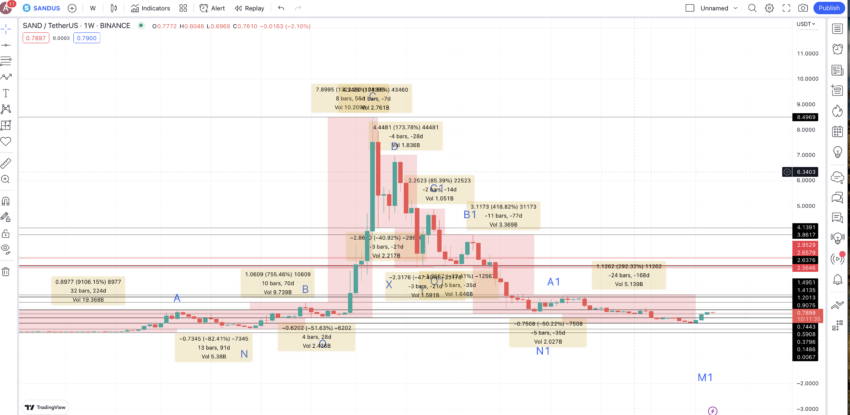
Let us find the distance and price changes between the lows and the highs:
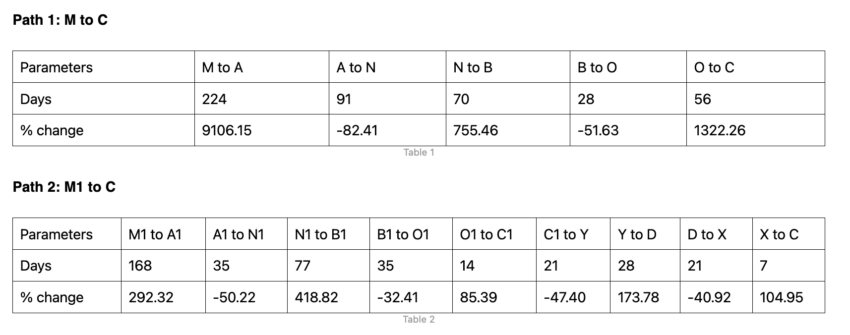
Let us locate the low-to-high and high-to-low averages to further our findings. Using the columns with negative values gives us the high-to-low average. It comes out as 50.83% and 39 days. Using the columns with non-negative values gives us the low-to-high average. It comes out as 215.05% and 81 days. Notice that we didn’t take the exceedingly high positive values like 9106.15% from Table 1 as in the current scenario; we do not expect those levels to hold.
The Sandbox (SAND) price prediction 2023
We predicted a high of $1.18 in 2023 and SAND responded by going as high as $0.912. We should take this as a win, as the gaming and metaverse token space didn’t have the best 2023. Here is how we approached the 2023 SAND price prediction.
From the last low — the M1 — we can expect SAND tokens to chart the path till A2. And the level here can be the average price hike of 215.05%. The timing, depending on the market conditions, can vary. The maximum timeframe for the price of SAND to reach the next high is 224 days, according to Table 1.
This level surfaces at $1.1850, somewhere in August 2023. The next low from this high or A2 could also follow the average high-to-low move of 50.83% over the next 39 days — per data from the above segment.
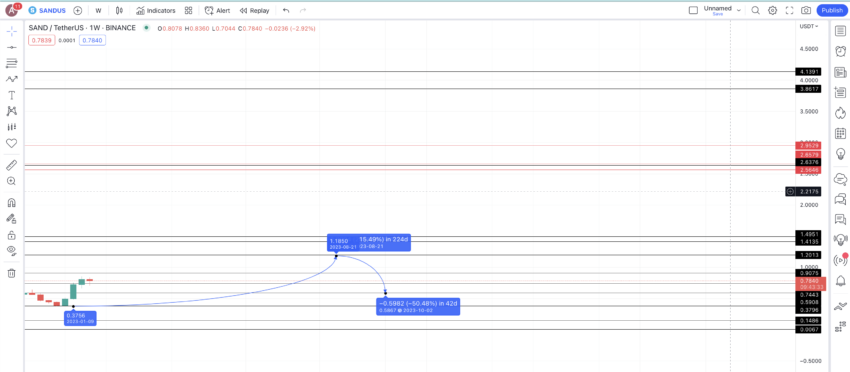
This level surfaces at $0.5867, which can be considered the minimum price of SAND in 2023. To reiterate, The Sandbox price prediction for 2023 comprises the projected high and low of $1.1850 and $0.5867, respectively. Also, SAND reached a lot of $0.28 in 2023, as many buyers offloaded their holdings.
The Sandbox (SAND) price prediction 2024
As the 2023 projections were almost successfully reached, we can proceed with the same analysis and trace the future path.
Now that we have the high and low price of SAND for 2023, we can use the low and chart the next possible high for 2024. The level, using the average of 215.05%, surfaces at $1.839. This can be the maximum price of SAND in 2024, as per standard market conditions. However, SAND will first need to breach the $1.185 mark — projected high in 2023, to be able to reach $1.8. Therefore, in 2024, the high could be anywhere between $1.18 and $1.8.
The low in 2024 can take more than the average of 39 days to surface, as by mid-2024, we expect SAND to show some more bullishness than at the current levels. The max drop distance can, therefore be 91 days, from table 1. Therefore, the low in 2024 surfaces at $0.9049. Also, as SAND is still trading at $0.52, we can expect the $0.50 mark to be the low for 2024.
Projected ROI from the current level: 246% max
The Sandbox (SAND) price prediction 2025
Outlook: Bullish
Notice that this level coincides with SAND’s strong support at $0.9075 — showing our calculations hold weight. Using the projected 2024 low and extrapolating the path by 215.05%, we can locate the next high or the maximum price of SAND in 2025. This figure might surface at $2.87.
We can mark this level as C2, which shows that we might have reached the peak of the next pattern.
Projected ROI from the current level: 451%
The Sandbox (SAND) price prediction 2030
Outlook: Bullish
At C2, we expect SAND to peak for the existing pattern. Also, if historical data is to be believed, there might be a few lower high formations post the 2025 peak. The drop in 2025 can still follow the average dip of 50.83%. This way, the low in 2025 can surface at $1.41.
From this level, we can expect the price of SAND to follow the minimum price hike of 85.39% — from Table 2 — as opposed to 215.05%. This would place the next level or D1 at $2.6169 as the 2026 high.
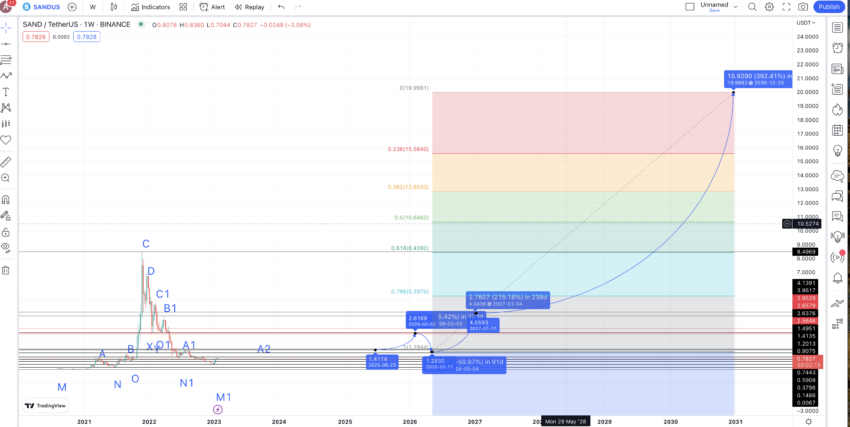
The 2026 low could surface at $1.280, using the average dip. Also, notice that the 2026 high is close to an important resistance level of $2.65. And blockchain gaming and metaverse adoption might trigger a mid-pattern uptrend for 2026 from the lows of 2026.
Therefore, by 2027 we can again expect SAND to move up as per the average hike of 215.05%. This puts the 2027 high at $4.06 — slightly shy of $4.13 — another crucial resistance level.
With the 2026 low and 2027 high, we can draw the Fib levels, extrapolating the path of SAND till 2030. While the path to 2030 might be a bit far-reaching, the same growth trajectory places the price of SAND at close to $19.98 by 2030.
Projected ROI from the current level: 3742%
The Sandbox (SAND’s) long-term price prediction (up to 2035)
Outlook: Bullish
Now that we have the Sandbox price prediction till 2030, here is a table to help you trace the price of SAND till 2035.
You can easily convert your SAND to USD here
| Year | | Maximum price of SAND | | Minimum price of SAND |
| 2023 | $0.91 | $0.28 |
| 2024 | $1.185 to $1.8 | $0.50 to $0.9049 |
| 2025 | $2.87 | $1.41 |
| 2026 | $2.6169 | $1.280 |
| 2027 | $4.06 | $3.166 |
| 2028 | $6.70 | $5.22 |
| 2029 | $14.06 | $8.72 |
| 2030 | $19.98 | $12.38 |
| 2031 | $24.975 | $19.48 |
| 2032 | $37.46 | $23.22 |
| 2033 | $44.95 | $35.06 |
| 2034 | $53.94 | $42.07 |
| 2035 | $62.03 | $48.38 |
Is the SAND price prediction model accurate?
With user-generated contact and in-game assets growing in popularity, we expect metaverse tokens like SAND to remain in focus for at least the next few years. This SAND price prediction model captures that sentiment using a balance of fundamentals and technicals to project the future price of SAND. Moreover, our technical analysis is thorough and data-backed. This makes this long-term Sandbox price projection both realistic and attainable.
Frequently asked questions
Is SAND coin a good investment?
What will The Sandbox be worth in 2030?
How high will The Sandbox go?
Is SAND a Stablecoin?
Who is behind the SAND Coin?
Is SAND coin limited in supply?
Disclaimer
In line with the Trust Project guidelines, the educational content on this website is offered in good faith and for general information purposes only. BeInCrypto prioritizes providing high-quality information, taking the time to research and create informative content for readers. While partners may reward the company with commissions for placements in articles, these commissions do not influence the unbiased, honest, and helpful content creation process. Any action taken by the reader based on this information is strictly at their own risk. Please note that our Terms and Conditions, Privacy Policy, and Disclaimers have been updated.