An open protocol to provide liquidity across blockchains, Ren (REN), is a long-term position worth considering. But is buying REN a smart move? We’ve put together this REN price prediction with traders and investors in mind.
Unlike random price projections, this price prediction doesn’t only rely on technical analysis. Instead, this price forecast considers REN’s tokenomics, the Ren ecosystem’s fundamentals, social growth, financial metrics, and trading activity. Let’s take a look at how all of that works in unison.
- REN price prediction: fundamental analysis
- REN protocol’s financials
- REN tokenomics
- REN’s trading markets
- REN price forecast based on sentimental drivers
- REN price prediction and social presence
- REN price prediction using technical analysis
- REN price prediction 2024
- REN price prediction 2025
- REN price prediction 2030
- REN long-term price prediction until 2035
- How accurate is the REN price prediction?
- Frequently asked questions
Want to get REN price prediction weekly? Join BeInCrypto Trading Community on Telegram: read REN price prediction and technical analysis on the coin, ask and get answers to all your questions from PRO traders! Join now
REN price prediction: fundamental analysis
Ren, previously known as the Republic Protocol, aims to make DeFi omnipresent. The Ren ecosystem follows a multi-chain approach, helping users navigate DeFi with a focus on interoperability. The entire network is the RenVM, and the native token REN incentivizes users and network nodes (darknodes) and pays for network usage fees.
With DeFi expanding and users appreciating the concept of “one blockchain for all,” Ren’s future as a multi-chain DeFi facilitator looks promising. Here are the fundamental insights relevant to Ren:
- Works with multiple DApps
- Has RenVM as the core product and the mainnet
- Uses the REN token to pay for the network fee
- Founder Taiyang Zhang has years of crypto experience.
- Ren came into existence in 2017 — meaning it’s been operating for more than five years
- Has darknodes for network management
- Currently supports 11 chains and 30 assets
- Wrapped assets are backed 1:1 by an underlying asset.
- Node management requires 100,000 REN tokens
- Only 10,000 darknodes are possible, as per the fixed supply metric.
- Had Alameda ties and therefore restricted funding that only holds till Q4 2022.
- Ren protocol is seeing a growth in smart-contract-backed transactions, which could mean an increased focus on building.
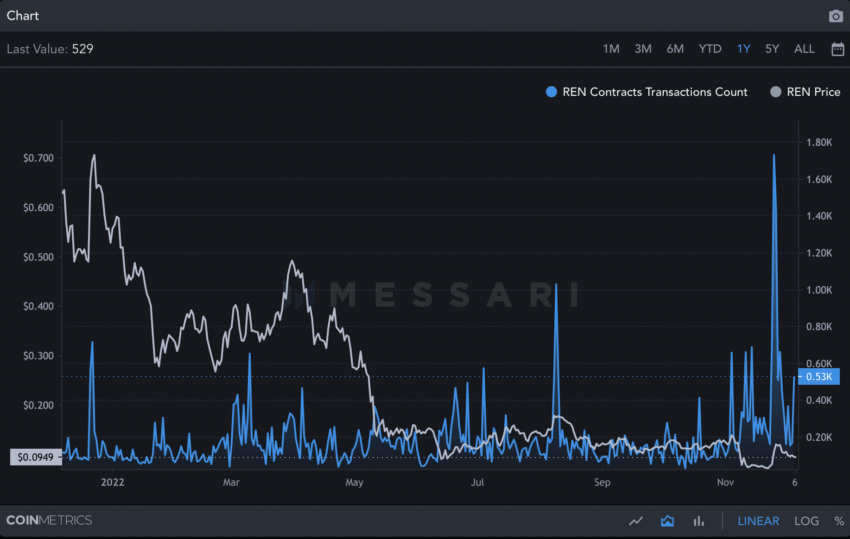
While the idea and vision look promising, two factors work as immediate hurdles. The first is Ren’s Alameda exposure. The second is the limited number of nodes, which may restrict the extent of decentralization if the network grows considerably. However, growing smart contract usage is a strong positive.
We will consider the fundamentals while discussing REN price prediction 2024 and 2025 models.
REN protocol’s financials
Ren is open-source and advocates for DeFi interoperability. Yet, it currently doesn’t have the best financials. As of Dec. 2, 2022, the treasury value stands at a meager $160,000. However, Ren seems to have some aces up its sleeve to combat its Alameda exposure.
What’s next for the Ren protocol:
- Ren 1.0 will close down, and we will see Ren 2.0, possibly by Dec. 18, 2022.
- Liquidity pools holding Ren-backed assets might be impacted.
- We might see REN token burning and a shrinking supply.
- We might see the Ren DAO expand in size.
- Lately, there has been a surge in the burn rate of renBTC. Liquidity providers are trying to free collateral and get hold of BTCs before Dec. 18, 2022.
- Crowdfunding via RFC (revenue-based fundraising mechanism) could be an option for Ren going forward.
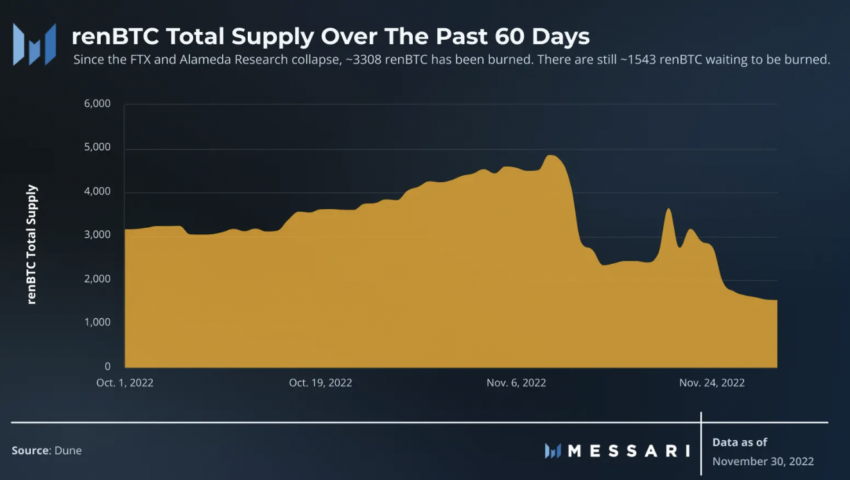
Do note that Ren 2.0 was always in the works. The FTX contagion only expedited the transition.
The REN price prediction model for the short term doesn’t look convincing. We must wait out the Ren 2.0 launch before any concrete price action can be determined.
REN tokenomics
Ren has a max supply of 1 billion; 100% of the total supply is in circulation if we consider a few burned tokens. Therefore, if Ren manages to survive the current FTX contagion, its scarcity may become notable, especially with token burning.
The issuance rate has flatlined, making Ren a decent crypto regarding demand-supply relevance. It is ranked 178 globally.
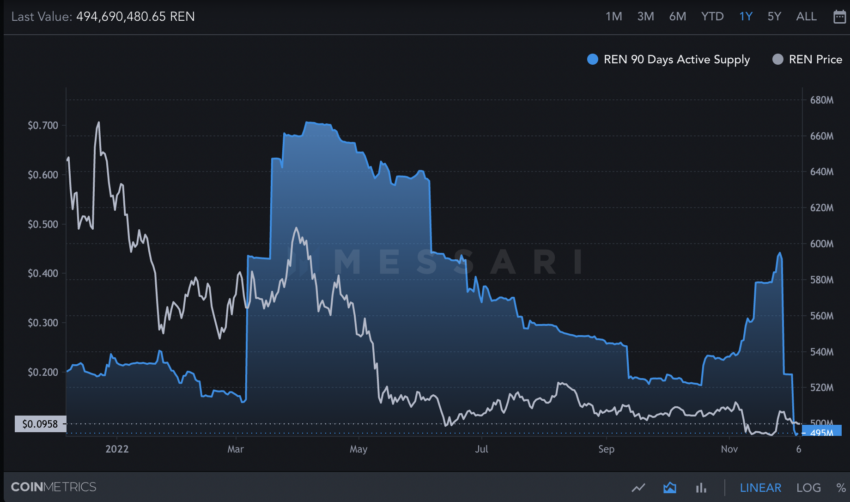
However, regarding price forecast, the focus here should be on the active supply. Do note that a reduced active supply can impact prices negatively as they show reduced network interest.
Here is how the 90-day supply of REN correlates with the prices (December 2022 chart)
Another interesting supply-specific development is related to REN whales. Supply in the top 1% REN addresses has remained constant over the past year, even when prices have gone down. This shows that REN whales do not offload even when the prices dip.
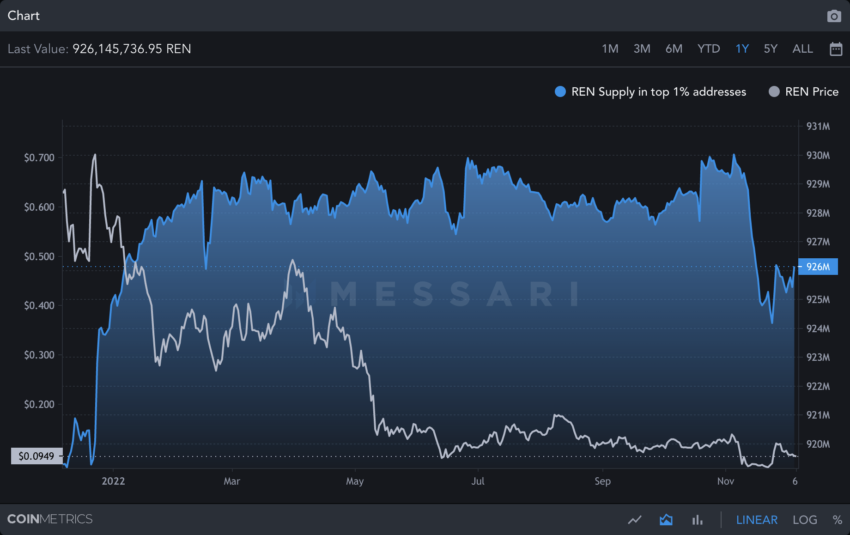
The top 100 REN holders own 82.69% of the total supply, as of December 2022.

Also, unique addresses holding REN have grown in November compared to October. Despite the FTX collapse, Ren protocol looks strong as a project.
Whale concentration of REN holdings can become an issue as the token is exposed to a market-wide sell-off. To grow from here, REN needs to increase its monthly active supply.
REN’s trading markets
If you are an active REN trader, this 2022-specific table will be of interest:
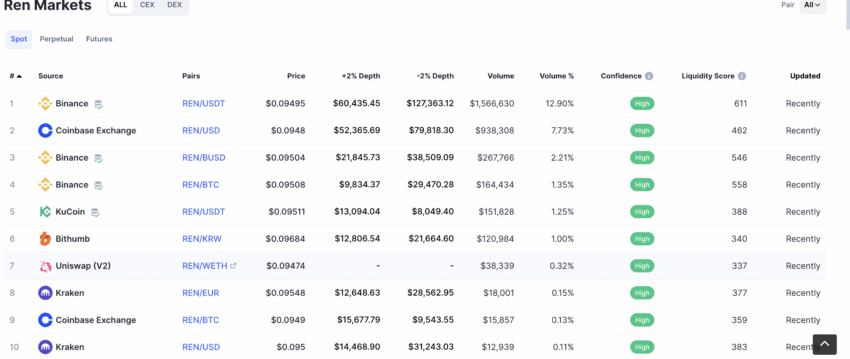
Do note that most exchanges have decent REN liquidity despite the fact that Ren 1.0 will shut down by Dec. 18, 2022. This indicates a widespread belief that REN will remain a valuable crypto. As expected, REN-USDT is the most happening pair, comprising 12.90% of the entire REN market as of 2022.
Even in February 2024, the most popular exchanges have REN listed.
Did you know? Coinbase Exchange delisted REN in November 3, 2023.
REN price forecast based on sentimental drivers
REN’s token summary also leads to several sentimental drivers. 89% of REN token holders have unrealized losses to account for as of 2022 end. This shows that new buyers have emerged, and there aren’t a lot of long-term holders — meaning 2 years+. 77% of holders have been sitting on REN for one year, but the losses have been difficult to offset.
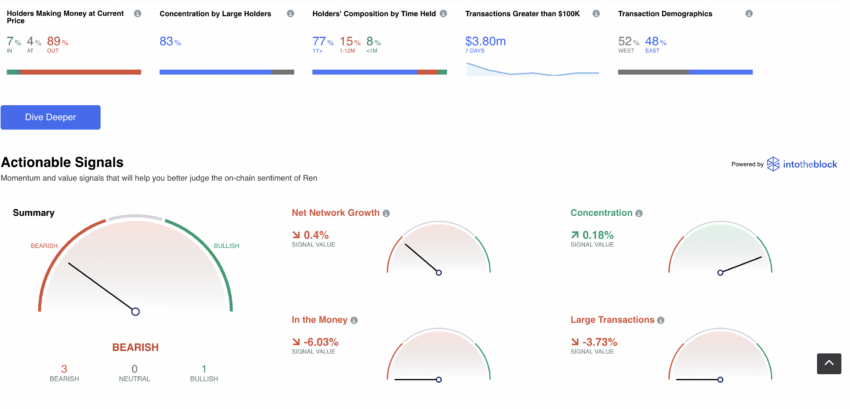
Even the actionable signals show that REN is in bearish territory for now. However, REN is known to respond well to the news. For instance, REN surged 32% when rumors spread about a potential Binance acquisition.
Twitter handle @Lookonchain tweeted a comprehensive thread about REN, highlighting the on-chain transactions during the price surge. The thread indicates that the top 30 REN holders control almost 61% of REN’s supply.
Here is how the price action looked on Nov. 25, the day REN set aside FTX fears:
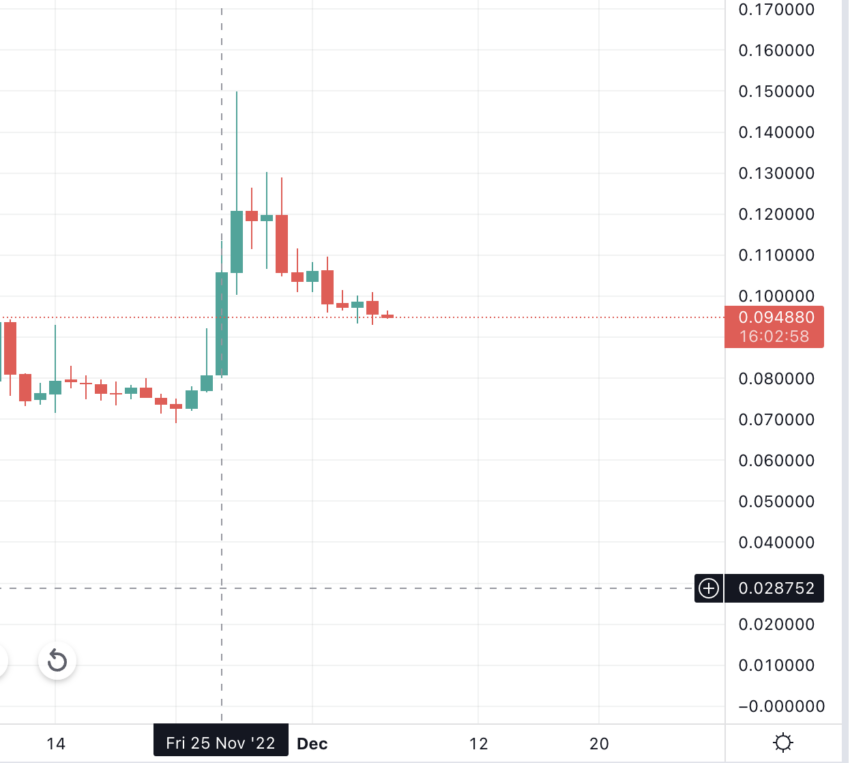
REN price prediction models can be dependent on sentimental drivers. Therefore, the linear path for prediction might not always hold.
REN price prediction and social presence
Details from LunarCrush suggest that REN price surges are directly related to a rise in social mentions. These grew 22.7% over the past three months, as of December 2022.
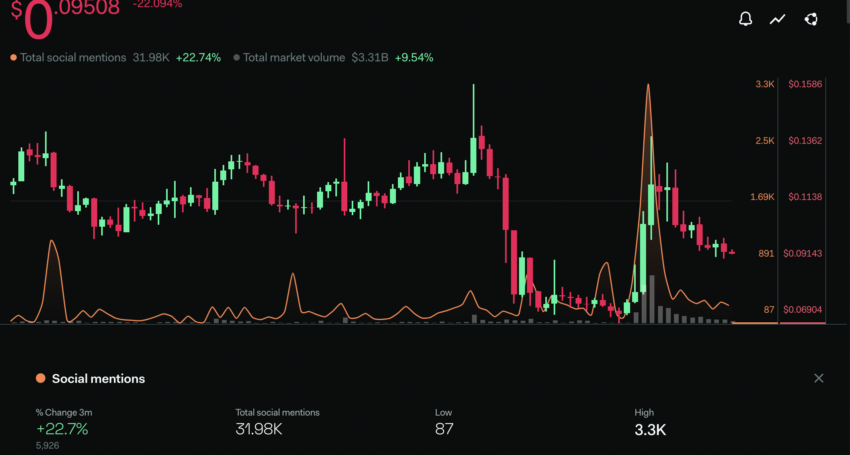
Notice REN’s growing Reddit presence over the past few months, as of December 2022.
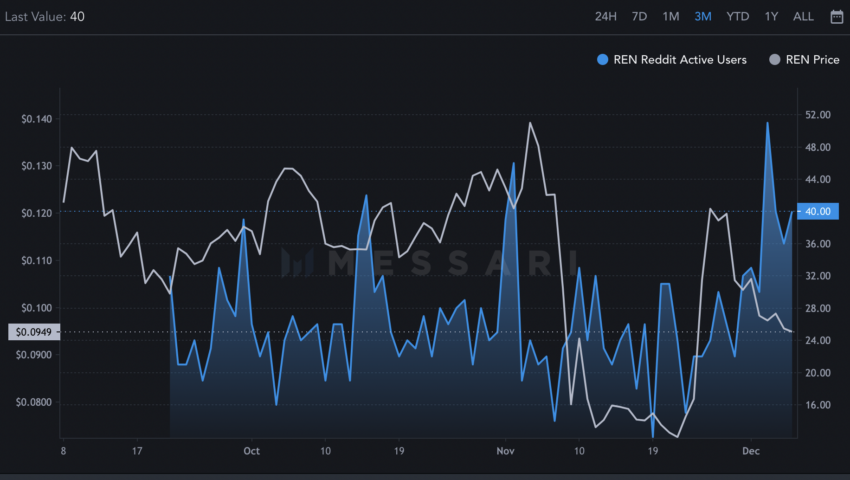
An increase in social and Reddit activity indicates that people haven’t forgotten about REN. Price volatility happens to be a key metric, and the same is looking up for REN. This might indicate that prices might surge toward the later part of 2024.
REN price prediction using technical analysis
Weekly pattern
Outlook: Bearish
Now, let us shift our focus to technical analysis. First of all, let us take a closer look at REN’s weekly price chart:
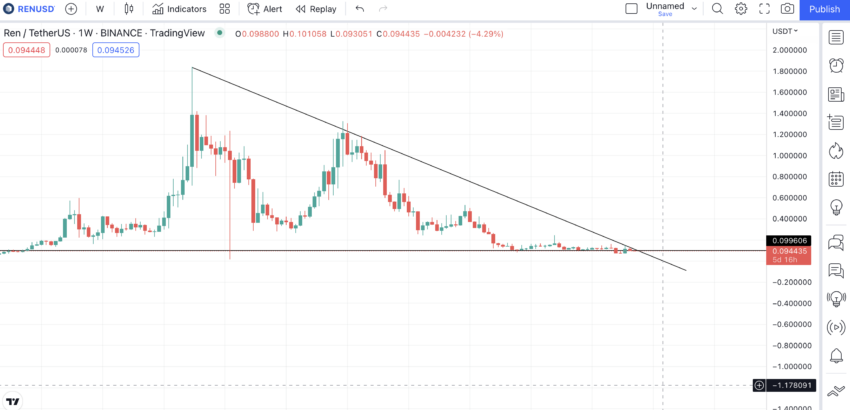
In the weekly time frame, REN is trading in a descending channel pattern, which is moderately bearish. If the lower trendline is breached, we can see a short-term dip in prices.
Here are the notable insights:
- The highest price of REN is $1.83, which it reached in February 2021.
- The lowest price of REN is $0.0154, which it reached in November 2018.
- REN has a market cap of $95 million.
- REN’s market cap was the highest in February 2021, when the token reached $1.73 billion.
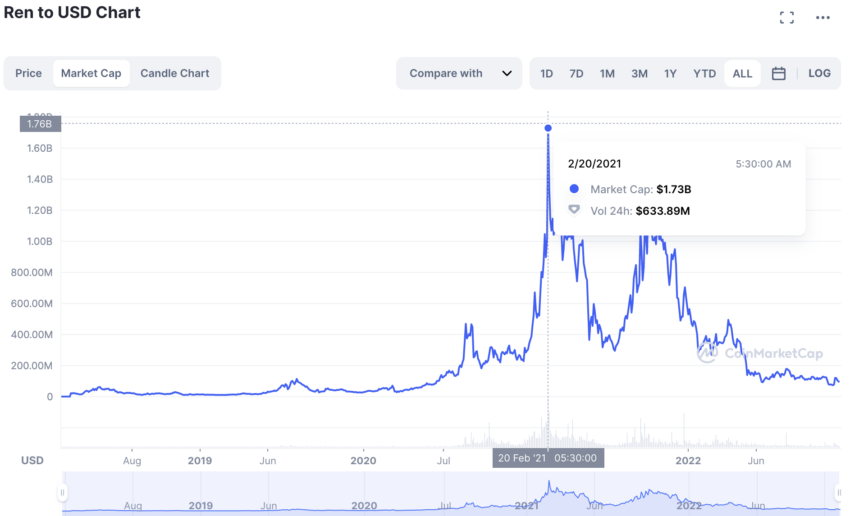
Daily pattern per 2022 analysis
Outlook: Bullish
The daily chart provides an interesting pattern. When REN consolidates for a while, it rises, moves in a range, breaks out, and then moves towards another high. The high points are encircled here.
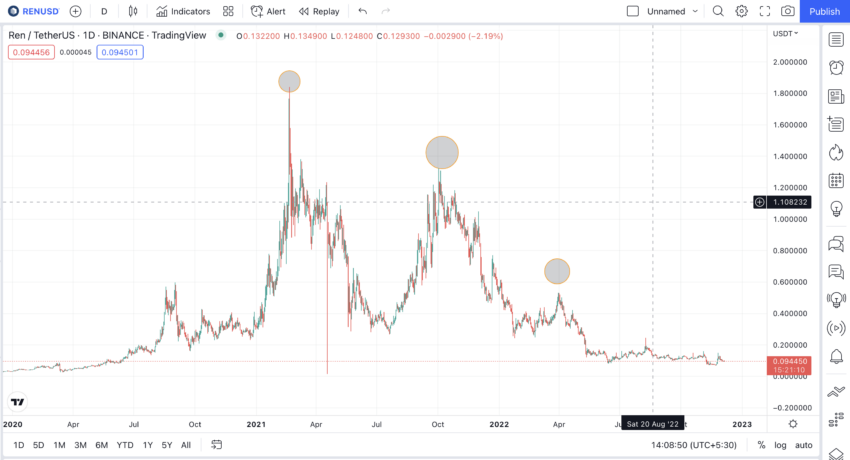
Now let us see how long it takes REN to move from one low to the next high.
Here are the bars and prices measured on the chart:
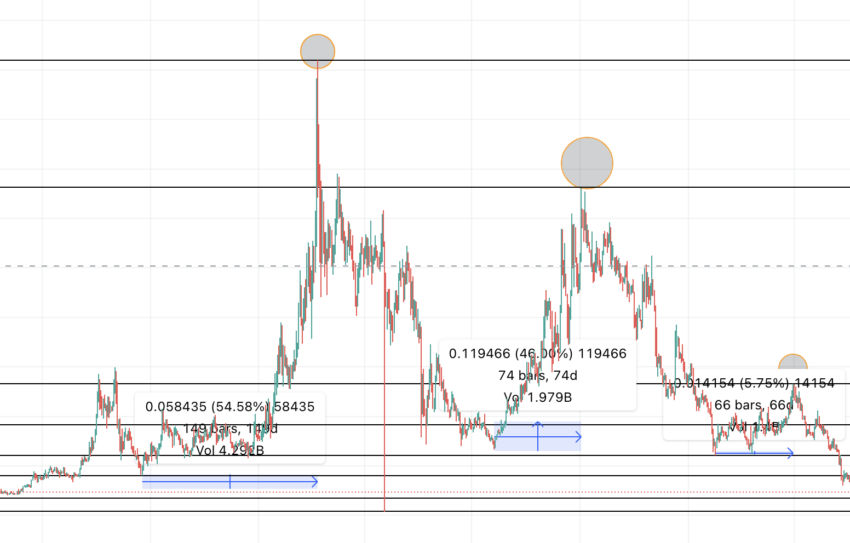
- 149 days to move from the previous low to the first high, with a rise of 1036%
- 74 days to move from the previous low to the second high, with a rise of 402% (ignoring the false breakdown between the 1st high and 2nd high)
- 66 days to move from the previous low to the third high with a rise of 120%
Average days = 96 days
Average % growth = 520% (rounded off)
So, the fourth high can be projected at 96 days from the current low ($0.0695) and 520% from the same.
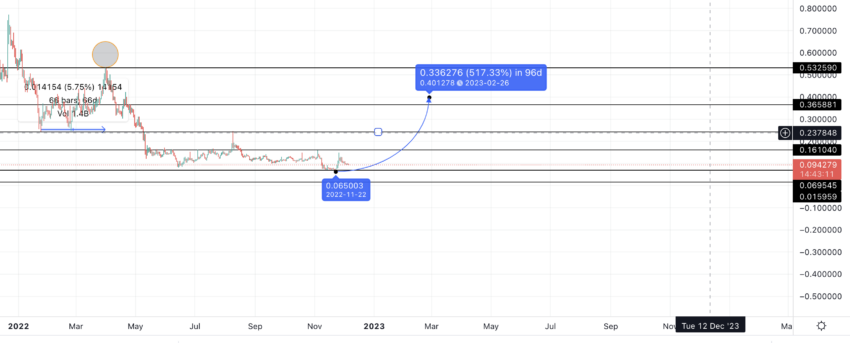
Hence, the next high is projected to be at $0.4012 on Feb. 26, 2023.
REN price prediction 2024
Outlook: Bullish
Do note that this is what we expected for REN in 2023. However, we believe that the current on-chain metrics associated with REN might mean that this cryptocurrency surges in 2024, in the same way we expected it to move in 2023.
The first touch-point in 2024 would be $0.4012. To project the maximum price of REN in 2024, we must forecast the next lows made by REN in the same year. If the high is at $0.4012, we should check the previous high-to-low price drops alongside time and find an average.
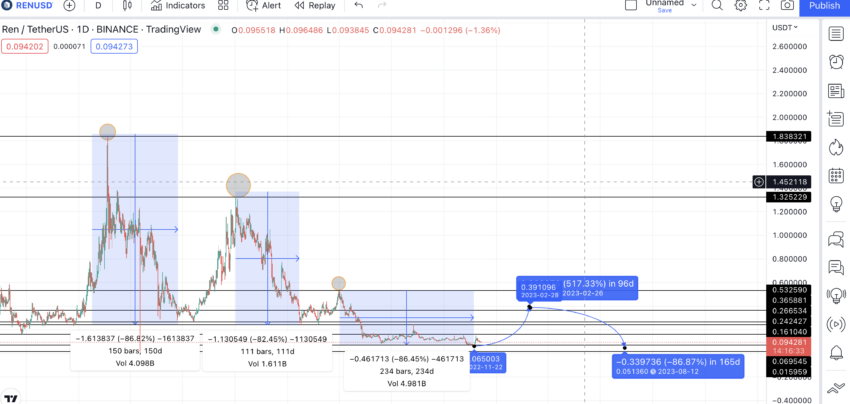
Analyzing REN’s price prediction for 2024, the model identifies a pattern where the first decline spanned 150 bars with an 85% drop, the second 111 bars with an 82% drop, and the third 234 bars with an 87% drop. Averaging these figures suggests a typical downturn lasts 165 days with an 85% decrease.
Consequently, the model forecasts a next low at $0.05136 by Aug, 12, 2024, setting the year’s high and low at $0.4012 and $0.05136, respectively, with a predicted ROI of 417% from the current level.
REN price prediction 2025
Outlook: Moderately bullish
We need to visit the weekly chart to calculate a REN price prediction for 2025. This can help us consider a long-term view.
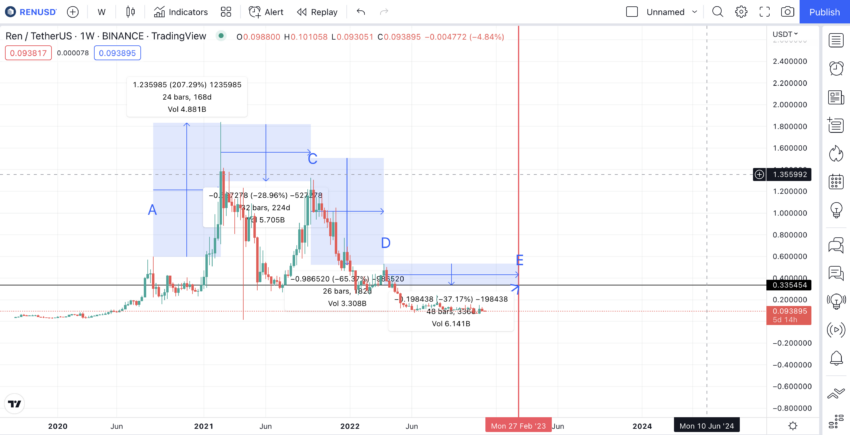
The same daily pattern repeats here, with REN making a high, correcting and making a low, then making another high.
Now, let’s take the points from one high to another and evaluate the time taken. The last high is based on our daily chart projection. The next high is projected to be at $0.4012 and on Feb. 26, 2024.
Point A to Point B = 168 days, Point B to Point C = 224 days, Point C to Point D = 182 days, Point D to Point E = 336 days
The average of the highs comes out to be 227.5 or 228 days.
Hence, if we forecast for the next 228 days, we see a high in late 2023 or early 2024. Therefore, if the REN price prediction model 2024 sits at a high of $0.4012, per the recent growth timeline, we can expect the 2025 high to be around $1.2, keeping the 120% price rise into consideration.
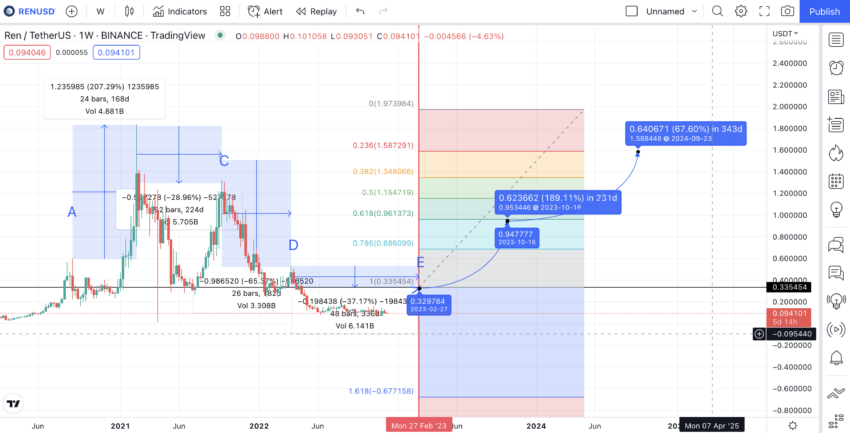
A REN price prediction for 2025, keeping the same growth rate into consideration, places the asset at a high of $1.20.
The 85% drop from the cycle highs to the lows may offer a realistic picture of the lows. That way, the lowest REN price in 2025 could show up at $0.237, per the moves made previously.
Predicted ROI from the current level: 1448%
REN price prediction 2030
Outlook: Bullish
If we consider another bear cycle, REN should be able to breach the all-time high of $1.83 as per the 2027 price prediction model. Now, if we place the FIB extension model onto the 2024 levels, the REN price prediction 2030 figure might lead to a high of $3.220.
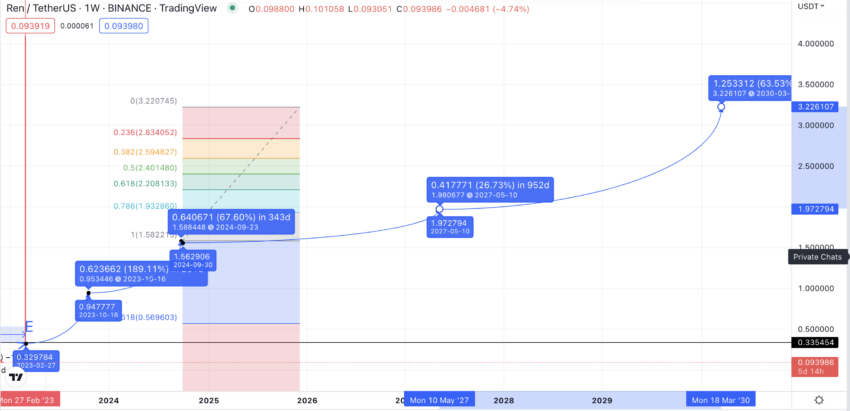
Predicted ROI from the current level: 4054%
REN long-term price prediction until 2035
We can expect the following table to hold if the token survives the current crypto market crisis. It’s also key to see if REN stays true to the 2023 price prediction. This table shows all the REN price prediction projections and price forecast moves up to 2035.
You can easily convert your REN to USD
| Year | | Maximum price of REN | | Minimum price of REN |
| 2024 | $0.4012 | $0.05136 |
| 2025 | $1.20 | $0.237 |
| 2026 | $1.73 | $0.260 |
| 2027 | $1.90 | $0.285 |
| 2028 | $2.185 | $0.32 |
| 2029 | $2.73 | $0.40 |
| 2030 | $3.220 | $1.365 |
| 2031 | $3.54 | $1.416 |
| 2032 | $4.42 | $1.70 |
| 2033 | $5.30 | $2.12 |
| 2034 | $6.095 | $2.44 |
| 2035 | $7.70 | $2.92 |
The REN price prediction models for 2026, and even 2028 might not follow the same path. We might see some profit booking and even another bear cycle during this time. Depending on social activity and sentimental drivers, REN’s lowest and highest prices might change over the years.
How accurate is the REN price prediction?
This entire REN price prediction piece is based on fundamentals and detailed technical analysis. Hence, if Ren follows the same growth path, we can expect the price forecast to hold. Also, once a price move beats the all-time high of REN, the price forecast might not stick to these standard calculations. We would always recommend doing your own research before choosing to invest. The crypto space is volatile, and staying informed trumps any market cycle.
This REN price prediction model isn’t intended to predict exactly what REN will be worth in 2025 or even 2030. Instead, it’s a tool to provide clarity on how REN prices move and indicate how they might arrive at a future price.
Frequently asked questions
Is REN a good investment in 2024?
Does REN have a future?
Is REN a good investment?
What price can REN reach?
Is REN on Ethereum?
What was the REN crypto all time high?
Disclaimer
In line with the Trust Project guidelines, the educational content on this website is offered in good faith and for general information purposes only. BeInCrypto prioritizes providing high-quality information, taking the time to research and create informative content for readers. While partners may reward the company with commissions for placements in articles, these commissions do not influence the unbiased, honest, and helpful content creation process. Any action taken by the reader based on this information is strictly at their own risk. Please note that our Terms and Conditions, Privacy Policy, and Disclaimers have been updated.


