DigiByte is related to Bitcoin. Actually, it is a fork of Litecoin, which has the same codebase as Bitcoin. It is proof-of-work, making it one of the more decentralized crypto platforms around. It propels the concept of crypto as a currency and offers support for asset creation using DApps and smart contracts. And it dates back to 2014, with Jared Tate — the DigiMan — as the founder. DigiByte is fast (40x faster than Bitcoin), highly secure, and hasn’t had a funding round, making it truly decentralized. This extensive DigiByte price prediction piece aims to track the short and long-term potential of DGB.
- DigiByte price prediction using fundamental analysis
- DigiByte tokenomics and the way forward
- DigiByte on-chain metrics and the price forecast
- DigiByte (DGB) prices and social growth
- DigiByte price prediction using technical analysis
- Pattern identification and distance between the peaks
- DigiByte (DGB) price prediction 2024
- DigiByte (DGB) price prediction 2025
- DigiByte (DGB) price prediction 2030
- DigiByte (DGB’s) long-term price prediction (up to 2035): can DigiByte reach $10 by 2035?
- How accurate is the DigiByte price prediction model?
- Frequently asked questions
Want to get DGB price prediction weekly? Join BeInCrypto Trading Community on Telegram: read DGB price prediction and technical analysis on the coin, ask and get answers to all your questions from PRO traders! Join now
DigiByte price prediction using fundamental analysis
The DigiByte blockchain has a rich history and an algorithmic approach to network security, mining, and privacy solutions. All these make it completely decentralized — an important virtue in the current crypto market.
Here are some additional insights about Digibyte:
Did you know? It has five algorithms that improve security compared to Bitcoin’s one algorithm.
- Each block surfaces within 15 seconds.
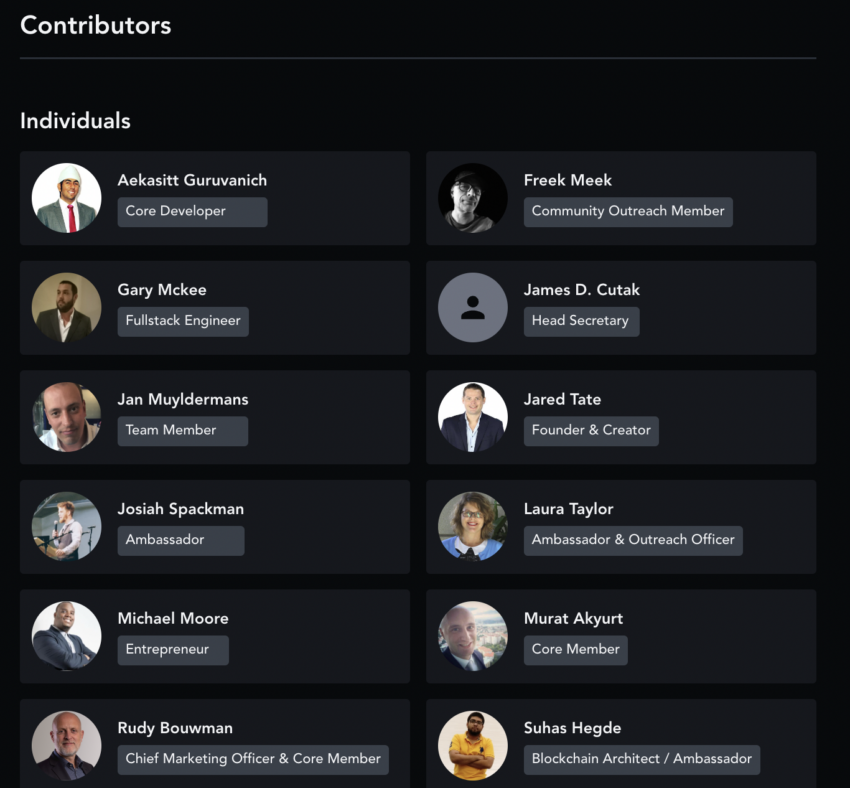
- No investors as there was no initial funding round. DigiByte only has ecosystem contributors.
- It plans to achieve a transaction speed of 280000 TPS by 2035. This makes it all the more important to keep an eye on the DGB price prediction for 2035.
- The mining difficulty adjustment is in real-time, which makes it more decentralized.
- DigiByte has several use cases: hosting protocols, secure ID, asset creation, and more.
As a PoW chain with several perks over some of the established names, DigiByte’s price forecast should hold true for some time.
DigiByte tokenomics and the way forward
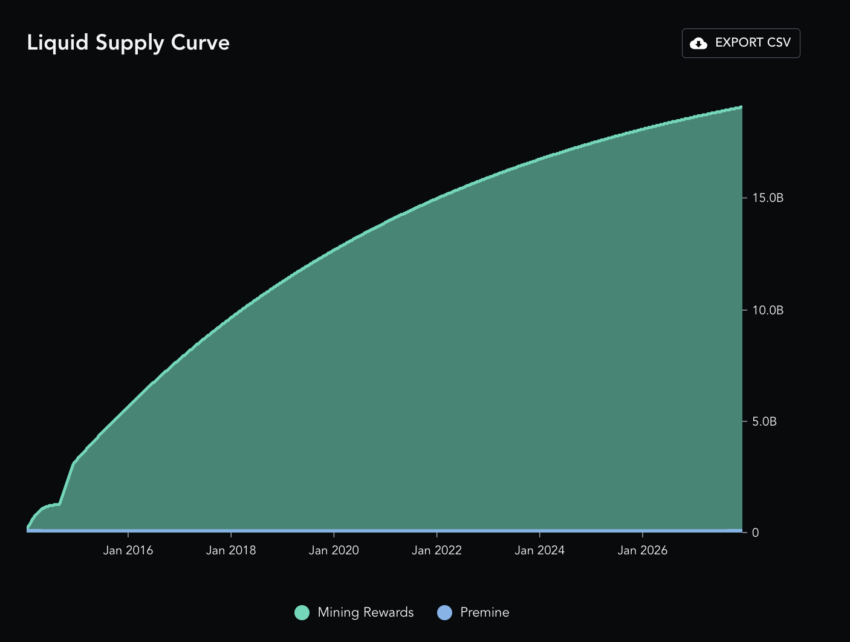
DGB has a fixed supply of 21 billion coins. At present, 80% of the total supply is in existence. The lack of funding rounds keeps the tokenomics simple for DGB, as none of the coins were used to raise funds. However, 105 million pre-mined DGB were moved to the reserves for development.
At present, DGB has an annual issuance rate of 5.57%, which decreases each year — making DGB disinflationary. By 2035, all DGB coins are expected to be mined, making the scarcity motivation kick in.
Here is the supply curve with the substrate as the pre-mine allocation. Note that all the other coins are related to the mining rewards.
This chart shows how DGB’s annual inflation rate (line in blue) has been relatively flat over its entire trading-specific course. However, that might also mean fewer miners at DGB’s corner.
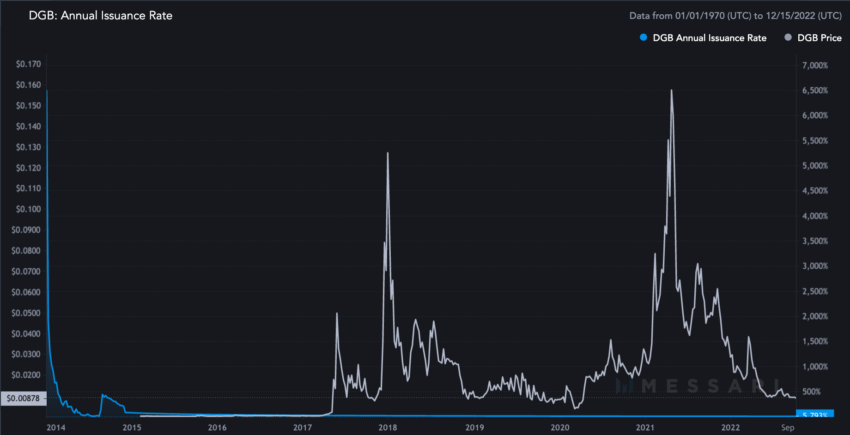
The clean and uncomplicated tokenomics might work well for DGB prices, especially when the inflation rate drops to zero post-2035.
DigiByte on-chain metrics and the price forecast
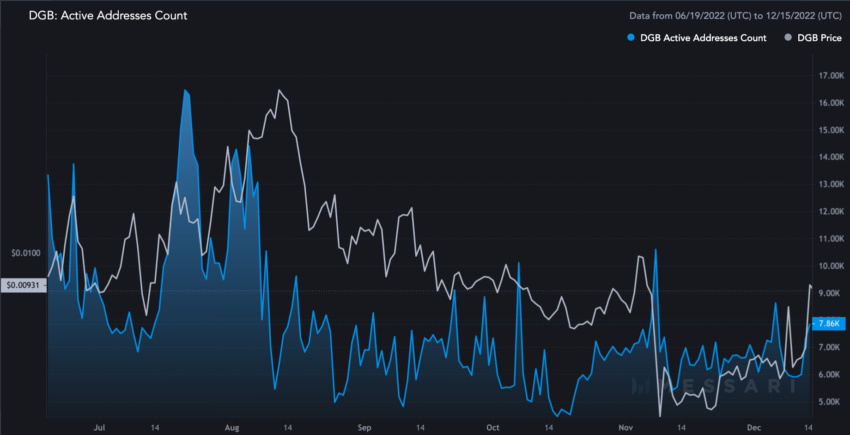
If we plot the growth in active addresses for DigiByte (DGB), it’s clear that over the past 180 days in 2022, there’s been a steady rise in DGB holders. The price of DGB has also responded positively to this.
DigiByte (DGB) prices and social growth
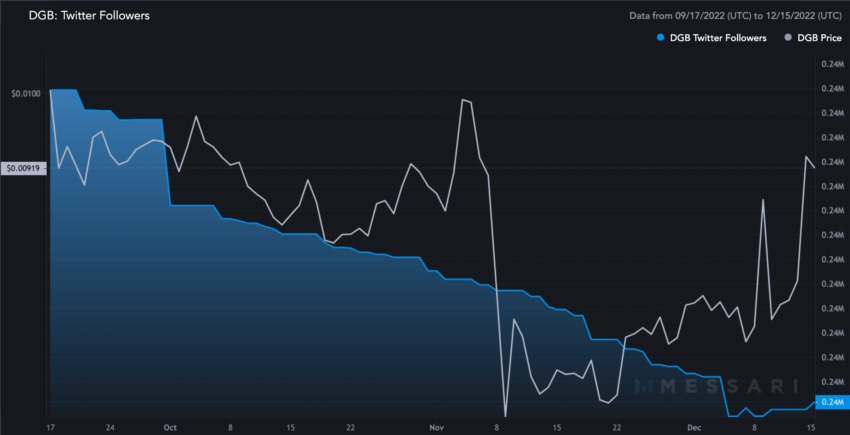
As seen, DGB has a large Twitter community comprising almost 239K followers.
Here is a chart that shows a drop in the number of Twitter followers over the past 90 days, per 2022 data. However, the prices have increased, showing a short-term negative correlation.
A clear spike in DigiByte’s social volume can be seen from mid-October to November 2022. This hints at better adoption, followed by the increasing number of wallet addresses.
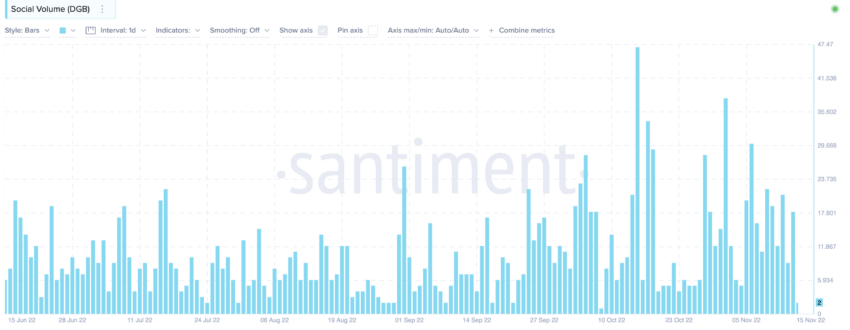
These metrics need to be tracked further to shed more light on the price action.
DigiByte price prediction using technical analysis
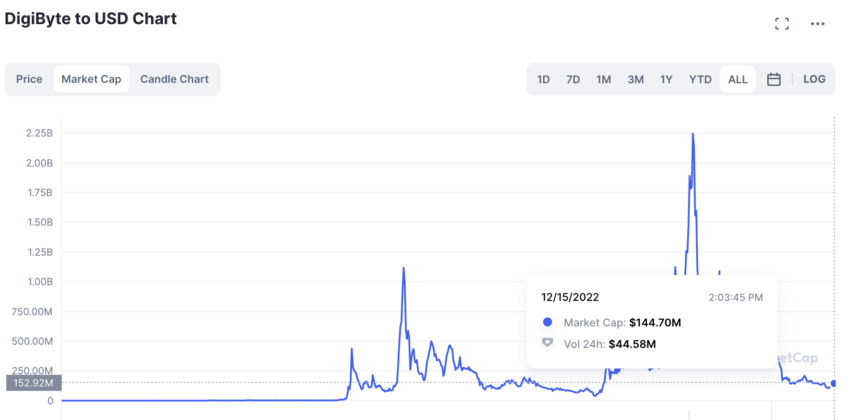
Before we move any further, let us take a look at DGB’s price chart. Note that we are using Binance’s DGB-USDT market, courtesy of its massive volume. Plus, we have the weekly chart open to help you look at the price of DGB on a larger scale.
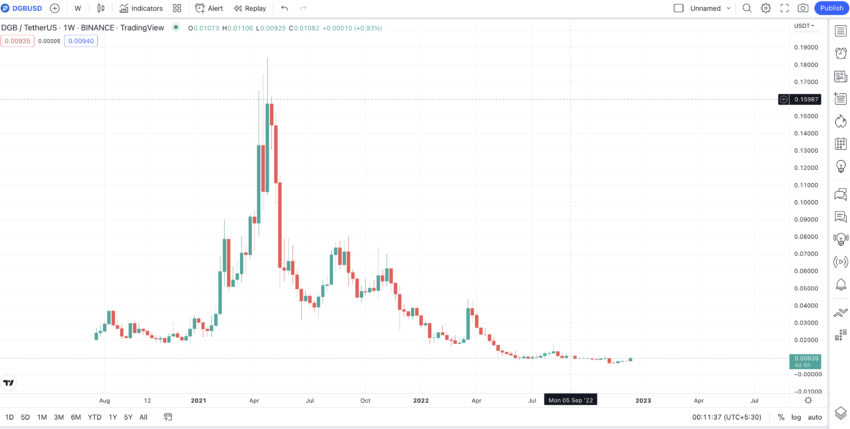
Also, here are the insights we could gather from the weekly chart:
- The price of DGB peaked on May 1, 2021, reaching $0.1825.
- Roughly around the same time — May 3, 2021 — DGB reached a crypto market capitalization of $2.25 billion, its highest.
- The highest market capitalization day was followed by $143.17 million in trading volume.
- Trading volume for DGB has dropped since. As of Dec. 17, 2022, it is at $44.58 million. This hints at a build-up of positive sentiments at the counter.
- Over the past three months, as of 2022, DGB could only reach a high of $0.0106.
- The chart forms a standard higher high pattern followed by a swing high, with each side of the foldback having two discernible peaks and the highest point in the middle.
Pattern identification and distance between the peaks
Outlook: Bullish
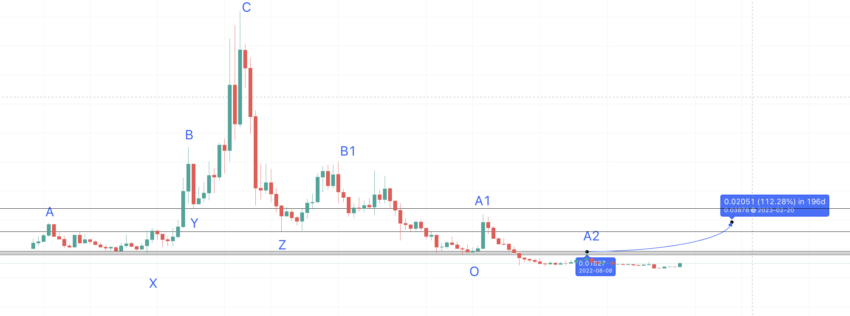
Now, let us mark the points as A, B, C, B1, and A1. This marking scheme will help us prepare a more concrete DGB price forecast. Do note we have ignored the smaller peaks for the sake of symmetry.
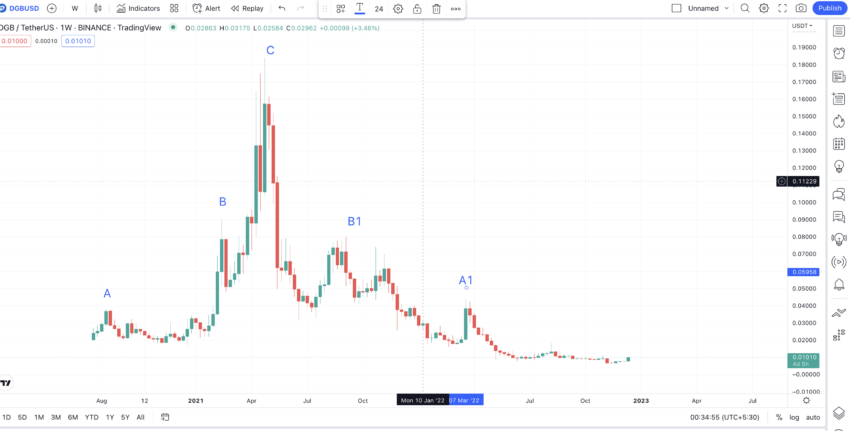
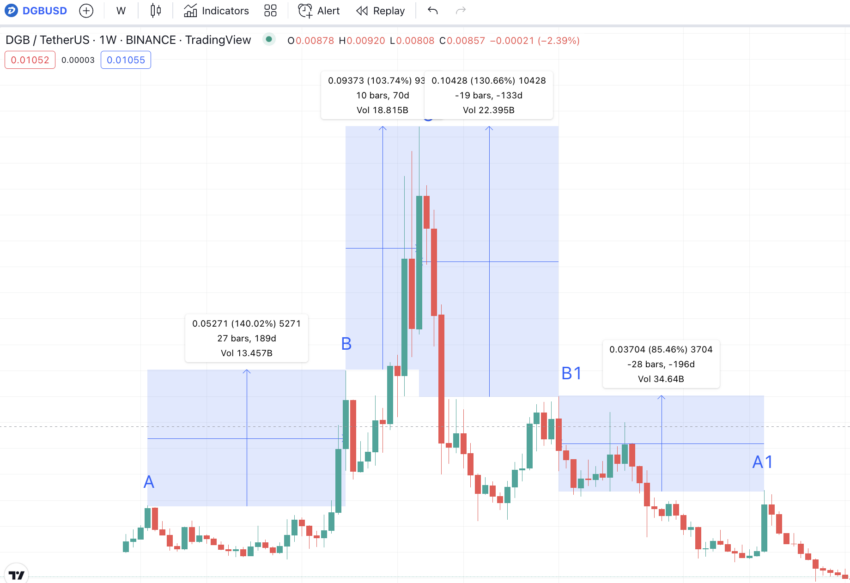
Once we have marked the points, let us find the distance and price difference between the highs.
A to B = 189 days and a 140.02% change; B to C = 70 days and a 103.74% change; B1 to C = 133 days and a 130.66% change; A1 to B1 = 196 days and an 85.46% change
If DGB follows the same pattern, involving two higher highs before a peak, the average of the first peak to the second comes out to be:
A to B and A1 to B1: 192.5 or 193 days and 112.74%
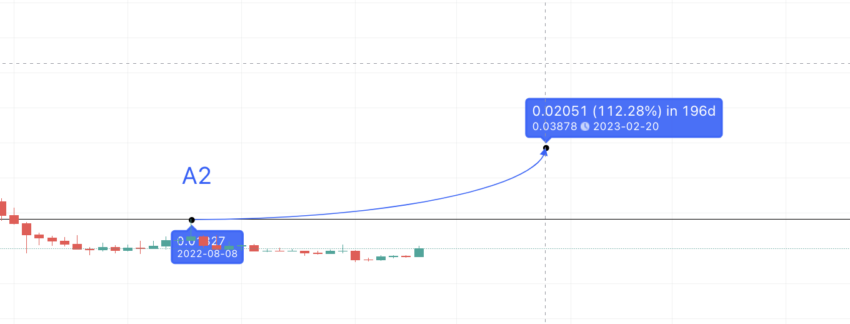
If we locate the next high of the next pattern — A2 — we can plot where the next high might turn up.
Locating the next point
Outlook: Bullish
If we keep looking rightwards at A1, we might notice a small peak. This might be A2, considering peaks can get smaller in the bear market.
If we locate the first high of the next pattern as A2, the next high could be in 193 days and at an increment of 112.74%. Let us draw the DGB price forecast line for the same:
The next high comes out at almost $0.038, close to Feb. 17, 2023.
DigiByte (DGB) price prediction 2024
Outlook: Bullish
As mentioned above, DGB’s price is expected to hit $0.038 (B2) by 2024. Not let’s locate the low.
For that, we will now mark the lows between two highs. Let us mark them as X, Y, Z, and O.
Here is the data with which we can trace the path from A to X, B to Y, C to Z, B1 to Z, and A to O.
A to X = 133 days and a -53.90% change; B to Y = 7 days and a -46.99% change; C to Z = 56 days and a -82.83% change; B1 to Z = 56 days and a -82.83% change; A1 to O = 14 days and a -63.30% change.
Calculations
So if we take the average of the deets from A to X and then A1 to O, we get:
73 days and 58.60%.
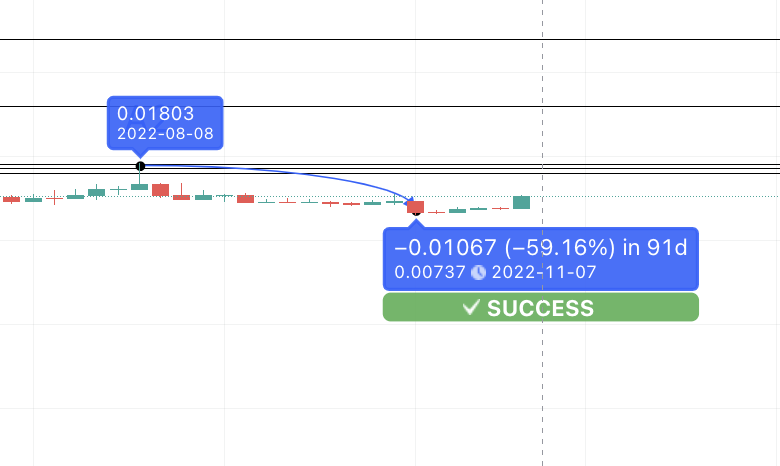
If we draw the forecast line from A2, the low comes to be at 0.00737 or X1. See that it took 91 days to reach that low, which is an expected variance in the bear market. The low formation, as per our projection and calculation, is a success, as revealed by the path.
Now we can use the same calculation to find the Y1, the low from level B2, which was at $0.038.
To find the Y1, the average of B to Y and B1 to Z needs to be calculated:
Here is the projected path:
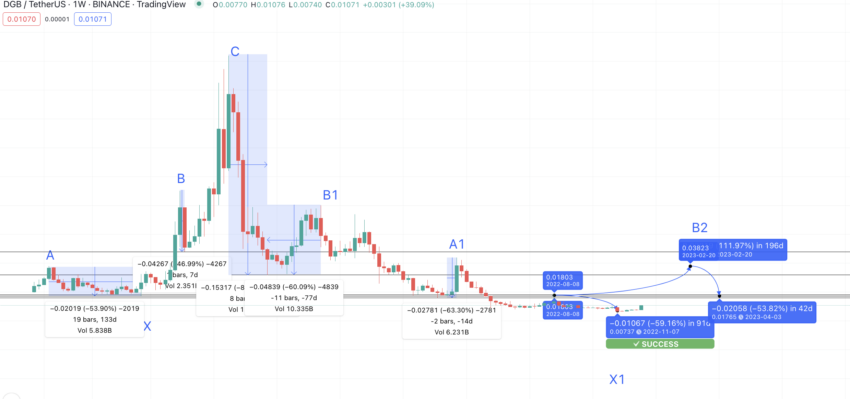
The DigiByte price prediction for 2024 returns a high of $0.038 as the maximum. However, the minimum price could go as low as $0.01765 post-the high or as low as $0.01 if the price doesn’t surge from here.
Projected ROI from the current level: 300%
Short-term DGB price forecast in 2022: The way forward for 2023
The daily chart for DGB shows a bullish descending triangle pattern in play. Descending triangles are mostly bearish. However, if there is a trend change in play or trend reversal, the upper trendline — in the case of DGB — gets breached.
The circle shows the same.

The lines on the price chart and the RSI (momentum) chart indicate a clear bullish divergence. This might signify a trend shift.
The moving averages (50, 100, and 200) give final confirmation of a rally. If the 50-day and 100-day moving averages (red and green) cross above the higher one, we can expect a rally at DGB. This might take it to the projected high of 2023, which flatlined at $0.12.
The short-term price prediction aligns with the DGB price forecast for 2023.
DigiByte (DGB) price prediction 2025
Outlook: Moderately bullish
To find the next high, we can take the average of B to C and B1 to C (data from the pattern identification section).
This comes out as 102 days and at a 117.20% peak. That might show up in 2023. However, due to slow market conditions, it should be put somewhere in 2024 — preferably early 2024.
Therefore, the C1 level for the price of DGB could show up at $0.083. This would be another 2024 price-based possibility for DGB if the bulls roar louder.
Also, keeping the 2023 low in mind, the 2024 low could be at $0.038, which is the expected price of DGB as per our calculations. If the next low is higher or equal to the previous high, the price of DigiByte may grow significantly, as a bullish trend will emerge.
Keeping the same pathway intact and extrapolating to 2025, we need to use the Fib indicator placed on the last high — C1.
By C1, the future price of DGB would have crossed above several other highs, like A1 and B1. However, if we look at the bigger pattern, the immediate short-term goal for DGB post-2025 would be to breach level B. This is the only high lower than DGB’s all-time high point of $0.1825.
If DGB crosses $0.0908 in 2024 or early 2025, the DigiByte price prediction 2025 model puts the highest price at $0.205. That would count as the new all-time high for DigiByte (DGB).
Projected ROI from the current level: 1608%
DigiByte (DGB) price prediction 2030
Outlook: Bullish (But $10 might not be possible)
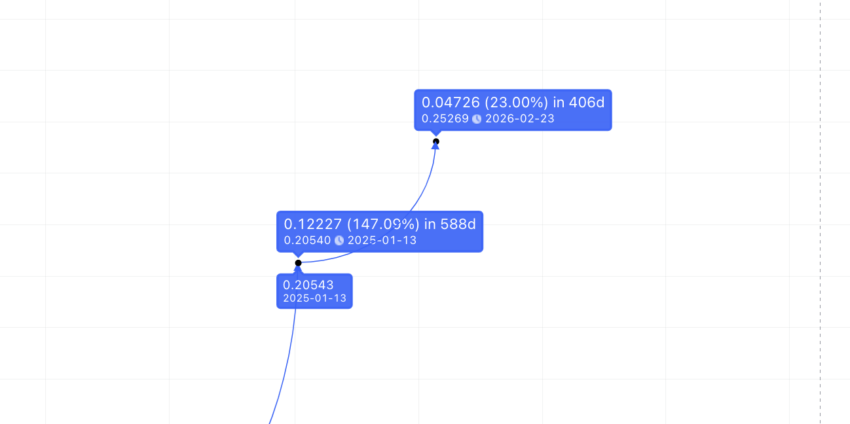
To extend the forward path for DigiByte, we can use the Fib indicator on the last 2025 high of $0.205.
This shows us the DigiByte price prediction for 2026. If the same path is followed, it costs close to $0.252. The low for that year could coincide with the low Fib retracement level of $0.204. However, that would depend on the market conditions at that time.
Now, if we use the Fib indicator on the 2026 point, the same extends to a minimum of $0.384 by 2028. Also, considering DGB’s tepid yet sustained price growth, the Fib levels, for the same slope, put the DigiByte price prediction for 2030 at around $0.528.
Here is the path for 2030:

Projected ROI from the current level: 4300%
DigiByte (DGB’s) long-term price prediction (up to 2035): can DigiByte reach $10 by 2035?
If you are looking to gauge the price of DGB up till 2035, here is a table that might help. We have gathered this data following a detailed technical analysis across the mentioned timeframes.
You can easily convert your DGB to USD
| Year | | Maximum price of DGB | | Minimum price of DGB |
| 2024 | $0.038 | $0.01765 |
| 2025 | $0.205 | $0.112 |
| 2026 | $0.252 | $0.204 |
| 2027 | $0.315 | $0.224 |
| 2028 | $0.384 | $$0.276 |
| 2029 | $0.460 | $0.285 |
| 2030 | $0.528 | $0.38 |
| 2031 | $0.684 | $0.42 |
| 2032 | $1.02 | $0.51 |
| 2033 | $1.287 | $0.79 |
| 2034 | $1.60 | $1.15 |
| 2035 | $2.41 | $1.49 |
The DGB price forecast on display isn’t linear. It takes DigiByte’s fundamental and on-chain metrics growth into account. You might see some stagnancy in growth over the years. This may stem from changing public opinion about PoW crypto. If DGB can reach 280000 TPS by 2035, we may see the expected price levels change over the next few years.
For now, a DigiByte price prediction for 2040 is beyond the scope of this discussion. However, a $10 level might not be out of the question.
How accurate is the DigiByte price prediction model?
This DigiByte price prediction model uses extensive calculations and technical analysis. We have also covered short-term trends and assessed whether the 2024 DGB price prediction could actually hold. Hence, the prepared DigiByte price prediction model is practical. It might also be accurate if DGB follows a similar growth path as of the time of writing.
If you are eyeing DGB for the long term, know that, like most digital assets, DigiByte will go through bear and bull cycles. Therefore, it is sometimes best to focus on the average future price of DGB rather than the maximum/minimum levels.
Frequently asked questions
Will DigiByte ever reach $1?
Is DigiByte coin a good investment?
Is DigiByte a good investment 2024?
What is DGB all time high?
Is DigiByte a stablecoin?
Disclaimer
In line with the Trust Project guidelines, the educational content on this website is offered in good faith and for general information purposes only. BeInCrypto prioritizes providing high-quality information, taking the time to research and create informative content for readers. While partners may reward the company with commissions for placements in articles, these commissions do not influence the unbiased, honest, and helpful content creation process. Any action taken by the reader based on this information is strictly at their own risk. Please note that our Terms and Conditions, Privacy Policy, and Disclaimers have been updated.