
Bitgert began life as a protocol on the BNB chain. A crypto engineering solution, Bitgert launched its own BRC20 blockchain in 2022. Since then, there has been no looking back. Bitgert is one of the fastest and most scalable blockchains around, boasting zero gas transactions. This Bitgert price prediction piece will consider this innovative ecosystem holistically. Are BRISE coins (the Bitgert native currency) a solid investment per the strong project fundamentals? Let’s take a look.
- Bitgert price forecast and fundamental analysis
- Bitgert tokenomics and price predictions
- BRISE price forecast and other key metrics
- Bitgert price prediction and the technical analysis
- Bitgert (BRISE) price prediction 2023
- Bitgert (BRISE) price prediction 2024
- Bitgert (BRISE) price prediction 2025
- Bitgert (BRISE) price prediction 2030
- Bitgert (BRISE) long-term price prediction until 2035
- Is this Bitgert price prediction model reliable?
- Frequently asked questions
Want to get BRISE price prediction weekly? Join BeInCrypto Trading Community on Telegram: read BRISE price prediction and technical analysis on the coin, ask and get answers to all your questions from PRO traders! Join now
Bitgert price forecast and fundamental analysis
Bitgert is currently an (almost) zero-gas, highly scalable blockchain. In addition to the architectural perks, the Bitgert ecosystem offers a DApp wallet, staking, bridging, and swapping features. Rewards for exploring the DeFi and staking features are offered in BUSD — one of the more reliable stablecoins.
Did you know? Bitgert isn’t just fast. As a blockchain, it is one of the fastest, boasting speeds of up to 100,000 TPS. This eliminates scalability issues.
Despite supporting staking, the network’s inherent consensus model is proof-of-authority (PoA). This algorithm supports higher transaction speeds and prioritizes the identity and credibility of the validator over everything else.
Justin Bons, Founder of Cyber Capital: X
Other additional insights include:
- Bitgert, amid a sea of features, retains the focus on being a peer-to-peer payments system, thanks to the DApp wallet.
- The Bitgert chain is EVM-compatible, with the BRISE Swap acting as a DEX and the DApp wallet acting as a multi-crypto-compatible wallet.
With some hard-hitting use cases, Bitgert looks fundamentally strong.
Bitgert tokenomics and price predictions
The token economics model has a major role in defining any digital asset’s future price. And BRISE, Bitgert’s native coin, is no different.
Bitgert has a fixed supply of tokens — 1 quadrillion. Even Shiba Inu started with this type of token supply. Currently, the circulating supply makes up 39.5% of the total number of BRISE tokens. In the token model, 50% of the supply is dedicated to the token burn mechanism, whereas 38% is dedicated to the overall liquidity framework or the trading markets.
The most interesting element of Bitgert’s tokenomics is the buyback mechanism. This way, some of the existing supply is always sent back to the Brise chain, helping make the asset deflationary over time. And that is another optimistic driver for the price action.
BRISE price forecast and other key metrics
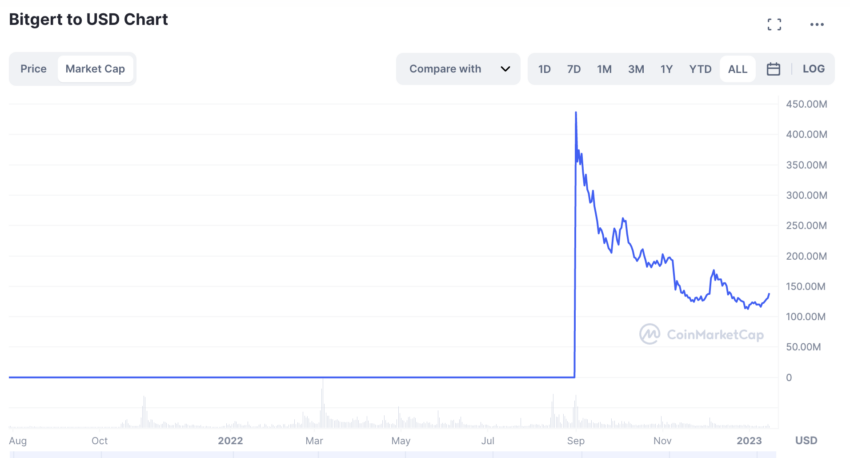
Assets with low volatility make good investment choices. But volatility in crypto isn’t something we can eliminate. However, the 4-week volatility chart of BRISE, as of early 2023, presented an optimistic picture. As the chart below indicates, volatility has been in a downtrend since September. And each time there is a significant dip, the prices spike. But then, despite the low January 2023 volatility, which the following chart captures, the prices couldn’t soar as they should in 2023.
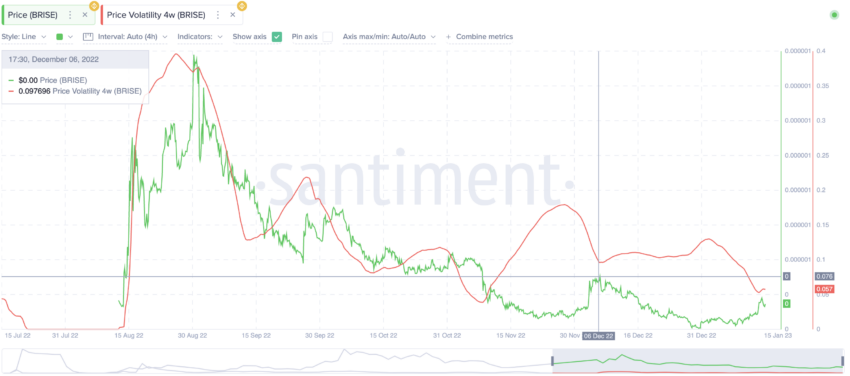
Notice the price of the BRISE token is currently trying to breach its previous high made on Dec. 6, 2022. To do so, the volatility must remain low for a while.
What predicted the underwhelming price surge was the dip in the 30-day active addresses holding BRISE. As per the early 2023 chart, the active address peaked on Sep. 13, 2022. Since then, there has been a dip, and the prices have followed the same. Also, each time that price action breached above the addresses, the prices have dipped significantly.
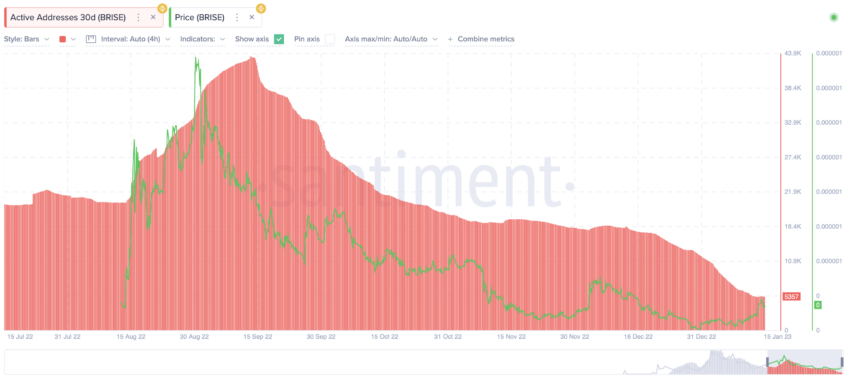
For an uptrend, there must be faster growth in the number of active addresses holding BRISE. Something that would surpass the price action by a fair distance.
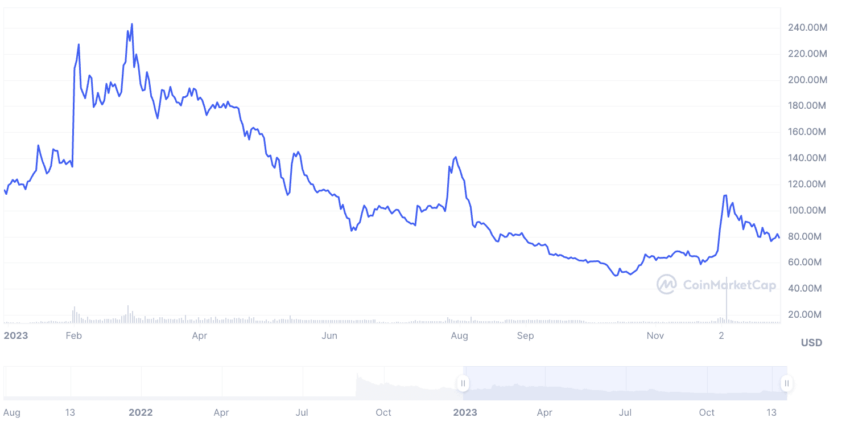
Also, as the market cap isn’t improving at a clip, with BRISE’s December 2023 market cap still below the levels it formed in July 2023, volatility should be a concern. This might not advocate a rapid price in days to come.
Bitgert price prediction and the technical analysis
We have covered Bitgert’s fundamentals, tokenomics, and key metrics. So, it’s time to shift our focus to technical analysis.
Our early 2023 analysis
We shall first take a look at the daily BRISE-USDT price chart from early 2023 to understand why it moved the way it did in 2023 and try to identify any patterns, if any:
Here are a few pointers that might help with the Bitgert price forecast, both in the short-term and long term-::
- BRISE, the native coin of Bitgert, reached an all-time high price of $0.0000404 in August 2021.
- However, after getting listed, the highest-ever price of BRISE was $0.00000184, recorded in March 2022.
- As of Jan. 15, 2023, daily trading volumes have increased by 51%.
- However, the market cap and daily trading volumes have dipped since the peak on Sep. 1, 2022. Still, the market cap pattern seems to be making lower highs, justifying a downtrend of sorts.
- As of December 2023, the market cap is still on the lower side and must first breach past the July levels to grow.
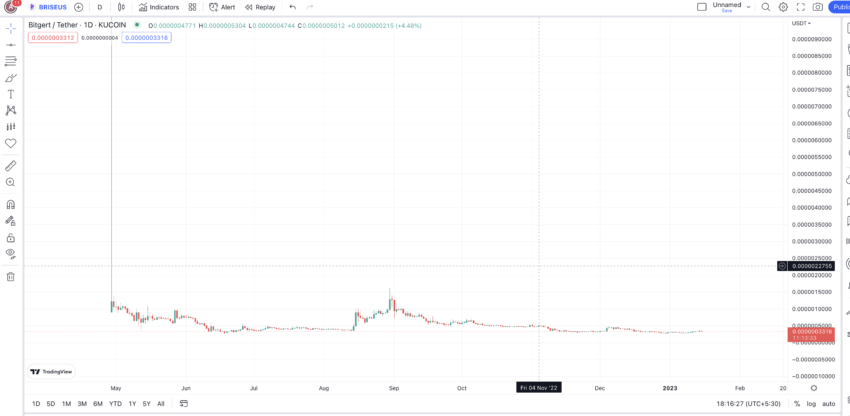
Here is what the price pattern looked like in January 2023.
The short-term daily price history of BRISE shows a visible bullish falling wedge pattern. Further, the breakout from the upper trendline might just be the impetus BRISE was looking for. Additionally, the momentum indicator — the RSI — hints at a bullish divergence. Also, notice that the price is making lower lows, whereas the RSI is making higher lows — hinting at some growing bullishness at the counter.
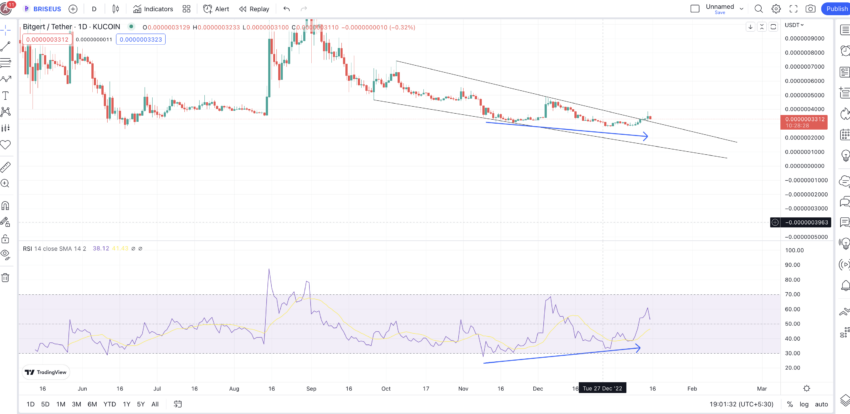
All these factors suggest that the future price action of BRISE might start looking up in the short to mid-term.
Our December 2023 analysis
If we pull out the BRISE chart, the descending channel pattern seems to be as clear as day. What’s heartening is that BRISE is trying to breach past the upper trendline, with the resistance being very strong. The RSI is helping, forming higher lows in the process, and a breach past $0.000000216 can propel the prices higher.
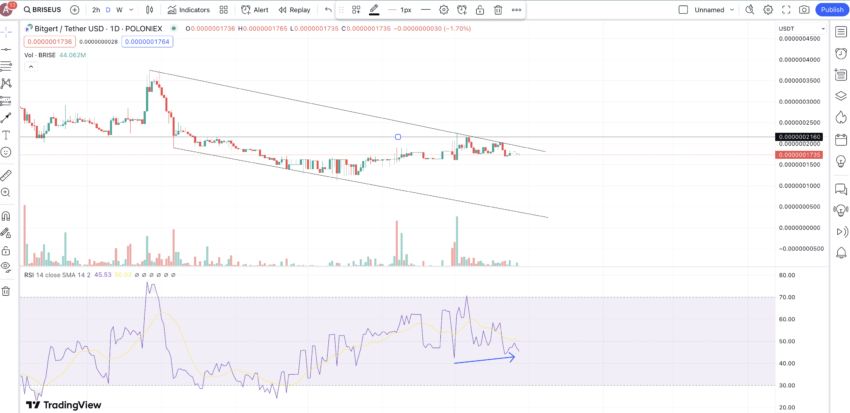
Let us now proceed to the weekly analysis:
Pattern identification
The daily chart shows a clear pattern with BRISE starting at a high and then dipping slightly. The dips eventually transform into a higher high pattern with a peak. Further, the same pattern seems to continue with the peak of the previous pattern working as the initial high of the next (current) pattern.
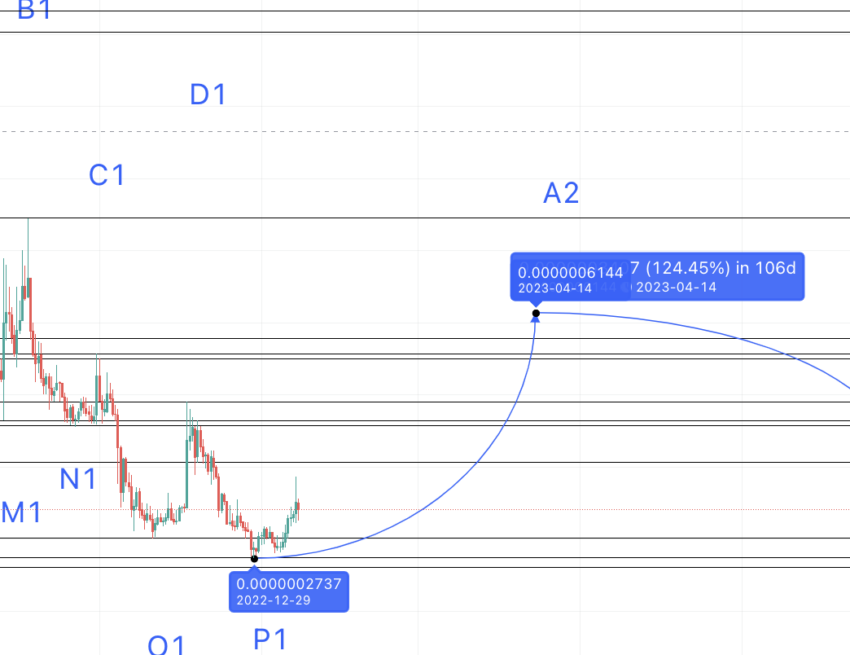
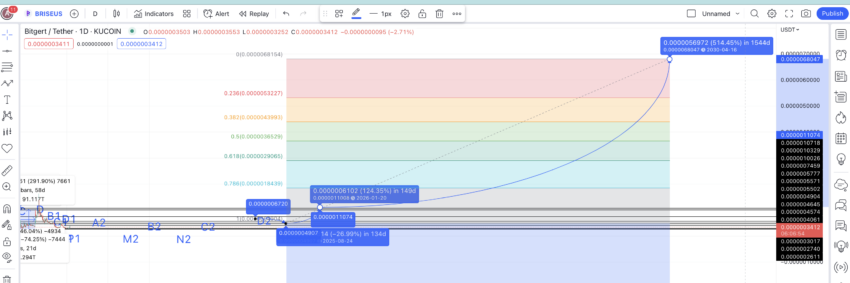
Let us revisit the chart but this time with all the points marked clearly:
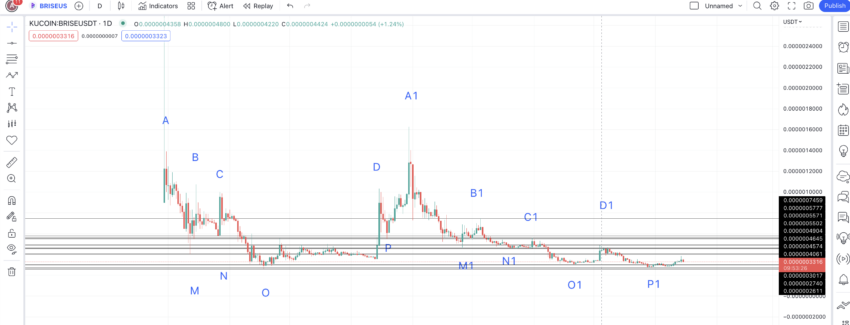
The price of BRISE moves from A to A1 during the initial part of the daily chart. The next path would be A1 to A2, and our immediate job is to locate the A2 first.
Price changes
We can plot the distance and price change percentages between all the points from A to A1 (using Table 1) and from A1 to P1 (using Table 2). Once we have the values, we can calculate the average to locate the next high.
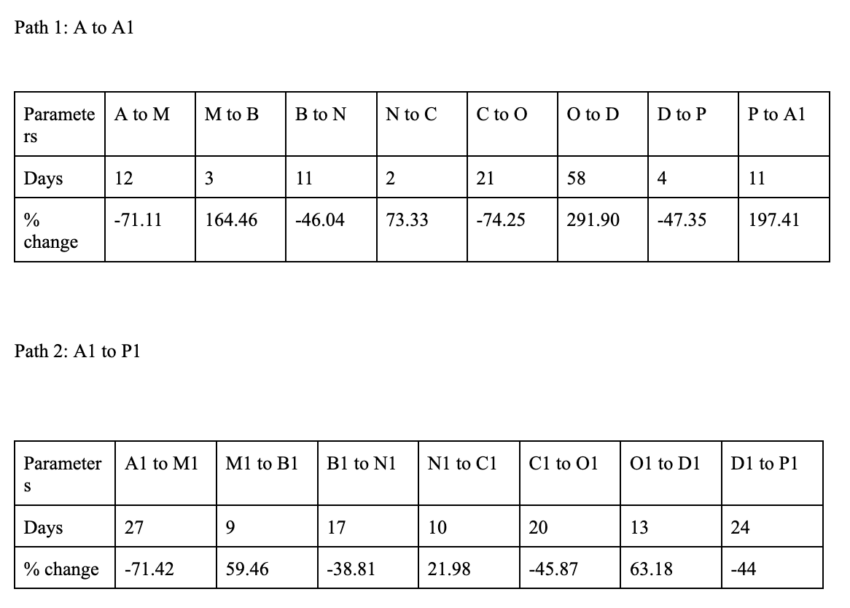
Every column with a negative percentage value means a high-to-low move. In contrast, those with positive values stand for low-to-high moves. Plus, all the horizontal lines on the chart stand for strong resistances and supports, which you can expect BRISE to respect.

Calculations
The average distance for high-to-low comes to be 17 days — it can go as high as 136 days, depending on the current state of the crypto market. 136 is the sum of all the days corresponding to the positive values. The average price change for low-to-high is 58.85%. The lowest percentage drop could be 38.81% from table 2.
Also, the average distance and price change for subsequent low-to-high Bitgert price predictions are 15 days. The max can be the sum of all values or 106 days and 124.52% using the tables from earlier. The lowest percentage gain per the price history is 21.98%, as mentioned in Table 2.
We can use the mentioned values for the long-term Bitgert price forecast.
Bitgert (BRISE) price prediction 2023
We predicted a specific price for BRISE in 2023, and interestingly, it stuck to the same and didn’t move any higher. Let us understand how we went about this successful prediction.
The last low point on the BRISE chart is marked P1. Using the low-to-high average, we can plot the next point or A2 at 124.52% in 106 days. We have taken the maximum number of days as we are currently in a bear crypto market.
This Bitgert price forecast puts 2023 high at $0.0000006144. If we mark this as A2, the new M2 could surface at a low of 58.85% in 136 days max. However, there are many support lines on the chart. If BRISE makes a high of $0.0000006144 in 2023 and the market conditions improve, we can expect the low to surface at $0.0000004076 — a drop of 33.65% — in line with the lowest percentage drop of 38.81%.
Bitgert (BRISE) price prediction 2024
Outlook: Bullish
If BRISE follows the same pattern as A to A1 and then A1 to A2, we can expect some lower high formations in 2024. Therefore, from M2, we can expect the price of Bitgert to go as high as 21.98% — the lowest percentage gain. This would ensure that the next point, B2 is lower than A2 and validates the pattern. The time taken could be anywhere between 15 to 106 days. We will take the max distance to put the B2 closer to 2024.
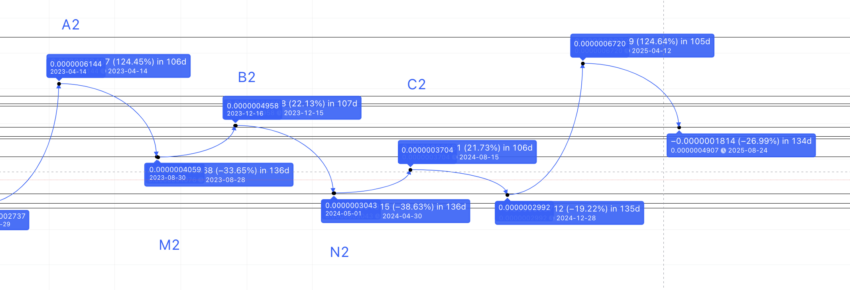
The Bitgert price prediction in 2024 or late 2023 surfaces at a high of $0.0000004958.
Projected ROI from the current level: 154%
Bitgert (BRISE) price prediction 2025
Outlook: Bullish
The next low, or N2, can show up at a drop of 38.81% — the minimum drop from the highs — and in 136 days. Therefore, the Bitgert price predictions for 2024 come up with another level, this time a low of $0.0000003043. This low or N2 would return a high of C2, surfacing at a high of 21.98% in 106 days max. This would return a high of $0.0000003704.
Now, previous patterns have shown that D would be higher than C, and the crypto market conditions improve. But to find D2 as per the future Bitgert price predictions, we first need to locate the next low or O2. From C2, this drop could be in 136 days and should take support at $0.0000002992. This could be Bitgert’s lowest level in 2024.
Therefore, the BRISE price prediction for 2025 could surface at a high of 124.52% and in 106 days (maximum) — $0.0000006720. The low could take support at $0.0000004904 — a percentage drop of 26.99%.
Projected ROI from the current level: 244%
Bitgert (BRISE) price prediction 2030
Outlook: Bullish
The next high, or E2, could surface at a high of 124.52% in 106 days from the low of 2025. Still, the distance can vary depending on the condition of the crypto market.
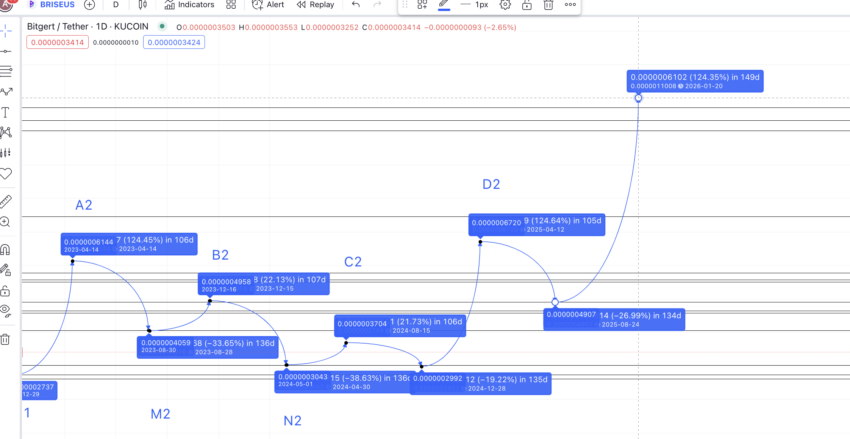
The next high or A2 surfaces in 2026 at $0.0000011. Now, we have the high in 2026 and 2025. We can connect the dots using the Fibonacci indicator to extrapolate the price action of BRISE till 2030. Let us see where that stands.
On tracing the same growth path, the Bitgert price prediction for 2030 could surface at $0.0000068. The low could be at a drop of 38.20% — which even aligns with our table-specific datasets. The minimum price of Bitgert in 2030 can, therefore, surface at $0.0000043993.
Projected ROI from the current level: 3385%
Bitgert (BRISE) long-term price prediction until 2035
Outlook: Bullish
Do note that the Bitgert price predictions till 2030 do not realize the entire path of this native coin. The table below shows how the price of Bitgert is expected to move till 2035.
You can easily convert your BRISE to USD
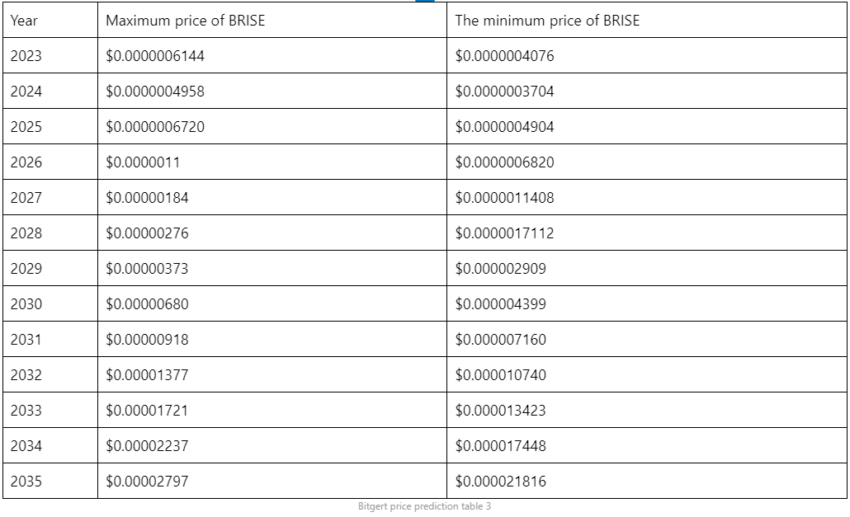
Notice that the average prices of BRISE, year-on-year, might vary depending on the overall market conditions.
Is this Bitgert price prediction model reliable?
This Bitgert price prediction piece takes technical analysis and pattern plotting very seriously. With many datasets to rely on, this BRISE token price forecast model looks fairly accurate and highly attainable. Plus, it also considers the market cap comparisons, token economics model, and fundamental analysis. All of which lend solidarity to this model.
Frequently asked questions
How high will Bitgert go?
Will BRISE reach 1 cent?
Is Bitgert brise a good investment?
Is Bitgert faster than Solana?
How much will Bitgert cost in 2030?
Disclaimer
In line with the Trust Project guidelines, the educational content on this website is offered in good faith and for general information purposes only. BeInCrypto prioritizes providing high-quality information, taking the time to research and create informative content for readers. While partners may reward the company with commissions for placements in articles, these commissions do not influence the unbiased, honest, and helpful content creation process. Any action taken by the reader based on this information is strictly at their own risk. Please note that our Terms and Conditions, Privacy Policy, and Disclaimers have been updated.