
Both the NEO/BTC and NEO/USD pairs have been declining since they reached their respective long-term descending resistance lines at the beginning of June.
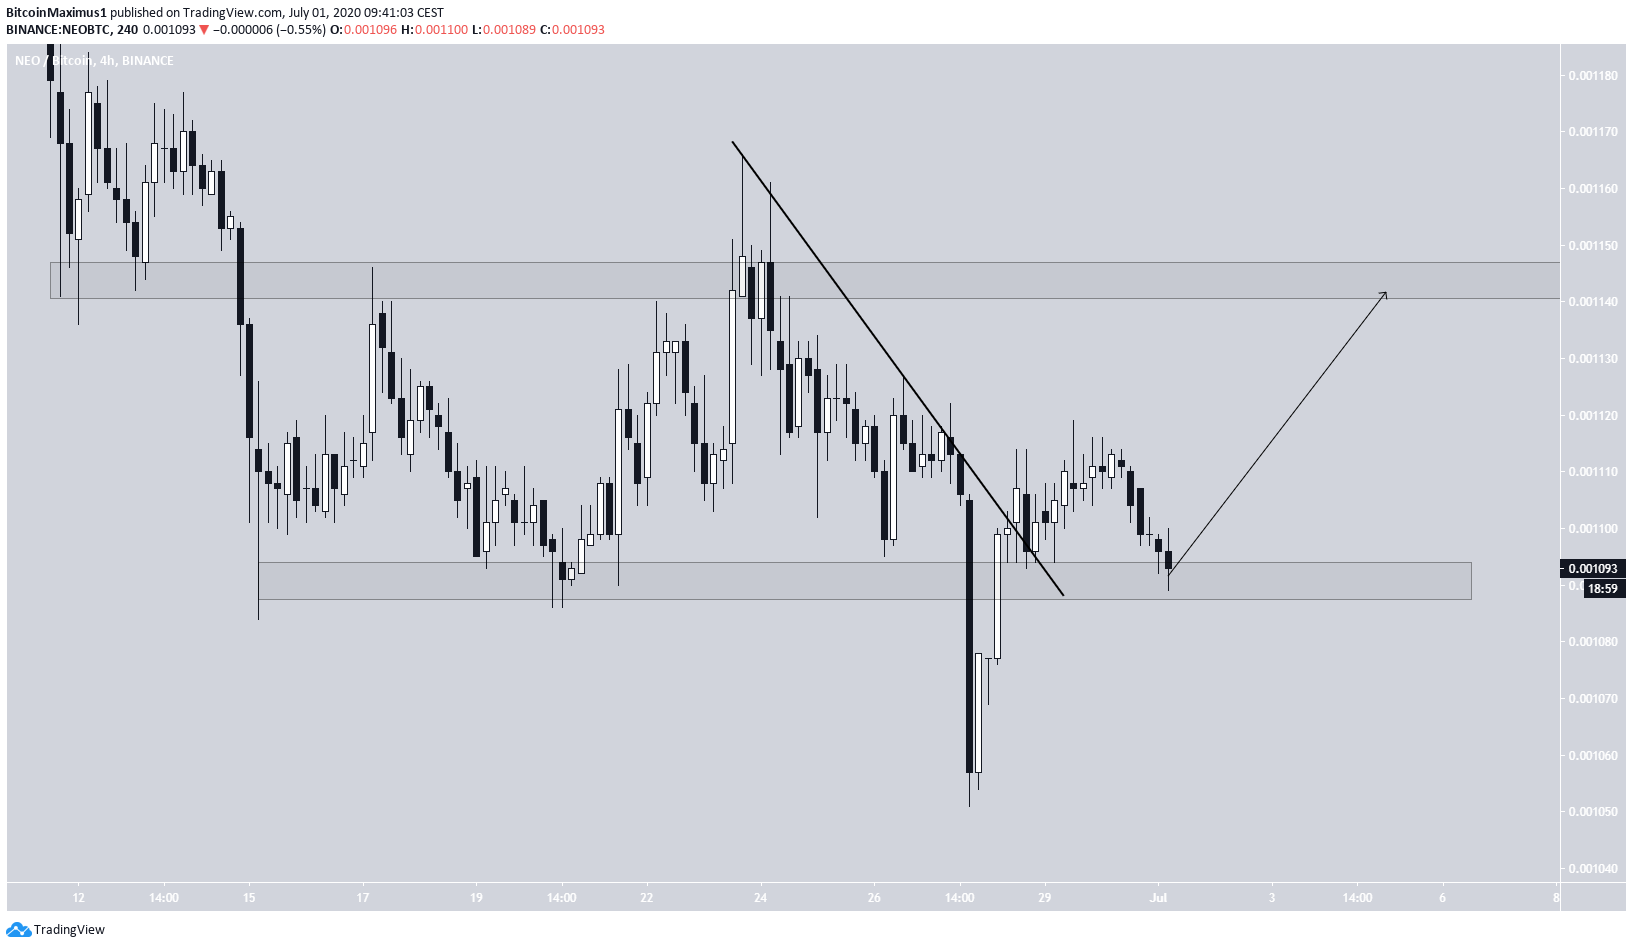
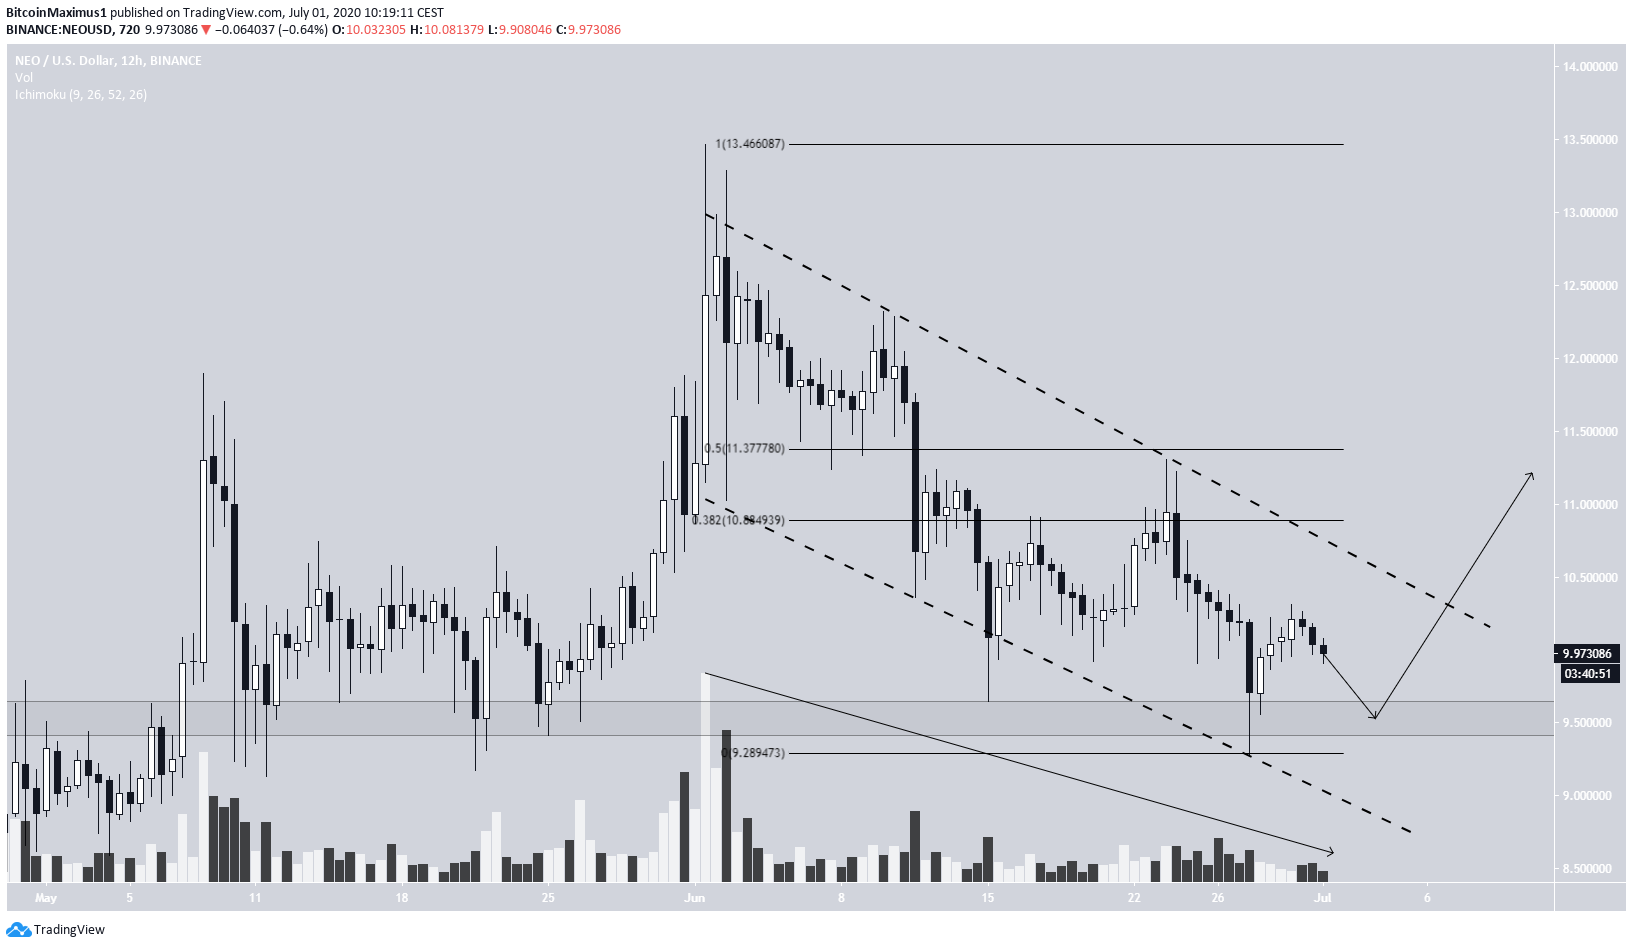
The short-term chart looks slightly more bullish for NEO/BTC than it does for NEO/USD.
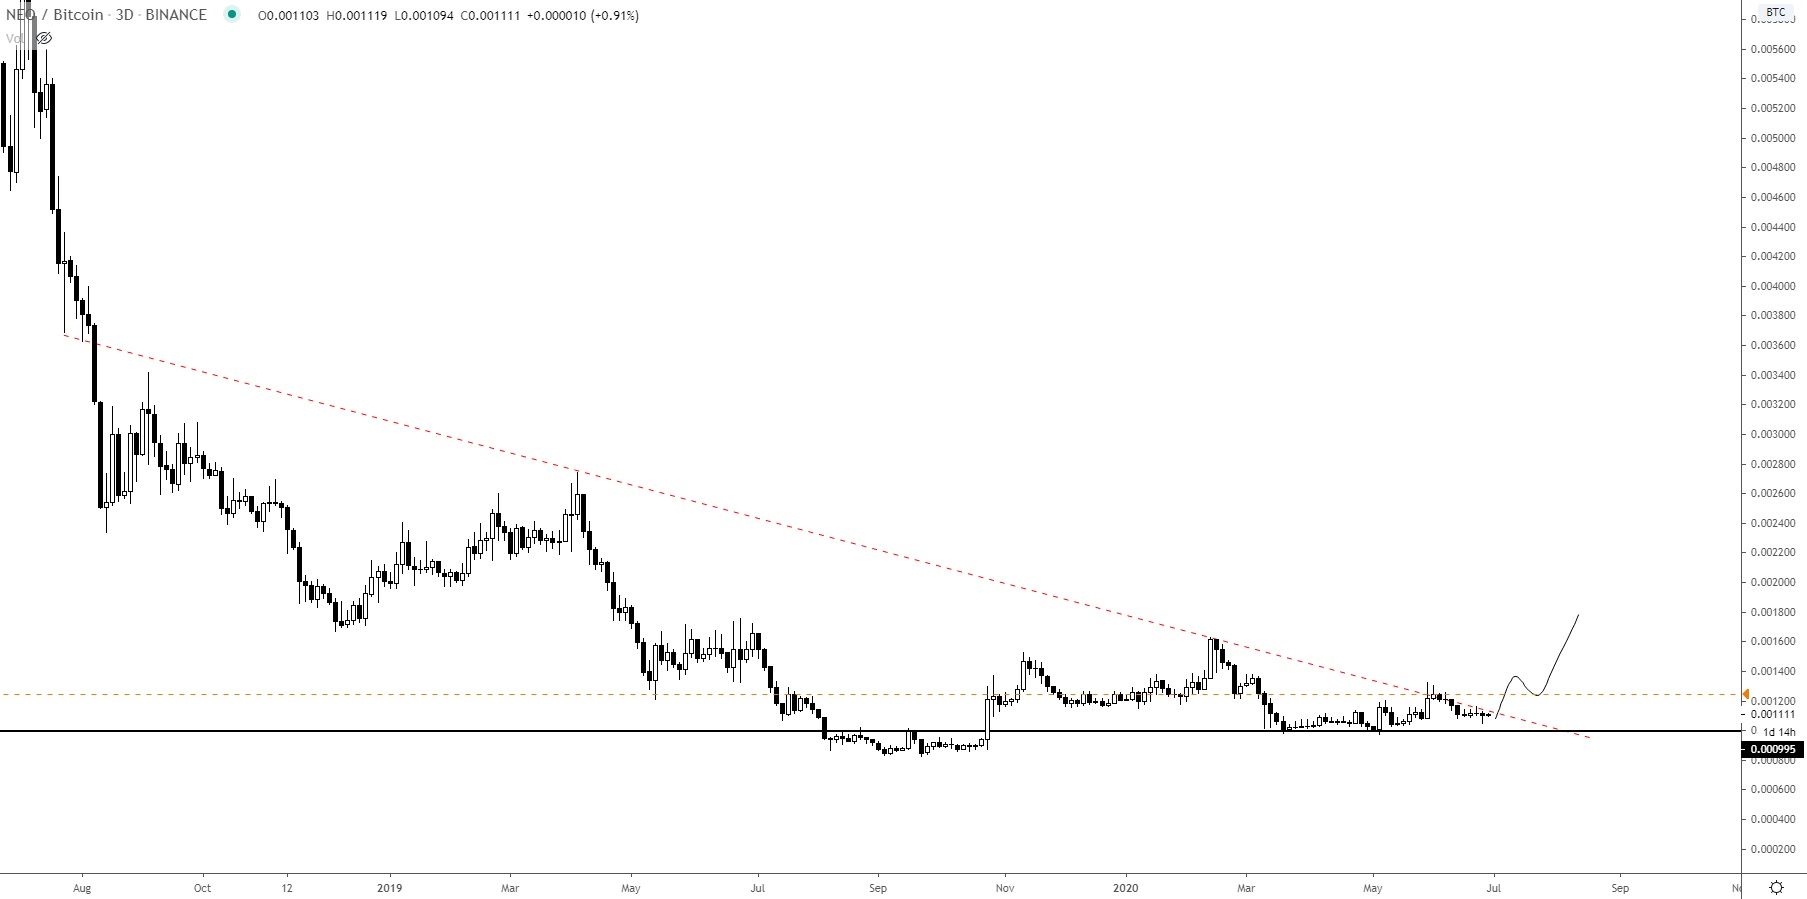
NEO/Bitcoin
The NEO price has been following a descending resistance line since September 2018. The price has been declining since it last touched this line on July 2. A breakout above would likely initiate a significant long-term upward trend. It is possible that it’s also following a shorter-term rising support line, whose slope is not entirely clear. These two lines combine to create a symmetrical triangle, which is considered a neutral pattern. The volume throughout this pattern has been higher on bullish candlesticks, culminating in a bullish engulfing candlestick on May 24.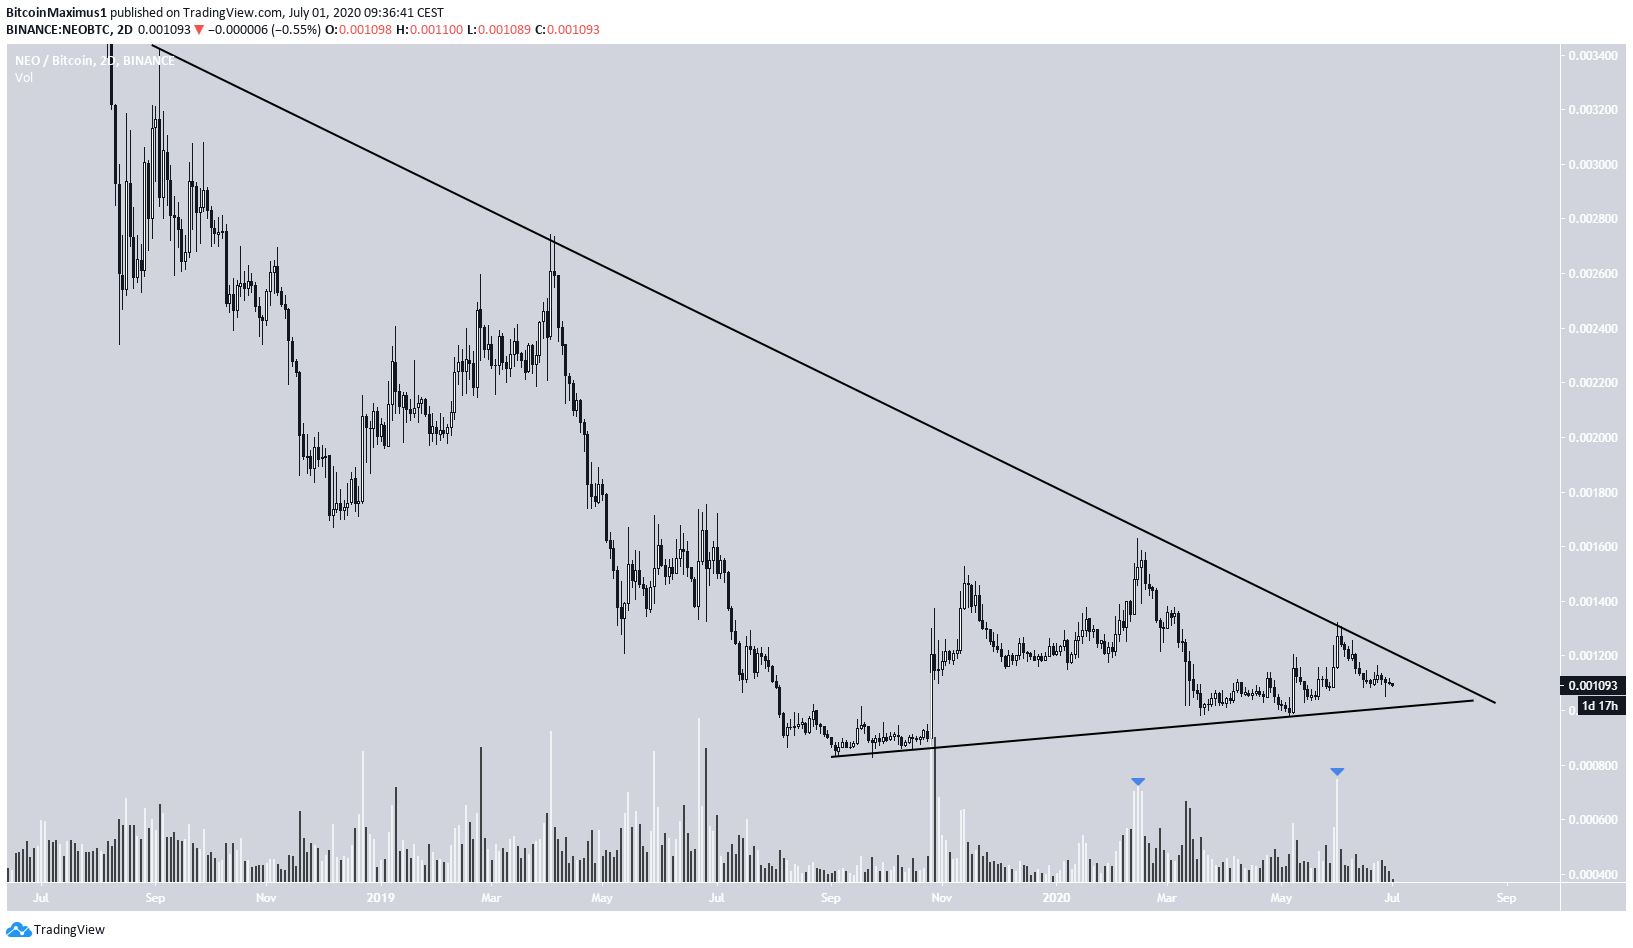
NEO/Dollar
The NEO/USD pair is also following a long-term descending resistance line. It has been decreasing since it last reached this line on July 1 when it created a shooting star candlestick. If the price continues declining, the closest support levels are found at $8.5 and $5.5, respectively.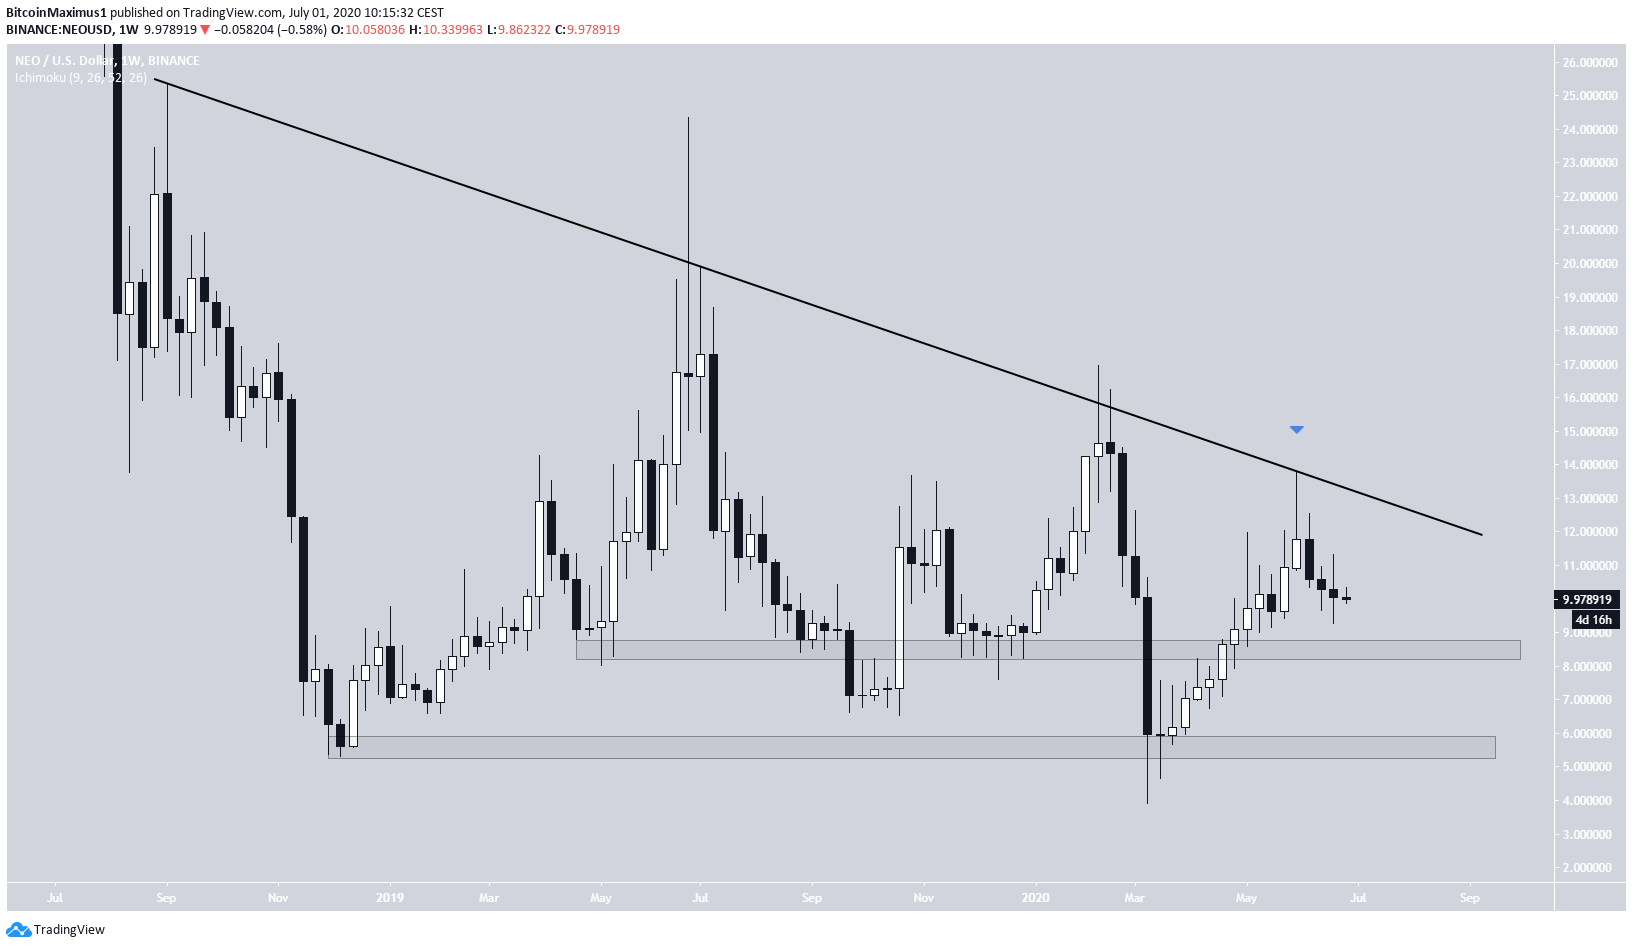
Top crypto projects in the US | April 2024
Trusted
Disclaimer
In line with the Trust Project guidelines, this price analysis article is for informational purposes only and should not be considered financial or investment advice. BeInCrypto is committed to accurate, unbiased reporting, but market conditions are subject to change without notice. Always conduct your own research and consult with a professional before making any financial decisions. Please note that our Terms and Conditions, Privacy Policy, and Disclaimers have been updated.

Valdrin Tahiri
Valdrin discovered cryptocurrencies while he was getting his MSc in Financial Markets from the Barcelona School of Economics. Shortly after graduating, he began writing for several different cryptocurrency related websites as a freelancer before eventually taking on the role of BeInCrypto's Senior Analyst.
(I do not have a discord and will not contact you first there. Beware of scammers)
READ FULL BIO
Sponsored
Sponsored