

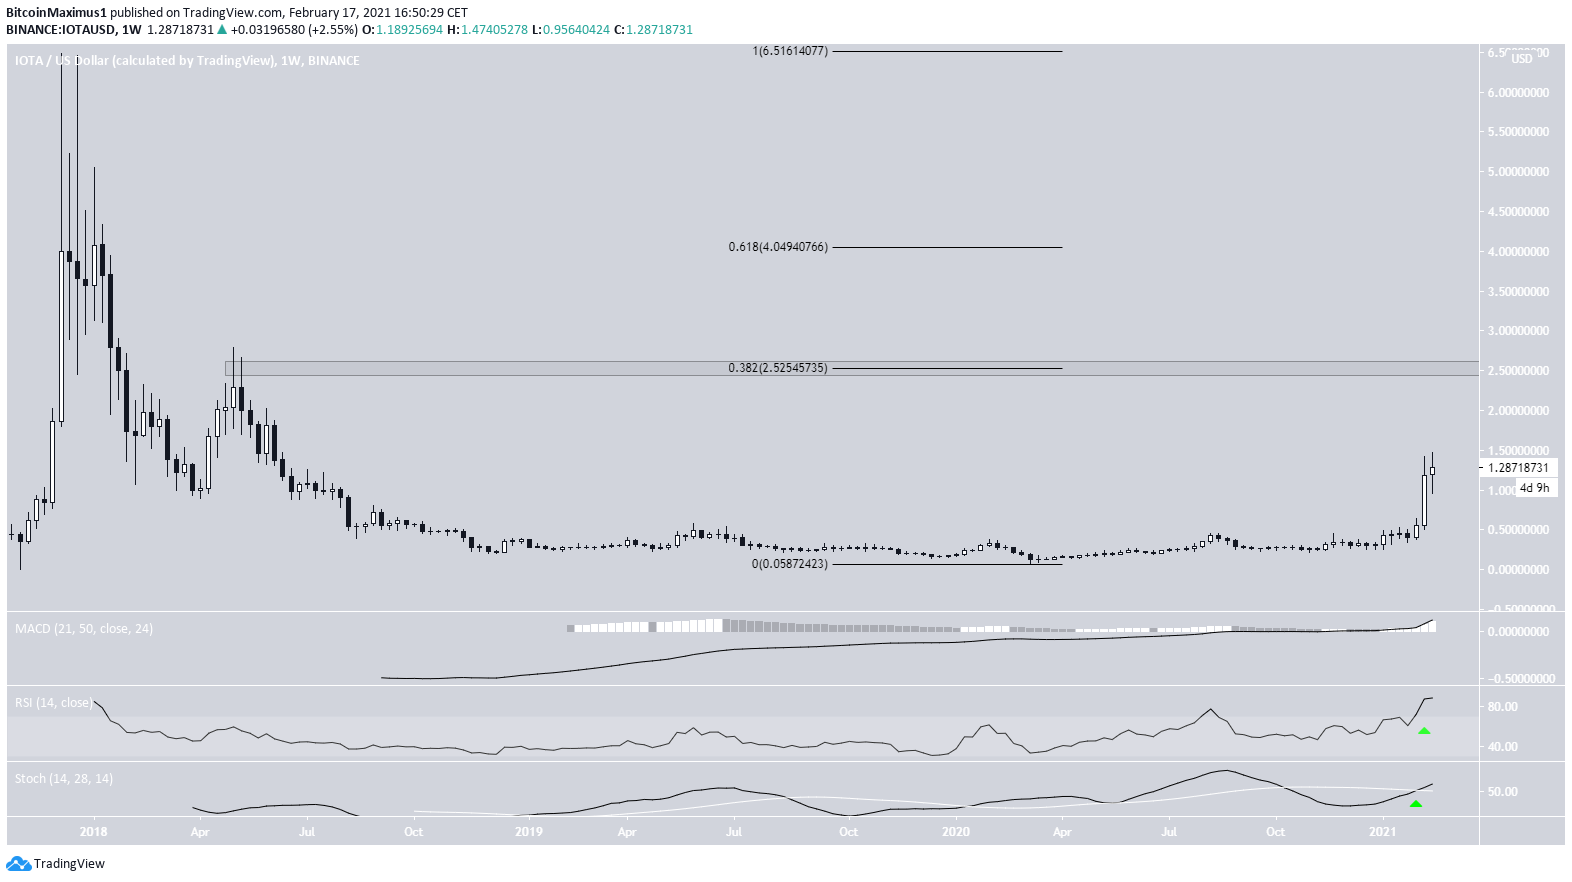
The IOTA (IOTA) price increased considerably during the week of Feb. 8 – 15 but failed to reach a crucial long-term resistance area at $2.50.
While the long-term chart suggests that IOTA will eventually reach this area, it’s not yet clear if the short-term downward move has ended or if another low awaits.
IOTA Approaches Long-Term Resistance
The weekly chart shows that IOTA has increased significantly during the previous week and has resumed its upward movement this week. So far, it has touched a high of $1.41, doing so on Feb. 13. This is the highest price since July 2018.
Despite the considerable ongoing upward move, it has yet to reach the 0.382 Fib retracement when measuring from the all-time high price of $5.25. $2.50 is also a horizontal resistance area. Thus it is likely to provide heavy resistance at some point.
Technical indicators on the weekly time-frame are bullish, as evidenced by the bullish cross in the Stochastic Oscillator and the RSI move above 70. Therefore, the trend is likely bullish, and IOTA should move upwards towards $2.50.
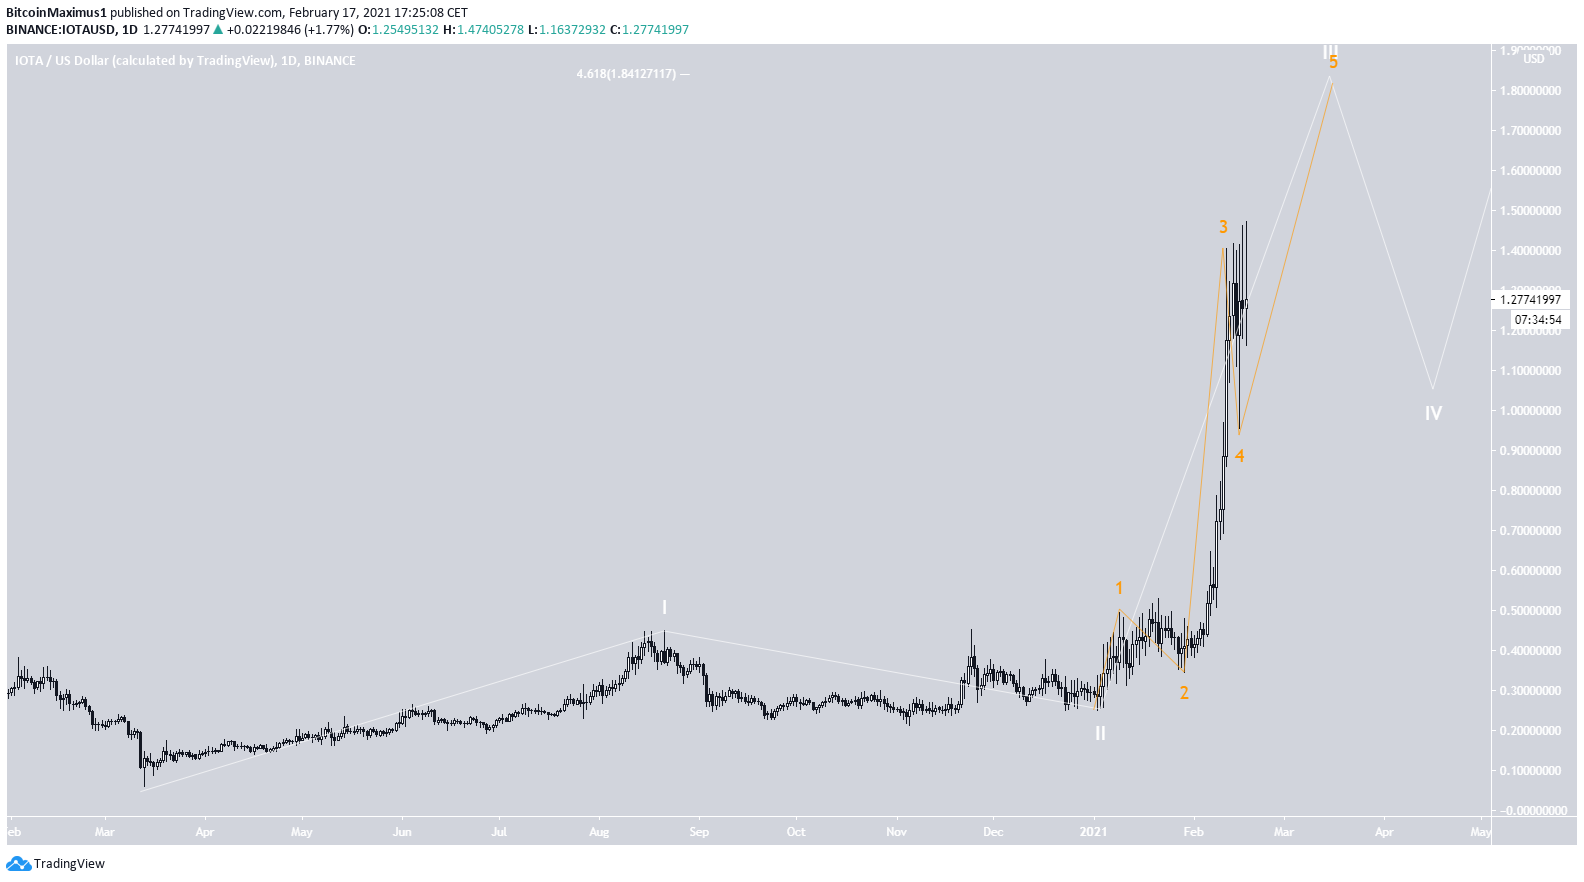
Wave Count
Cryptocurrency trader @Thetradinghubb outlined a chart, saying that the upward move is not yet done. He expects the price to gradually move towards an all-time high.

The wave count suggests that IOTA is in an extended third wave (white) of a bullish impulse that began on Mar. 2020. A possible target for the top of the third wave is at $1.84, found using the 4.61 Fib extension on wave one.
The sub-wave count is in orange, indicating that IOTA is in sub-wave four, which is corrective.
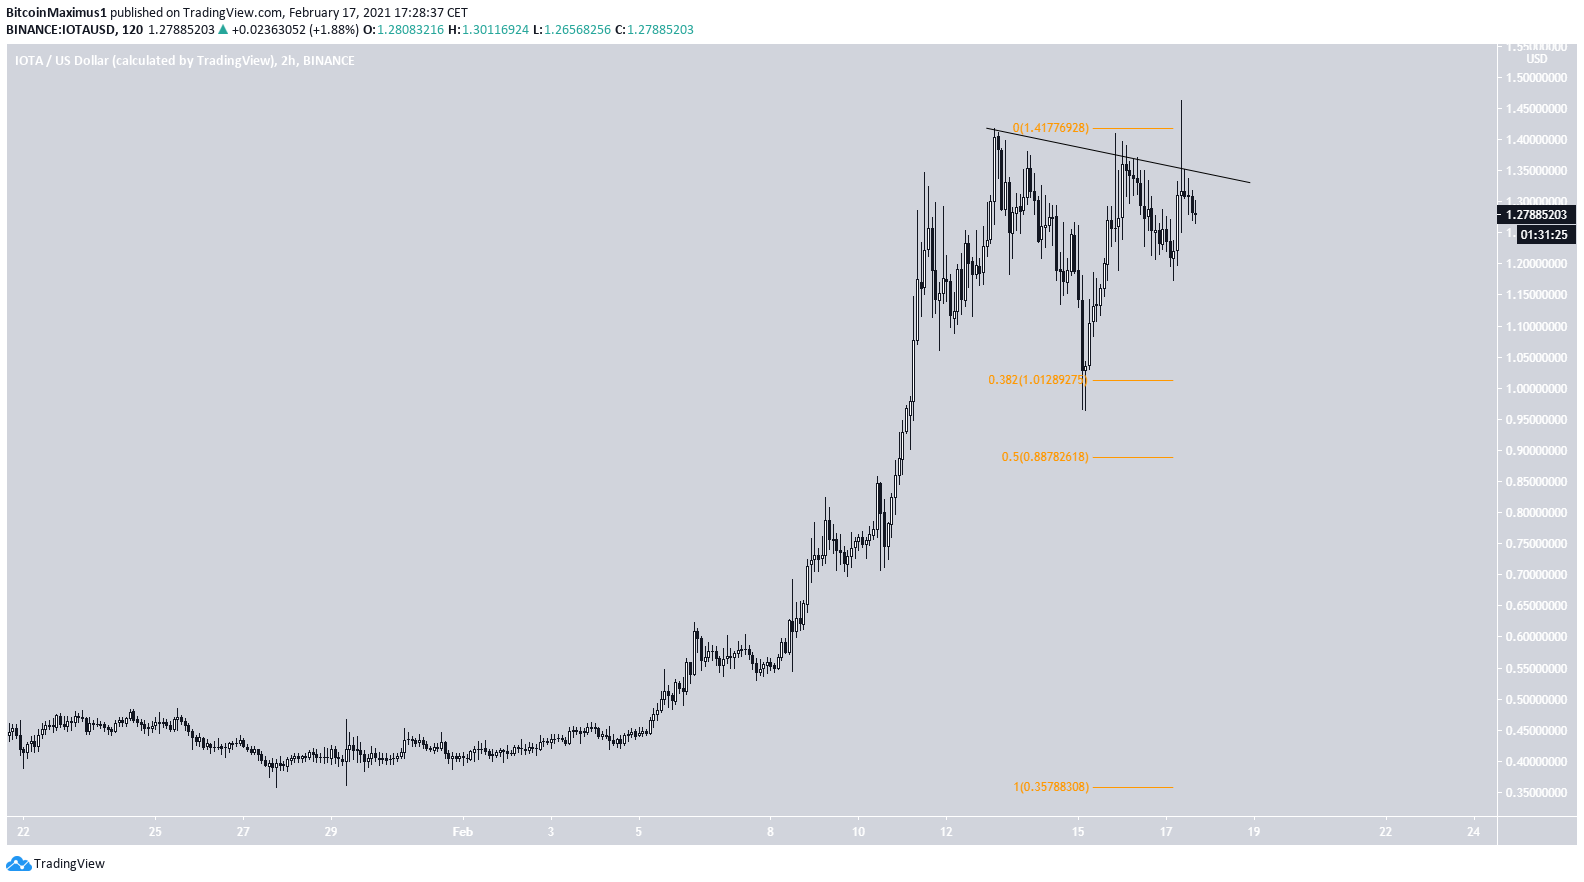
However, the shorter-term two-hour chart fails to show if it has completed sub-wave four or if there is another low to come.
IOTA has been following a descending resistance line, which it fell back from earlier today (Feb 17). If it manages to break out and close above, it would confirm that sub-wave four has ended and sub-wave five has begun.
If not, IOTA will likely retest the $1.01 support area, or possibly go lower towards $0.88.
IOTA/BTC
Similar to its USD counterpart, IOTA/BTC also increased considerably last week.
IOTA managed to reclaim the 2,200 satoshi area during its rally, which previously acted as support. This is a bullish sign, indicating that the price will go higher.
Technical indicators also support the continuation of the upward move. The RSI has crossed above the 50 line, and the MACD histogram has turned positive.
A bullish cross in the Stochastic Oscillator would confirm that the trend is bullish. The next closest resistance area is at 2,950 satoshis.

Conclusion
To conclude, while IOTA should move higher towards $1.80 and possibly $2.50, it’s not clear whether the short-term correction has ended or not.
Since IOTA/BTC has reclaimed the previous breakdown level at 2,200 satoshis, it should continue moving upwards towards the next closest resistance area at 2,950 satoshis.
For BeInCrypto’s latest Bitcoin (BTC) analysis, click here.
Trusted
Disclaimer
In line with the Trust Project guidelines, this price analysis article is for informational purposes only and should not be considered financial or investment advice. BeInCrypto is committed to accurate, unbiased reporting, but market conditions are subject to change without notice. Always conduct your own research and consult with a professional before making any financial decisions. Please note that our Terms and Conditions, Privacy Policy, and Disclaimers have been updated.
