

Let’s analyze both these charts and see where the price is heading to next.$IOTA #IOTA
— Michaël van de Poppe (@CryptoMichNL) January 13, 2020
This one is showing a similar picture in the $USD pair. Acting against resistance. Either flipping that would be a long or otherwise retest of green.$BTC pair; needs to hold 2250-2270 as support and then we can aim for 2670.
Interesting PA. pic.twitter.com/OEsI65EnrO
IOTA Resistance Area
The IOTA price has been decreasing since September 21, 2019, when it reached a high of $0.315. The price began creating all-time lows in December 2019 and bottomed out at $0.148 on December 18. The price has been increasing since. Currently, it is trading inside the $0.20 resistance area, which has previously acted as support. The price has created two long upper wicks, hence the bearish retest outlined in the tweet. The next resistance area is found at $0.23.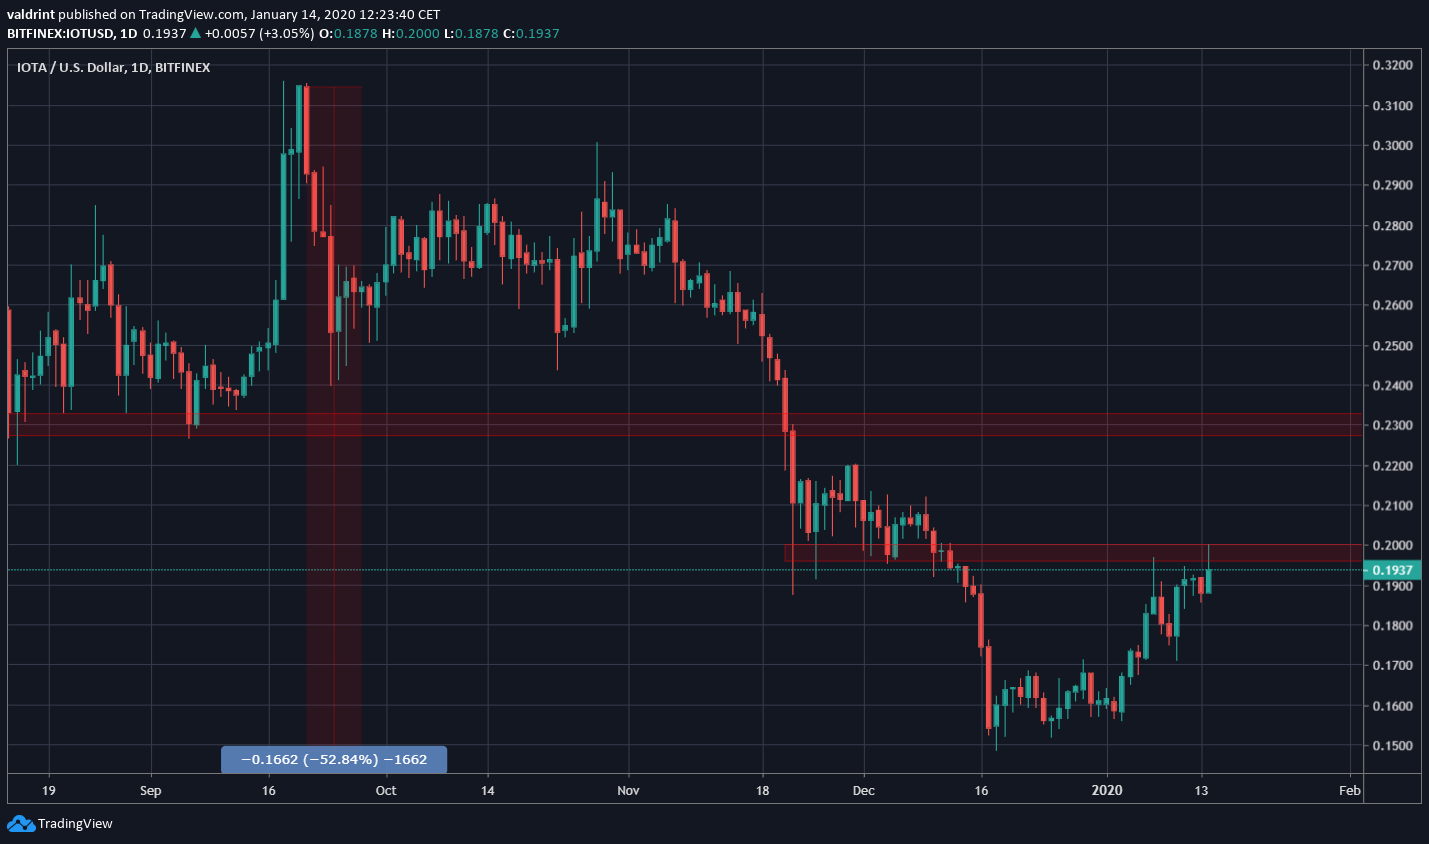
Parabolic Support
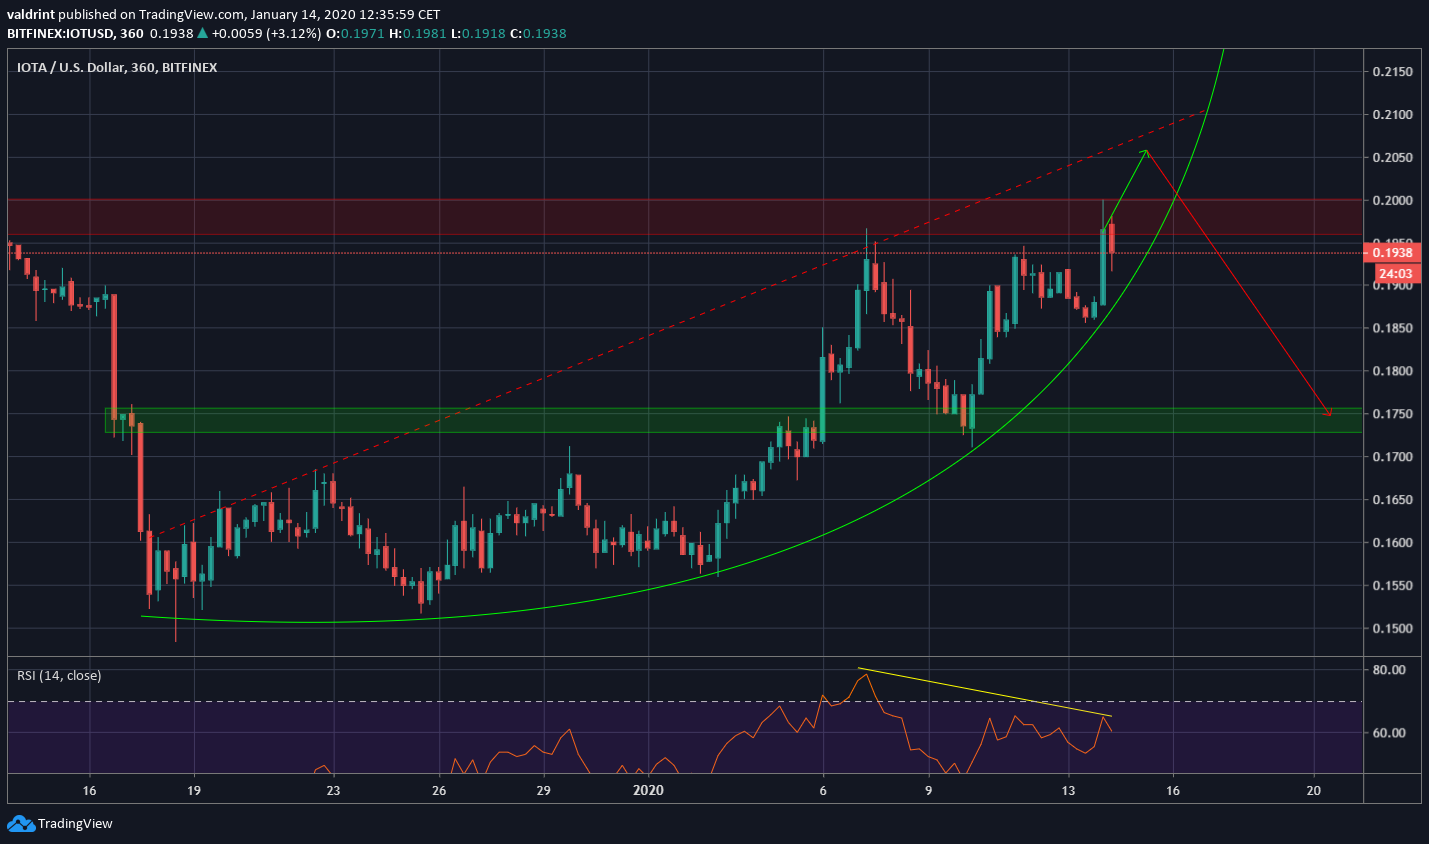
The price increase since the aforementioned bottom on December 18 has become parabolic. While this is unsustainable in the long-run, price increases at this rate can be extremely significant in a relatively short period of time. In addition, there is a possible ascending resistance line in place. The most probable outcome here would be a breakdown below the parabolic support line, after a possible increase above $0.2, most likely in the form of a wick.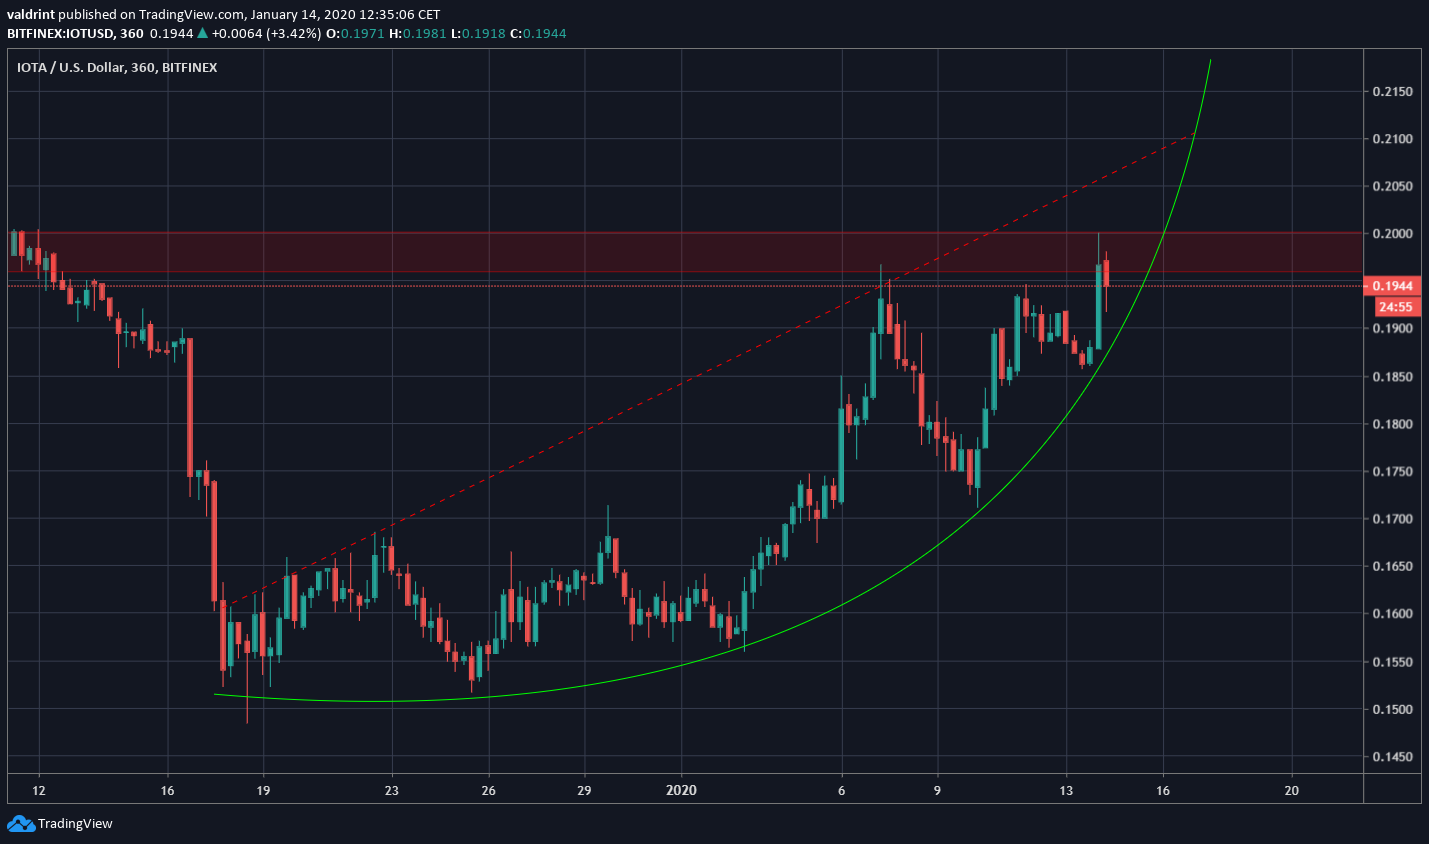 The price decrease is supported by the growing bearish divergence in the RSI. After the breakdown, the area that is most likely to provide support is found near $0.175, as outlined in the tweet.
IOTA/BTC
In the IOTA/BTC pair, the outlook is almost reversed. The price is trying to hold on to the 2285 satoshi support area, which also coincides with the ascending support line that has been in place since December 23.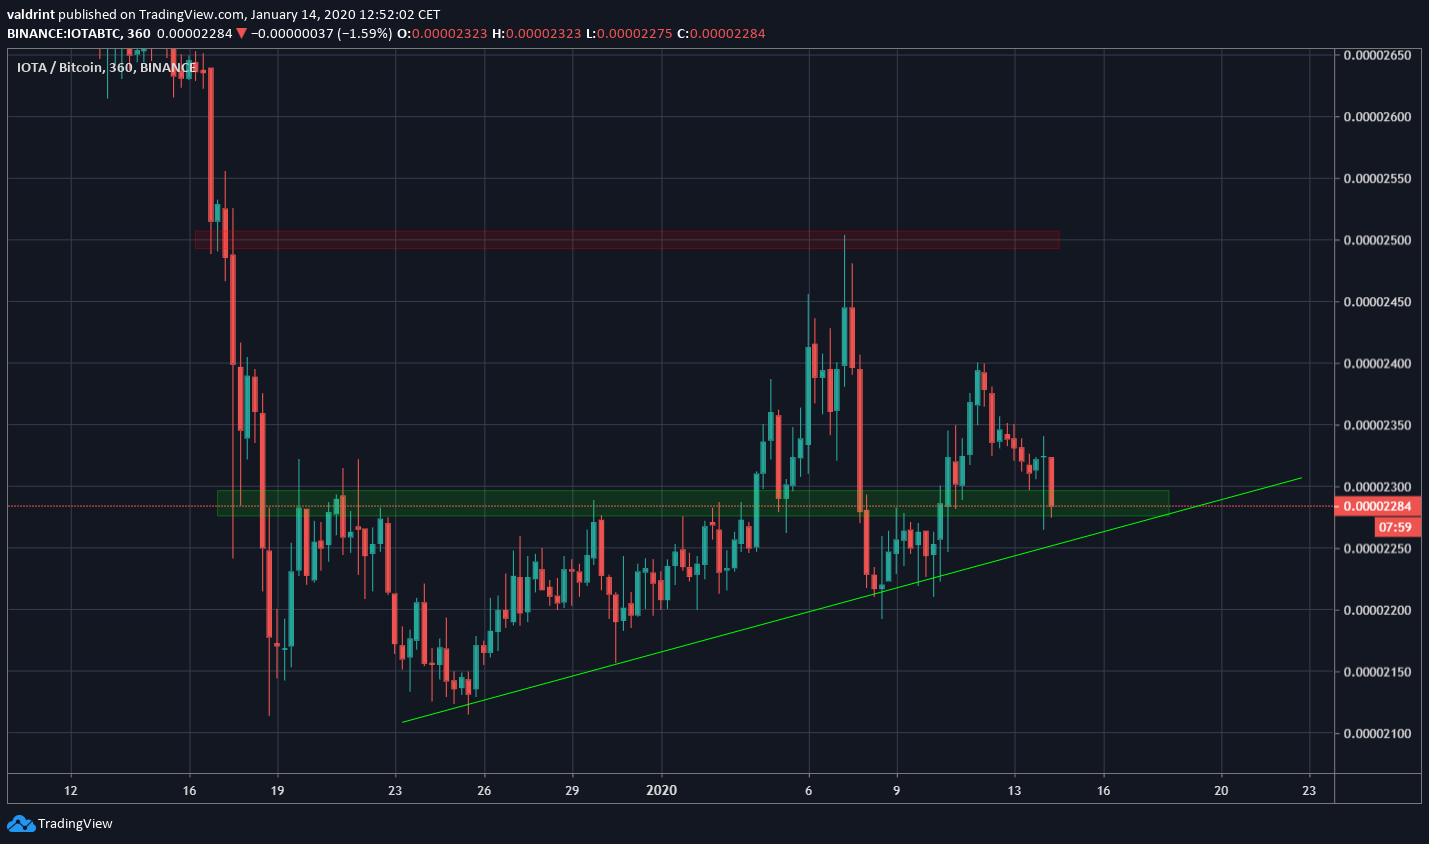 The long-term outlook does not bode well for the possibility of price increases. The price has been following a descending resistance line since October 24. The most recent time it touched it, it created a long upper wick and moved downward.
The resistance is solidified by the long-term moving averages (MA). The 100- and 200-week ones have made a bearish cross, while the 50-week one is providing close resistance to the price.
The long-term outlook does not bode well for the possibility of price increases. The price has been following a descending resistance line since October 24. The most recent time it touched it, it created a long upper wick and moved downward.
The resistance is solidified by the long-term moving averages (MA). The 100- and 200-week ones have made a bearish cross, while the 50-week one is providing close resistance to the price.
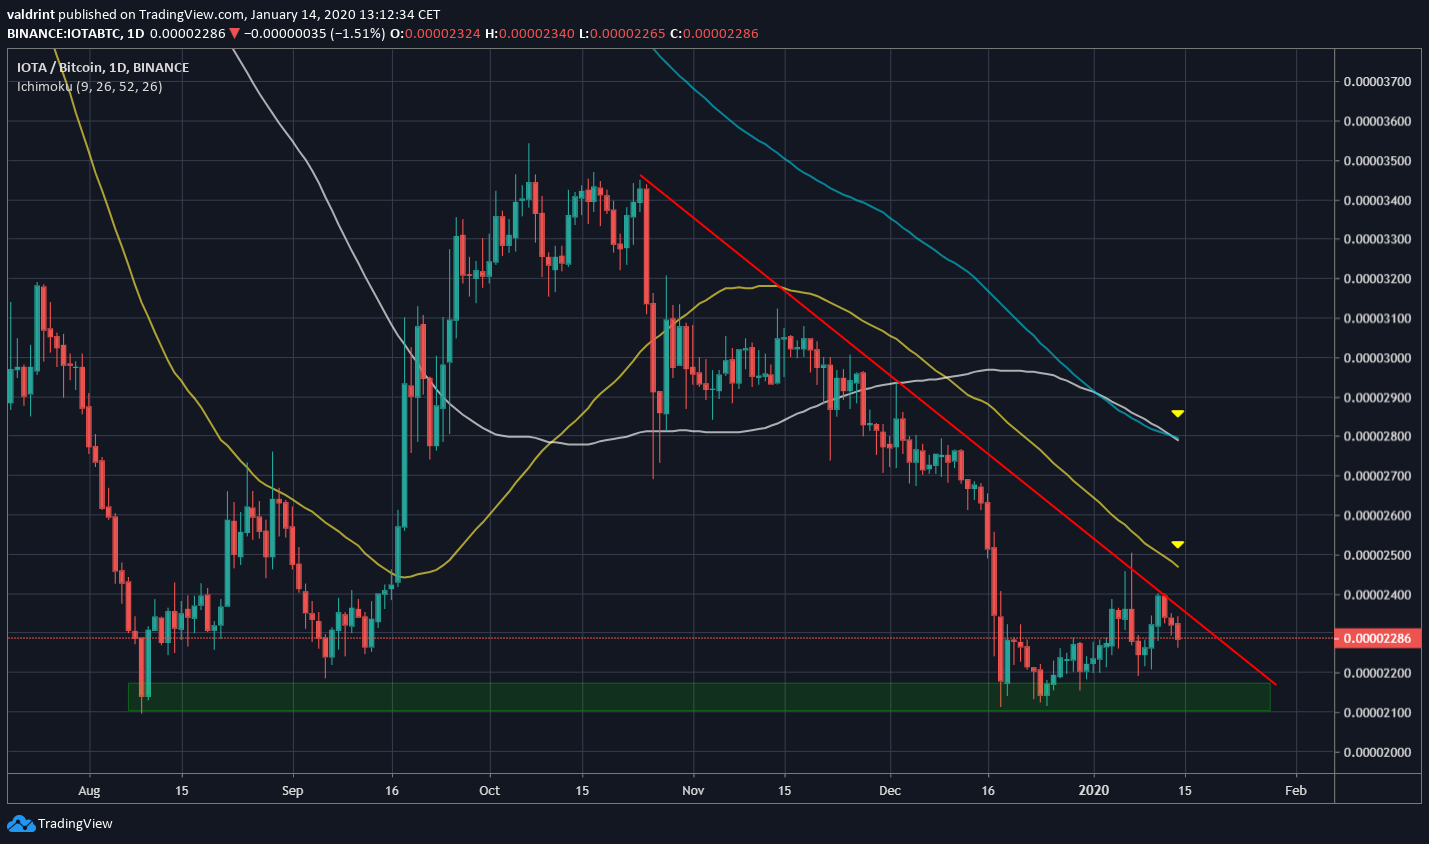 To conclude, the IOTA/USD pair has reached a strong resistance area and seems likely to decrease. This would also cause the IOTA/BTC pair to break down below the current ascending support line and revisit the 2100 satoshi lows.
 Trusted
Disclaimer
In line with the Trust Project guidelines, this price analysis article is for informational purposes only and should not be considered financial or investment advice. BeInCrypto is committed to accurate, unbiased reporting, but market conditions are subject to change without notice. Always conduct your own research and consult with a professional before making any financial decisions. Please note that our Terms and Conditions, Privacy Policy, and Disclaimers have been updated.
