

The IOTA (IOTA) price has broken out from a descending resistance line and has been increasing at an accelerated rate over the past three days.
The IOTA price has been increasing since June 27, when it initially dropped to the 2220 satoshi support area.
Resistance Line Breakout
Two days later, the price created a bullish hammer candlestick and broke out above a descending resistance line and 50-day moving average (MA) the following day. The price has been increasing at an accelerated rate since, and volume has also picked up. However, the price is facing resistance from the 200-day MA and has created a long upper-wick. If successful in moving above it, the closest resistance area would be found at 2,700 satoshis, which was the high from which the descending resistance line began.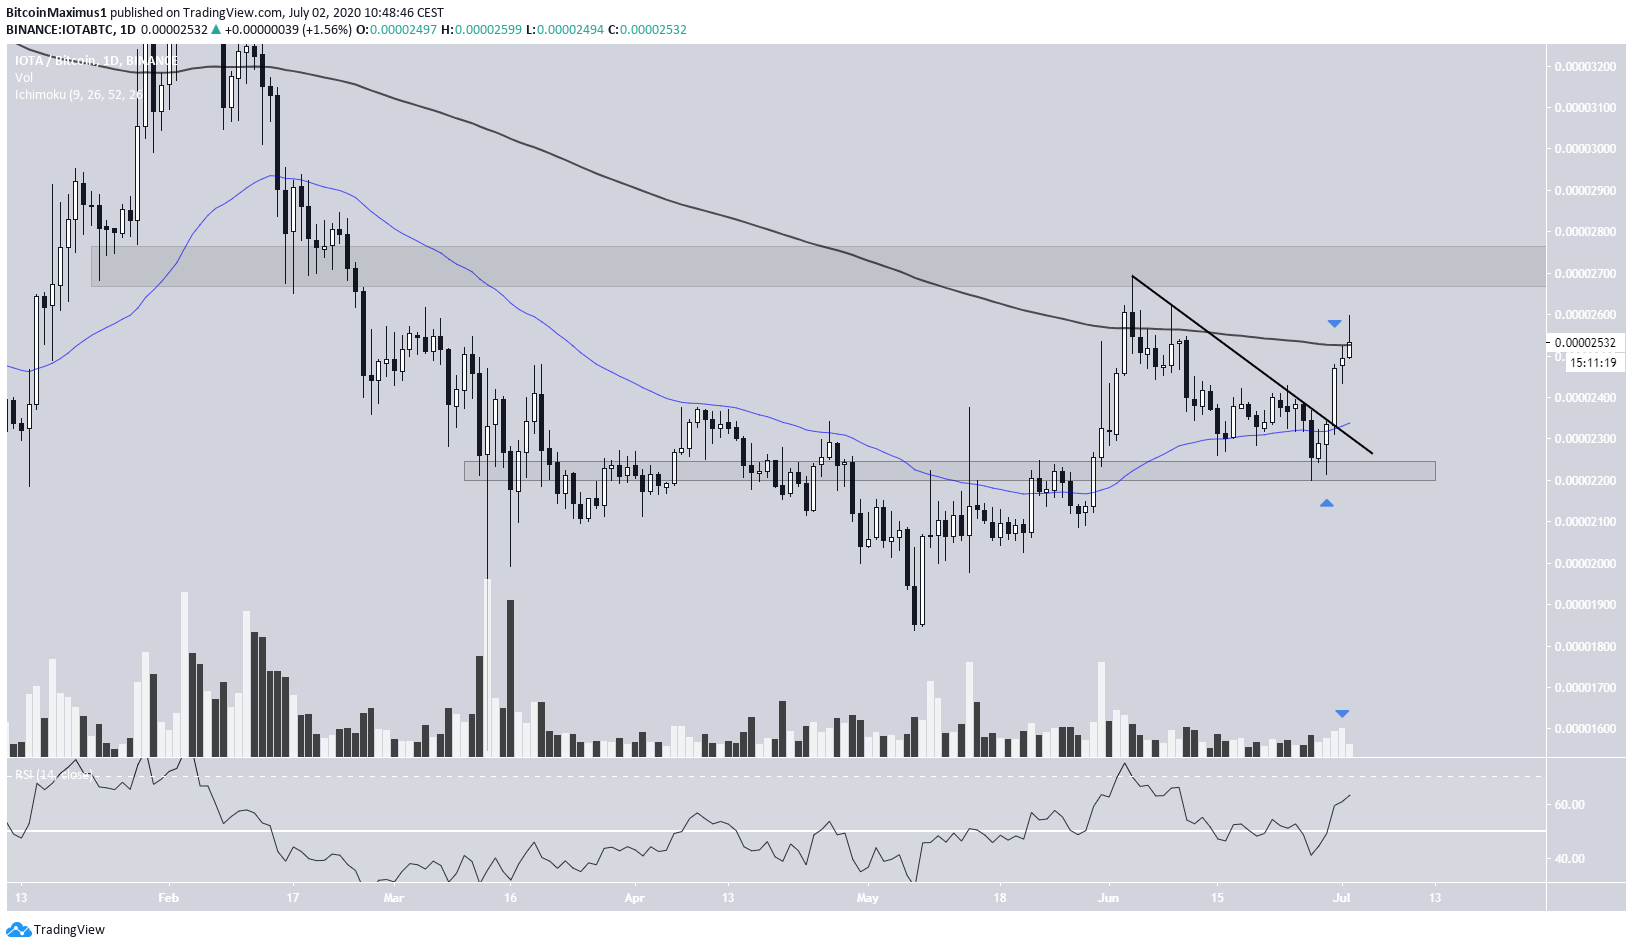
IOTA/Dollar
Similarly, the IOTA/USD pair has been increasing over the past five days. The price bounced at the $0.207 support area and afterward moved above the 50 and 200-day MAs, which have made a bullish cross. This often means that an upward trend has begun. If IOTA continues moving upwards, the next closest resistance levels would be found at $0.255 and $0.295.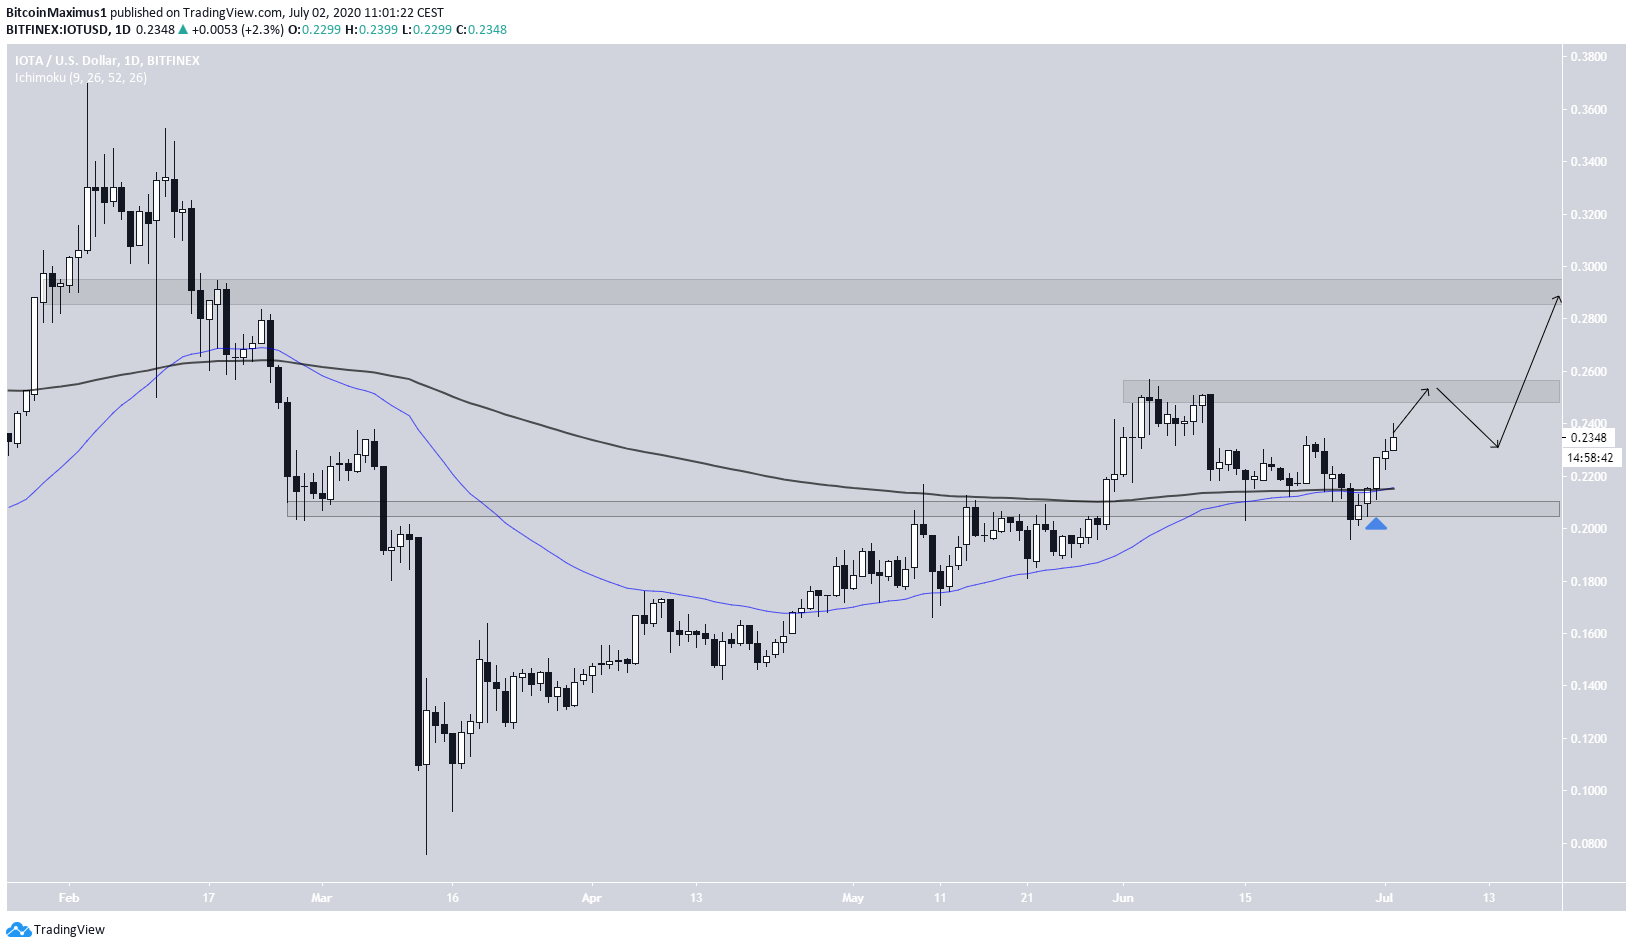
Top crypto projects in the US | April 2024
Trusted
Disclaimer
In line with the Trust Project guidelines, this price analysis article is for informational purposes only and should not be considered financial or investment advice. BeInCrypto is committed to accurate, unbiased reporting, but market conditions are subject to change without notice. Always conduct your own research and consult with a professional before making any financial decisions. Please note that our Terms and Conditions, Privacy Policy, and Disclaimers have been updated.

Valdrin Tahiri
Valdrin discovered cryptocurrencies while he was getting his MSc in Financial Markets from the Barcelona School of Economics. Shortly after graduating, he began writing for several different cryptocurrency related websites as a freelancer before eventually taking on the role of BeInCrypto's Senior Analyst.
(I do not have a discord and will not contact you first there. Beware of scammers)
READ FULL BIO
Sponsored
Sponsored