
ICON Price Highlights
- The ICON price broke out from a long-term bullish reversal pattern.
- There is major resistance at 5500 satoshis.
- The weekly RSI points to a reversal.
- There is minor support at 1600 & 1750 satoshis.
- There is minor resistance at 1900 & 2000 satoshis.
$ICX
— Nico (@CryptoNTez) January 21, 2020
UCTS displaying a 2D Buy signal after 8 months..
Zooming in:
Testing ~1750 sats resistance level (Matching EMA50) w/ increasing volume..
Starting to cross Ichi cloud on the 1D
Looking for a potential flip at this level as continuation to ~2300 sats (20%+)
Stay ready#ICX pic.twitter.com/oASVdOVrMe
All-Time Low ICON Price
Since the coin was launched, the 5500 satoshi area has offered support to the ICX price. This held true until May 6, 2019, when the price broke down. Afterward, the price continued decreasing and making successive all-time lows, culminating with a low of 1408 satoshis on January 8, 2020. The price has been increasing since. Over the past six months, the weekly RSI has been generating bullish divergence and has completed a failure swing bottom. This suggests that a reversal is near.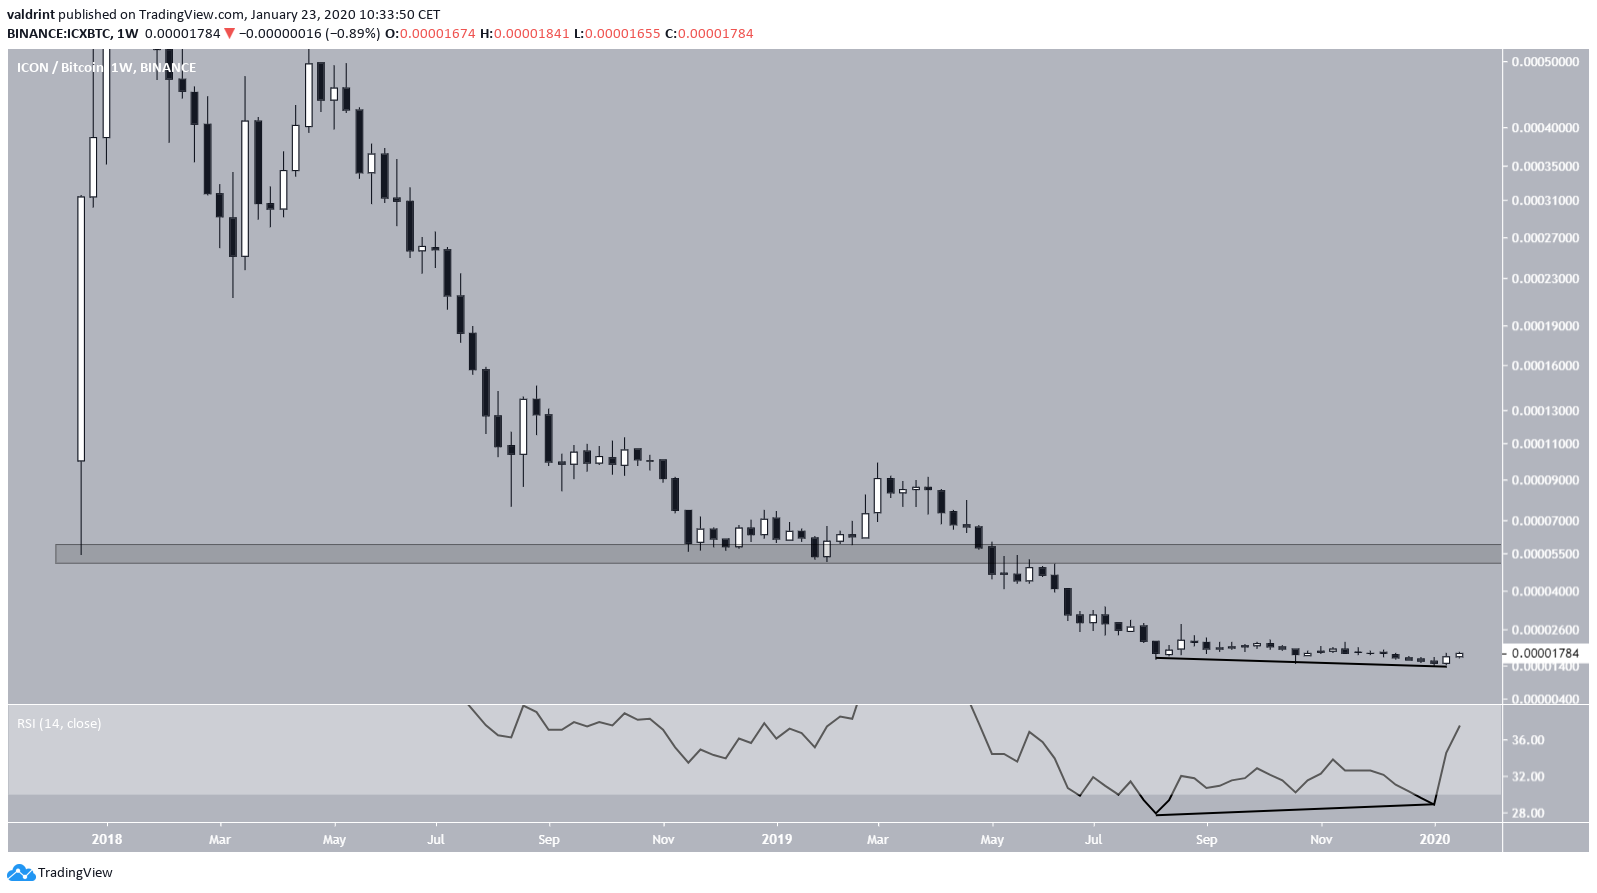
Wedge Breakout
Beginning on August 9, 2019, the ICON price created a descending wedge. This marks approximately the entire time that the weekly RSI generated bullish divergence. On January 20, the ICX price broke out above this wedge and seemingly validated it as support. The breakout was gradual since there was no price spike with high volume to confirm it. At the current time, the price is trading above the 100-day moving average (MA) but below the 200-day one. A price movement above both combined with a bullish cross of these MAs would confirm that the price has begun an upward trend.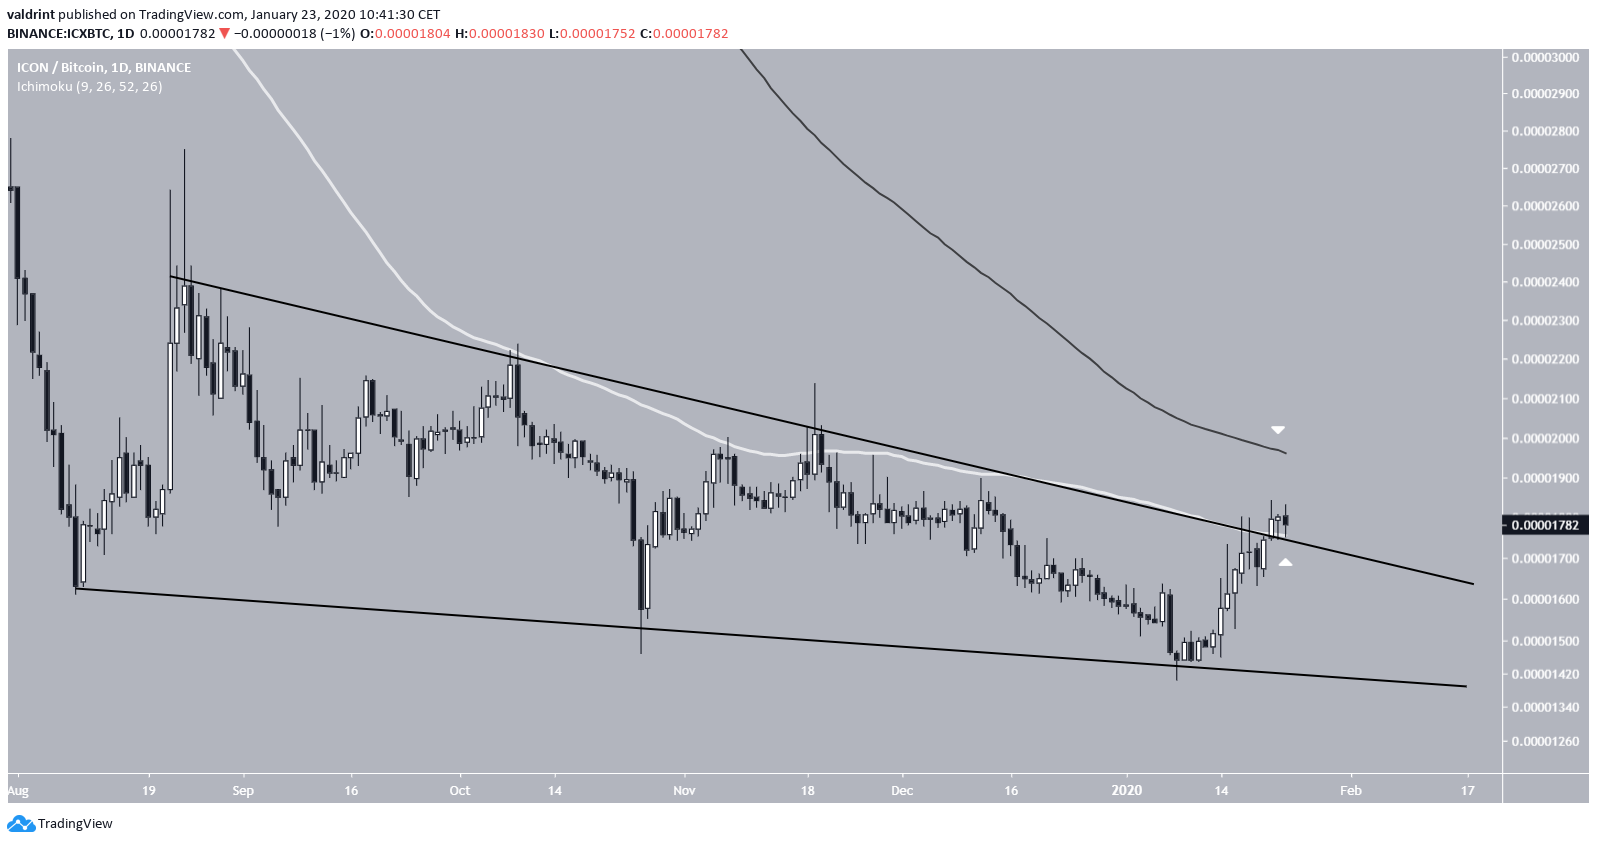
Minor Trading Areas
The ICON price has just successfully flipped the 1750 satoshi area as support and is moving upward. The price has yet to show any weakness. The closest resistance areas are found at 1900 and 2000 satoshis. Conversely, there is support below the current price at 1600 satoshis. A decrease towards this area would complete an overthrow since the price would head back inside the descending wedge it had just broken out from. Therefore, we do not think this is likely, at least not in the short-term. On the other hand, it is possible that after the price reaches at least one of the resistance areas it comes back to the support area and validate the resistance line of the wedge in the process.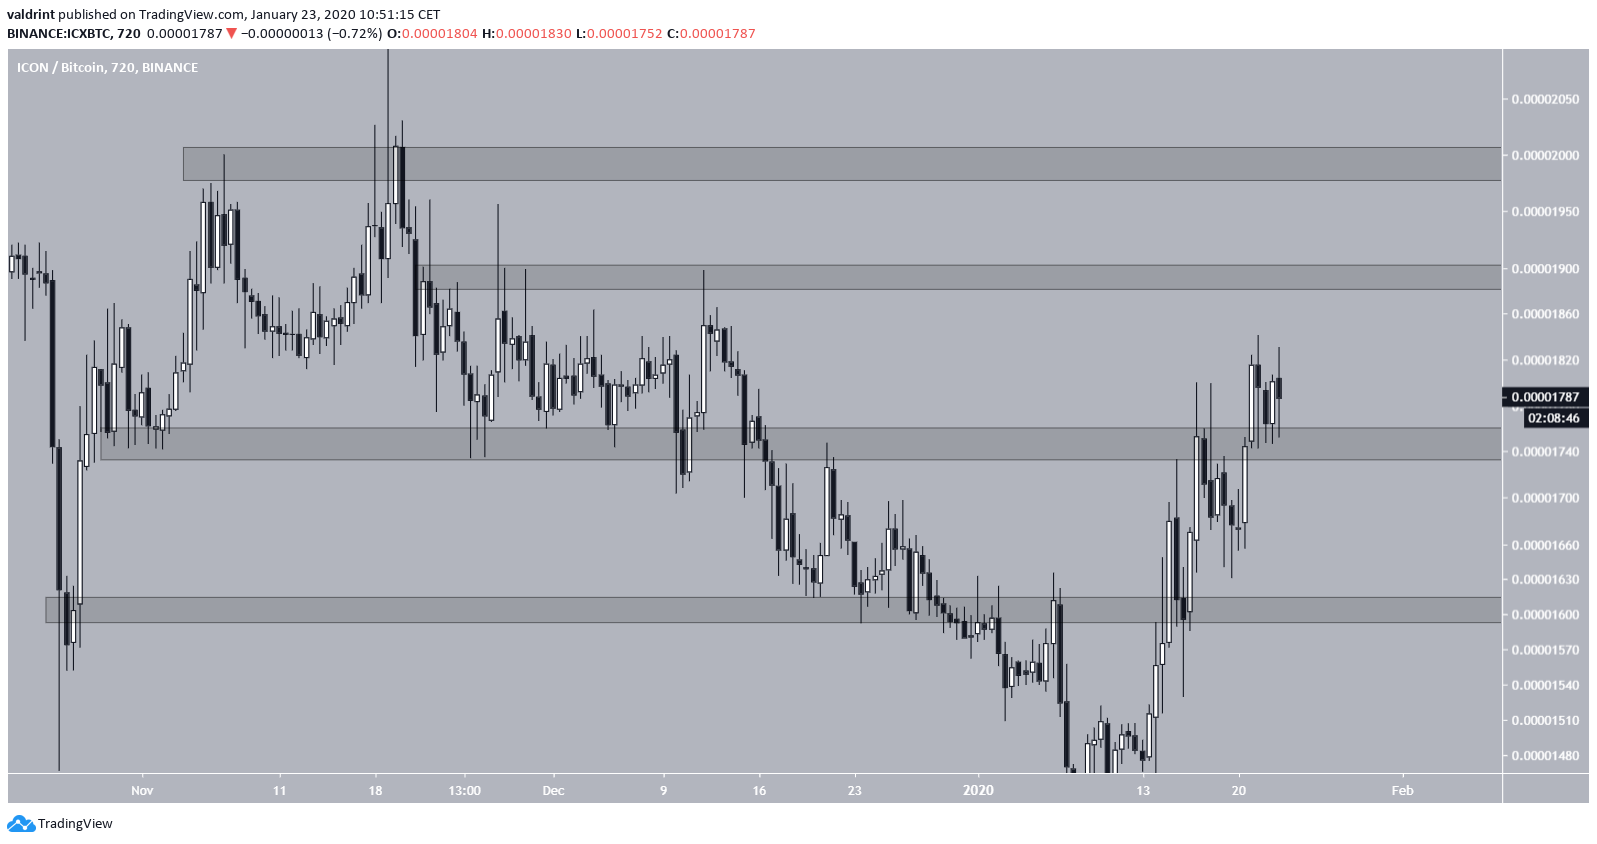 To conclude, the ICX broke out from a long-term bullish reversal pattern. In the short-term, we believe the increase is likely to continue until the price reaches at least one of the resistance areas outlined above. In the long-term, we have a bullish outlook for ICX.
 Trusted
Disclaimer
In line with the Trust Project guidelines, this price analysis article is for informational purposes only and should not be considered financial or investment advice. BeInCrypto is committed to accurate, unbiased reporting, but market conditions are subject to change without notice. Always conduct your own research and consult with a professional before making any financial decisions. Please note that our Terms and Conditions, Privacy Policy, and Disclaimers have been updated.
