

The Bitcoin price has been increasing rapidly since reaching a low on March 13. At the time of writing, BTC is trading a full 94% above the aforementioned low of $3,760.
Despite the massive increase, not everyone is convinced that BTC has already reached a bottom, One such individual is cryptocurrency trader @CryptoCapo_, who outlined a Bitcoin chart that shows the price movement since 2017.
In it, Capo has outlined eight separate time periods that show huge upward movements that were followed by a rapid decrease. in BTC history Therefore, he makes the suggestion that the current rally will end in a similar breakdown.This time is different… right? pic.twitter.com/VmYVX2YrVc
— il Capo Of Crypto (@CryptoCapo_) April 9, 2020
Bitcoin Bull Traps 2018
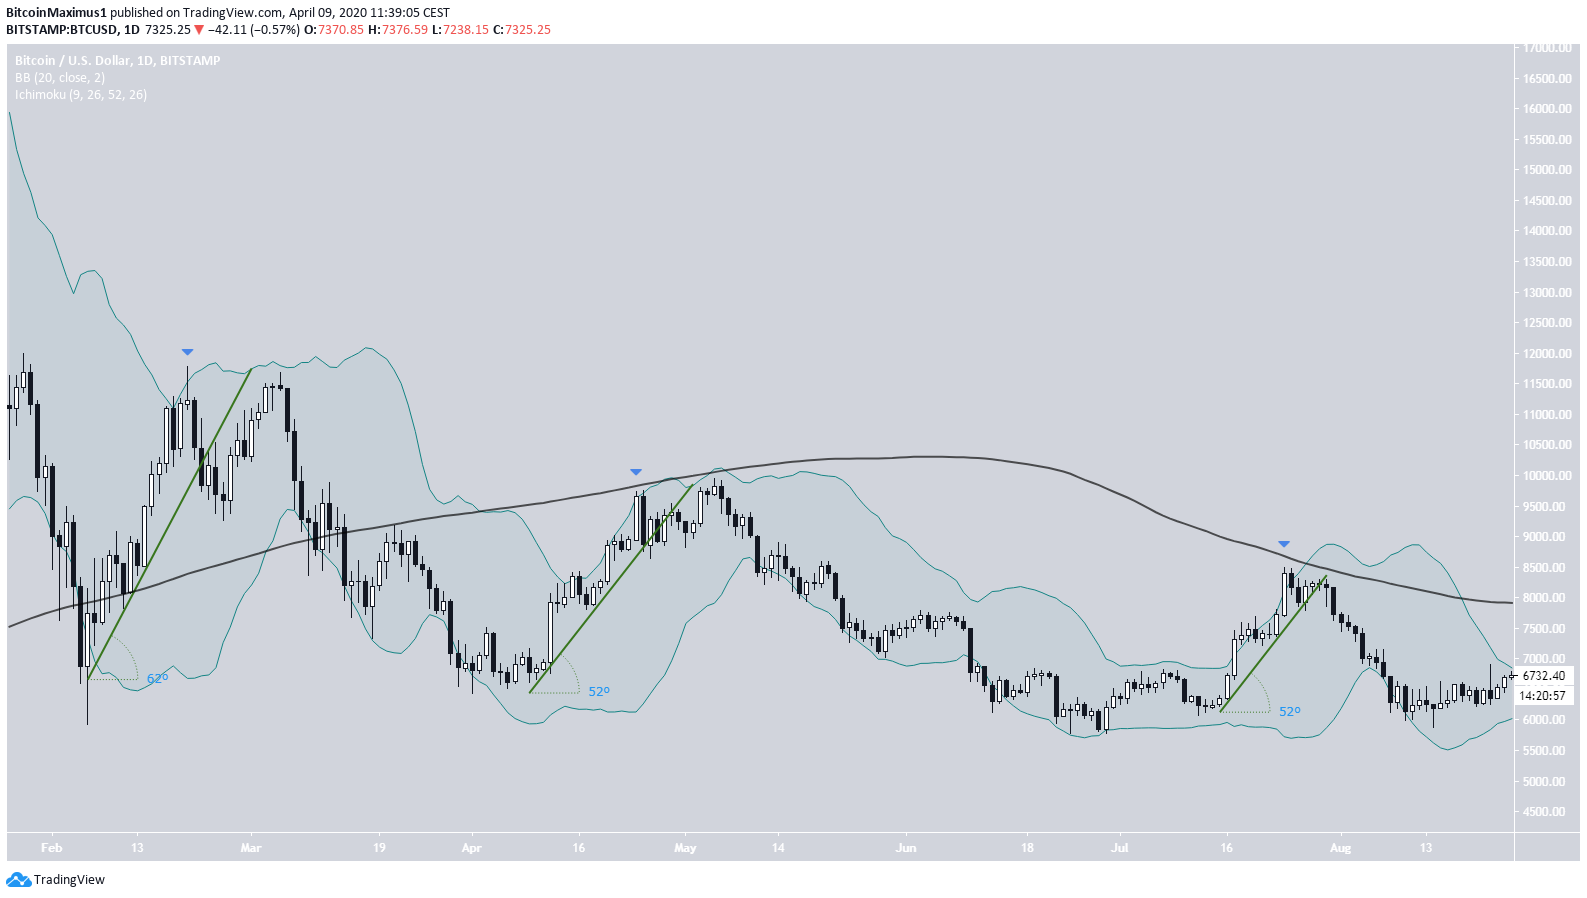
The first three upward moves outlined in the tweet transpired in February, April, and July of 2018. There are several characteristics that were present in each of them:- The upward moves had a slope steeper than 50°.
- The high prior to the breakdown was outside of the upper Bollinger Band (BB).
- The moves retraced by 100% after breaking down.
2018 to Present
Since the beginning of 2019, there have been four more similar patterns, transpiring in July and October of 2019 and January and March of 2020. The movement in January is entirely dissimilar to the others. Its slope is considerably less than 50 and the price never moved above the upper BB. Therefore, we will discount it from the rest of the discussion. However, the other three movements shared similar characteristics, most notably the extremely steep slopes and final highs that were reached above the upper BB. If the current upward move continues for an increase of 5% more, the price would once again be positioned above the upper BB and validate the 200-day MA as resistance. As we saw in the previous section, this proved to be the high point in most of the previous moves.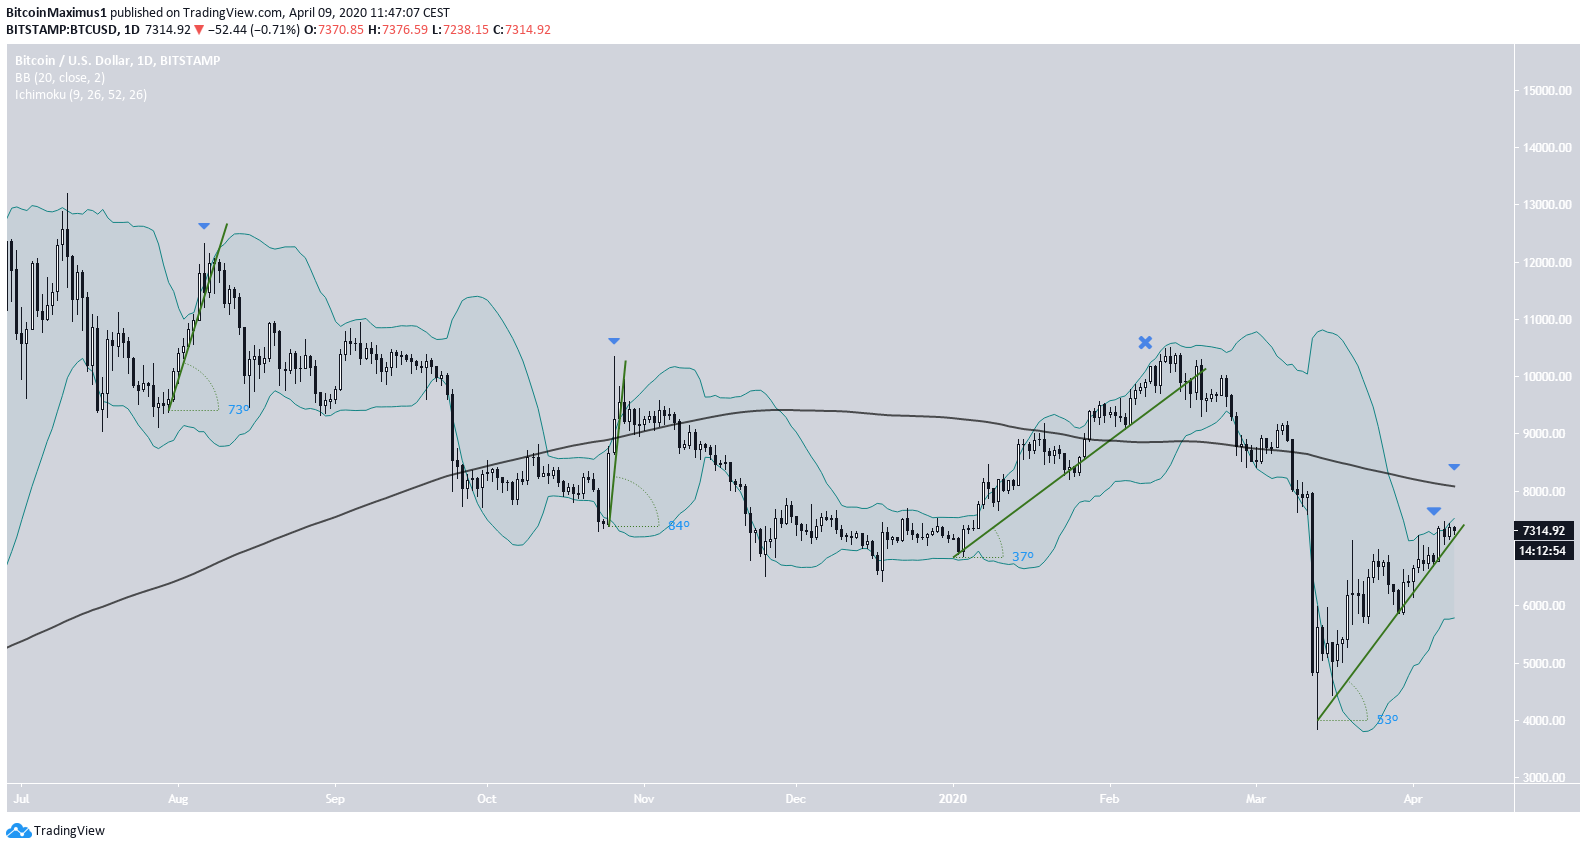
Top crypto projects in the US | April 2024
Trusted
Disclaimer
In line with the Trust Project guidelines, this price analysis article is for informational purposes only and should not be considered financial or investment advice. BeInCrypto is committed to accurate, unbiased reporting, but market conditions are subject to change without notice. Always conduct your own research and consult with a professional before making any financial decisions. Please note that our Terms and Conditions, Privacy Policy, and Disclaimers have been updated.

Valdrin Tahiri
Valdrin discovered cryptocurrencies while he was getting his MSc in Financial Markets from the Barcelona School of Economics. Shortly after graduating, he began writing for several different cryptocurrency related websites as a freelancer before eventually taking on the role of BeInCrypto's Senior Analyst.
(I do not have a discord and will not contact you first there. Beware of scammers)
READ FULL BIO
Sponsored
Sponsored