

HBAR, the native token of the Hedera ecosystem, made a high of $0.924 this year, a few clicks down from our 2023 prediction level. While the broader crypto market rally had much to do with this price rise, we shall consider the wider picture herein. This HBAR price prediction discussion will focus on the Hedera network’s current state and future price action. We delve into the fundamental, on-chain, and price analysis of HBAR to prepare an exhaustive and practical price prediction model.
Want to get HBAR price prediction weekly? Join BeInCrypto Trading Community on Telegram: read HBAR price prediction and technical analysis on the coin, ask and get answers to all your questions from PRO traders! Join now
Hedera Hashgraph fundamentals and the expected future price action
- Hedera Hashgraph fundamentals and the expected future price action
- HBAR price forecast and the involved tokenomics
- HBAR price prediction and other key metrics
- HBAR price prediction and technical analysis
- Hedera Hashgraph (HBAR) price prediction 2023
- Hedera Hashgraph (HBAR) price prediction 2024
- Hedera Hashgraph (HBAR) price prediction 2025
- Hedera Hashgraph (HBAR) price prediction 2030
- Hedera Hashgraph (HBAR’s) long-term price prediction until the year 2035
- Is the HBAR price prediction model accurate?
- Frequently asked questions
This article may be outdated, we suggest you visit our new Hedera Price Prediction tool.
For starters, Hedera is an enterprise-grade ecosystem for businesses and individuals. Focused on smart contracts, this decentralized network can power DApps for enterprises and businesses — making it highly relevant and fundamentally robust.
“Our developer tools are designed to empower you. We provide the platform; you bring the vision to life.
Hedera is more than technology; it’s a vibrant community of thinkers and creators shaping the future.”
Charles Adkins, President of Hedera: X
Coming to the consensus, the Hedera network features the proprietary Hashgraph consensus. This proof-of-stake-inspired novel consensus mechanism eliminates slowness whilst keeping the security quotient intact. But that’s not all that the proof-of-stake-based Hashgraph consensus promises. It also:
- Supports high-volume transactions and processes.
- Supports micropayments and tokenization — making it a good bet for enterprises.
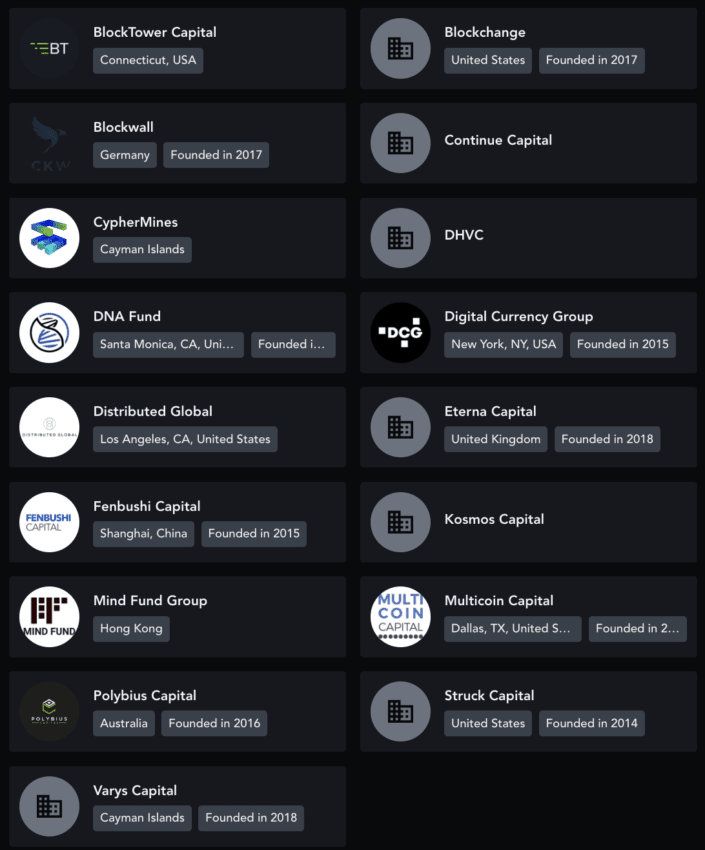
- This public network has an exhaustive list of investors.
HBAR, its native token, is primarily meant for powering the entire ecosystem. Using HBAR, participants can pay for micropayments and transaction fees. Plus, network participants can use the HBAR tokens for staking, which adds a thing or two to the overall network security. And finally, HBAR is also used for paying staking rewards to the nodes.
Did you know? Hedera is based on the novel Hashgraph technology that can process transactions securely and quickly. This technology can handle thousands of transactions at once.
Inference: As a project, Hedera Hashgraph looks robust enough. And its native token comes with a host of utilities, making us more optimistic about the future price of the same.
HBAR price forecast and the involved tokenomics
HBAR, the native token of this public network, has a 50 billion supply cap. The initial supply breakdown chart shows that only 17.45% went to the investors, whereas over 80% of the fixed supply belongs to the founders/project.
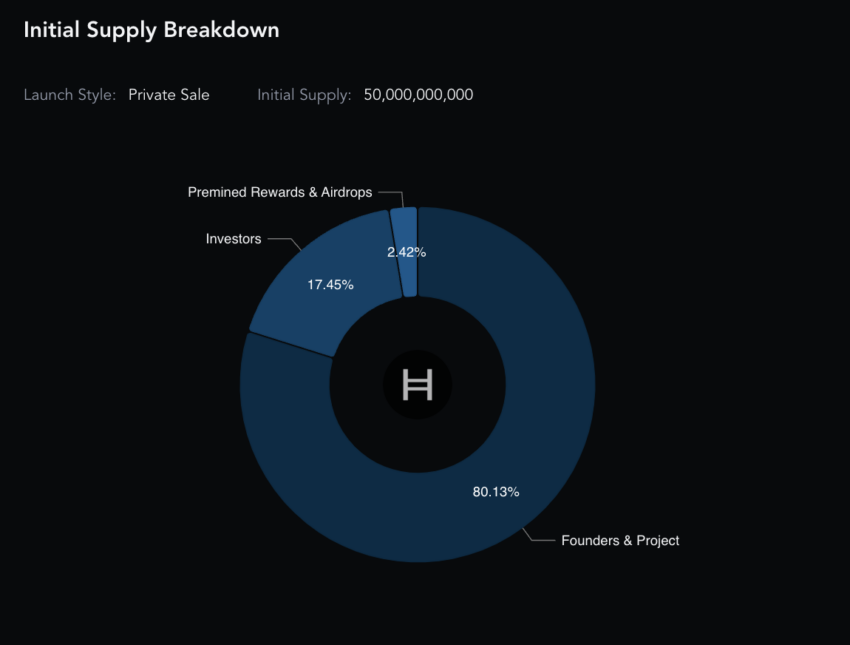
Currently, the circulating supply is 67.23% of the total supply.
While the supply cap looks promising, founders holding most of the supply is slightly disconcerting. However, a defined vesting period is in place to avoid market-wide sell-offs.
More about the HBAR ecosystem:
HBAR price prediction and other key metrics
As an investment option, HBAR looked shaky, as of February 2023, in the immediate short term. The 4-week price volatility was at its peak — an indicator that pushed the prices down in the short term.

In December 2023, things look similar, with the volatility still at a peak, along with the prices. This calls for an immediate price correction in the near term.

As mentioned, the Hedera network supports smart contracts and allows enterprises/individuals to build DApps. Therefore, development activity is expected to be an important metric.
As of February 2023, the increase in overall development activity progression over the past few months was visible. And prices, as expected, have been following the rise.

However, December’s development activity metric paints a different picture. Despite the drop in activity, the prices have surged. This means that in case the development activity surges, the prices can get some more push upwards, preferably into 2024.

HBAR price prediction and technical analysis
Now we have covered the Hedera fundamentals, including the state of the proof-of-stake ecosystem and other insights, it’s time to focus on the technical analysis.
Our December 2023 analysis
HBAR’s daily chart paints an interesting picture. If we open the daily chart, we can see HBAR breaking out of an ascending wedge pattern. Even the RSI validates the price rise. However, keeping a close eye on the upper trendline, which is acting as a pullback zone, is advisable.

Here is the weekly chart to help you analyze the pattern:

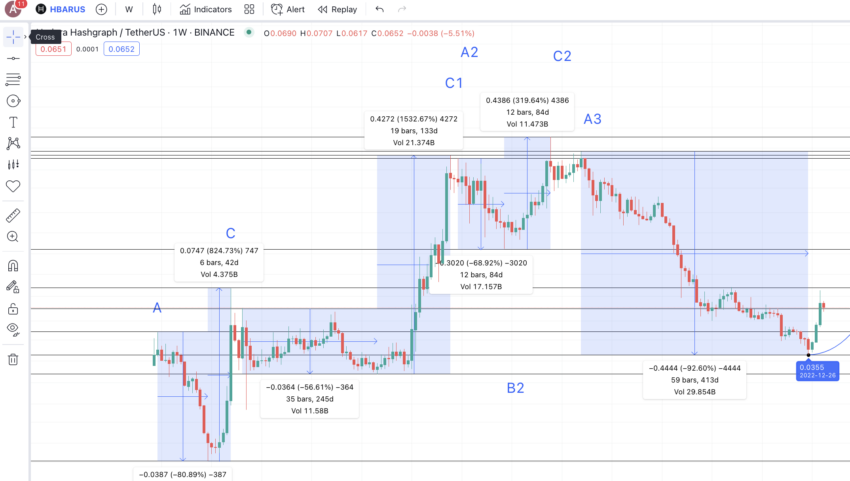
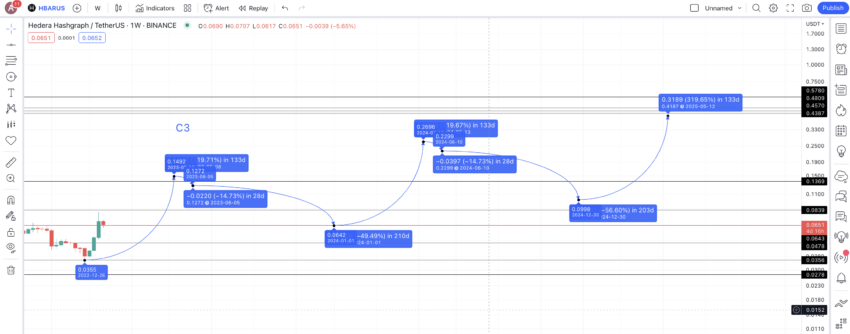
The pattern made by the price action of Hedera isn’t something we have seen before with this token. HBAR, the native token, makes a bottom-like formation followed by a peak. The historical data shows three clear bottom-to-high zones in play — confirming this as the formation of choice for Hedera Hashgraph.
/Related
More Articles


Here are the zones encircled for your reference:

If you see the chart with all the important points marked, you will notice that A-B-C formation multiple times. While A resembles the highest point before a dip, B is the lowest point in the formation, and C is the peak reached from B. Notice that the next A after any C is at the point where the next lower-high surfaces.
Here is the chart with all the relevant markings:

Price changes
We even have the A3 and B3 for the current pattern. Our immediate task is to locate the C3. For that, we will create three tables that trace the average price percentage moves and days taken by HBAR to complete the three A-B-C paths.
Parameters |
A to B |
B to C |
Days |
91 |
42 |
% change |
-80.89 |
824.73 |
A1 to C1
Parameters |
A1 to B1 |
B1 to C1 |
Days |
245 |
133 |
% change |
-56.61 |
1532.67 |
A2 to C2
Parameters |
A2 to B2 |
B2 to C2 |
Days |
84 |
84 |
% change |
-68.92 |
319.64 |
Finally, the A3 to B3 values are 413 days and -92.60% for calculation purposes. Thus, the average high-to-low percentage drop and time taken are calculated as 74.75% and 208 days, respectively, using all A to B levels up to B3.
Similarly, the average low-to-high hike and time taken are 892.35% and 86 days, respectively. However, in scenarios where the crypto market shows weaker trends, we can consider the minimum percentage hike of 319.64% and the maximum duration of 133 days.
Hedera Hashgraph (HBAR) price prediction 2023
In 2023, HBAR scaled a high of almost $0.093, which is in line with our expectations. Here is what we surmised in the early part of 2023:
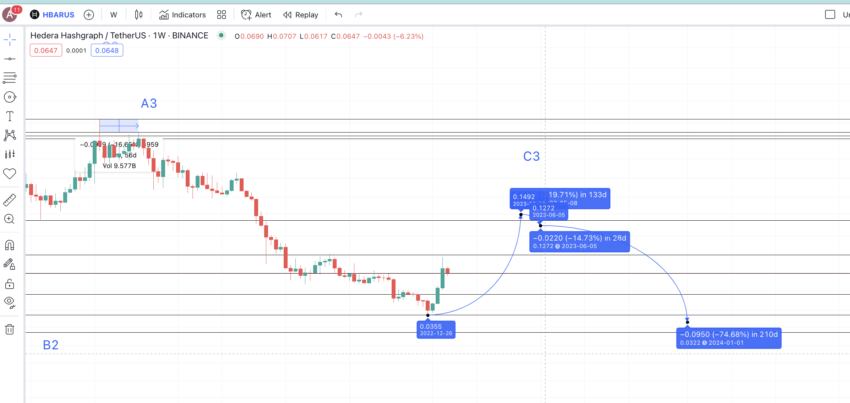
We already have the last low or B3 on the chart. Now, we can use the low-to-high percentage hike of 319.64% in 133 days to plot the next high at $0.1492. We have selected the minimum percentage hike as the bull market isn’t in yet, and we expect the gains to be minimal going forward.

Let us mark this level C3. But we hit a dead end here. We must locate the next point or A4 to kickstart a new formation. And we do not have the data to locate the point. Therefore, we will use the data (price change percentage and time) from every C to the next A.
Parameters |
C to A1 |
C1 to A2 |
C2 to A3 |
Days |
21 |
14 |
56 |
% change |
-23.33 |
-4.45 |
-16.65 |
The average C to A move comes to be 30 days, a drop of 14.81%.
Therefore, A4 might show up in 30 days from C3 and at a low of 14.81%. So A4 can show up close to $0.1272. We can now use the high-to-low average to locate the next point or the 2023 low, marked B4. With C3 surfacing lower than A3, we can expect the price of HBAR to correct more. Hence, the 74.75% drop and 208 days timeframe become relevant.

Therefore, B4 might just surface at $0.0322. However, there is strong support for HBAR at $0.0643 — ensuring that the minimum price prediction in 2023 doesn’t drop below that.
However, the short-term analysis shows the near completion of the five-wave pattern, with a correction expected close to $0.058. You can refer to this piece for more insights on that.
Hedera Hashgraph (HBAR) price prediction 2024
Outlook: Bullish
Now that we have the low B4 at $0.0643, by late 2023 or even early 2024, depending on the market conditions, the next high or C4 can follow the minimal gain percentage of 319.64% and surface in 133 days. This puts 2024 high at $0.2696. We can mark this level as C4.
The next level, or A5, can surface in 30 days and at a drop of 14.81%, using table 4. This level surfaces at $0.2299.
Projected ROI from the current level: 136%
Hedera Hashgraph (HBAR) price prediction 2025
Outlook: Bullish
From this level or A5, we can use locate the next low or B5 in 208 days and at a minimum drop percentage of 56.61% — using table 2. This puts the minimum price of HBAR in 2024 at $0.0998. The next high or the price of HBAR in 2025 could be at $0.4187 — using the minimum percentage hike and 133 days as the maximum timeframe.
Projected ROI from the current level: 382%
Hedera Hashgraph (HBAR) price prediction 2030
Outlook: Bullish
We can mark this point as C5. And from C5, we can plot the next A or A6 using the 30-day timeframe and a drop of 14.81%. The drop from A6 can take support at $0.1369 in 208 days.
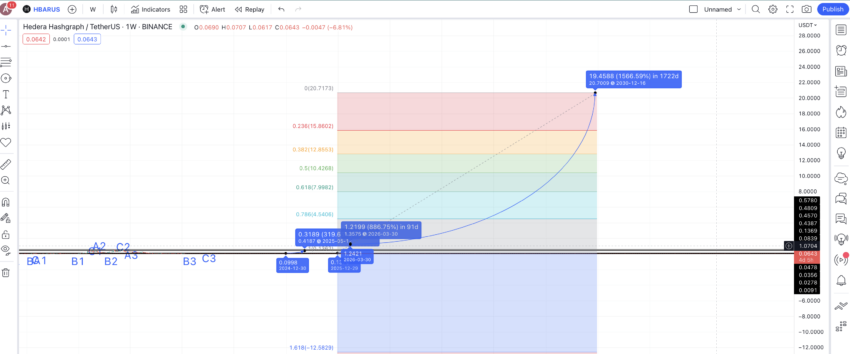
Projected ROI from the current level: 23759%
Hedera Hashgraph (HBAR’s) long-term price prediction until the year 2035
Outlook: Bullish
If you want to check the HBAR price forecast levels till 2035, here is another table that might come in handy:
Year |
Maximum price of HBAR |
Minimum price of HBAR |
2024 |
$0.2696 |
$0.0998 |
2025 |
$0.4187 |
$0.2595 |
2026 |
$1.35 |
$0.57 |
2027 |
$2.36 |
$1.46 |
2028 |
$5.31 |
$4.14 |
2029 |
$13.28 |
$10.35 |
2030 |
$20.71 |
$10.354 |
2031 |
$34.17 |
$26.65 |
2032 |
$46.13 |
$28.60 |
2033 |
$57.66 |
$44.97 |
2034 |
$86.49 |
$67.46 |
2035 |
108.11 |
$84.32 |
Note the average trading price, regardless of the year you choose, can vary from the maximum prices or even the minimum price levels.
Is the HBAR price prediction model accurate?
Hedera Hashgraph involves many technical elements. These include smart contracts for improving the public network and an innovative hashgraph consensus. This HBAR price prediction model considers all these elements whilst forming a detailed technical analysis to ascertain the future price of the HBAR token. Therefore, this price forecast model is practical and realistic. Plus, as it is based on a lot of historical data, the price prediction model even aligns with the market sentiments.
Frequently asked questions
What is HBAR worth in 2025?
What was HBAR’s highest price?
Will Hedera reach $1?
Who is invested in HBAR?
Why is HBAR unique?
Trusted
Disclaimer
In line with the Trust Project guidelines, the educational content on this website is offered in good faith and for general information purposes only. BeInCrypto prioritizes providing high-quality information, taking the time to research and create informative content for readers. While partners may reward the company with commissions for placements in articles, these commissions do not influence the unbiased, honest, and helpful content creation process. Any action taken by the reader based on this information is strictly at their own risk. Please note that our Terms and Conditions, Privacy Policy, and Disclaimers have been updated.