

Hathor (HTR) has been decreasing rapidly since the beginning of the month. It is approaching the support of a long-term horizontal range.
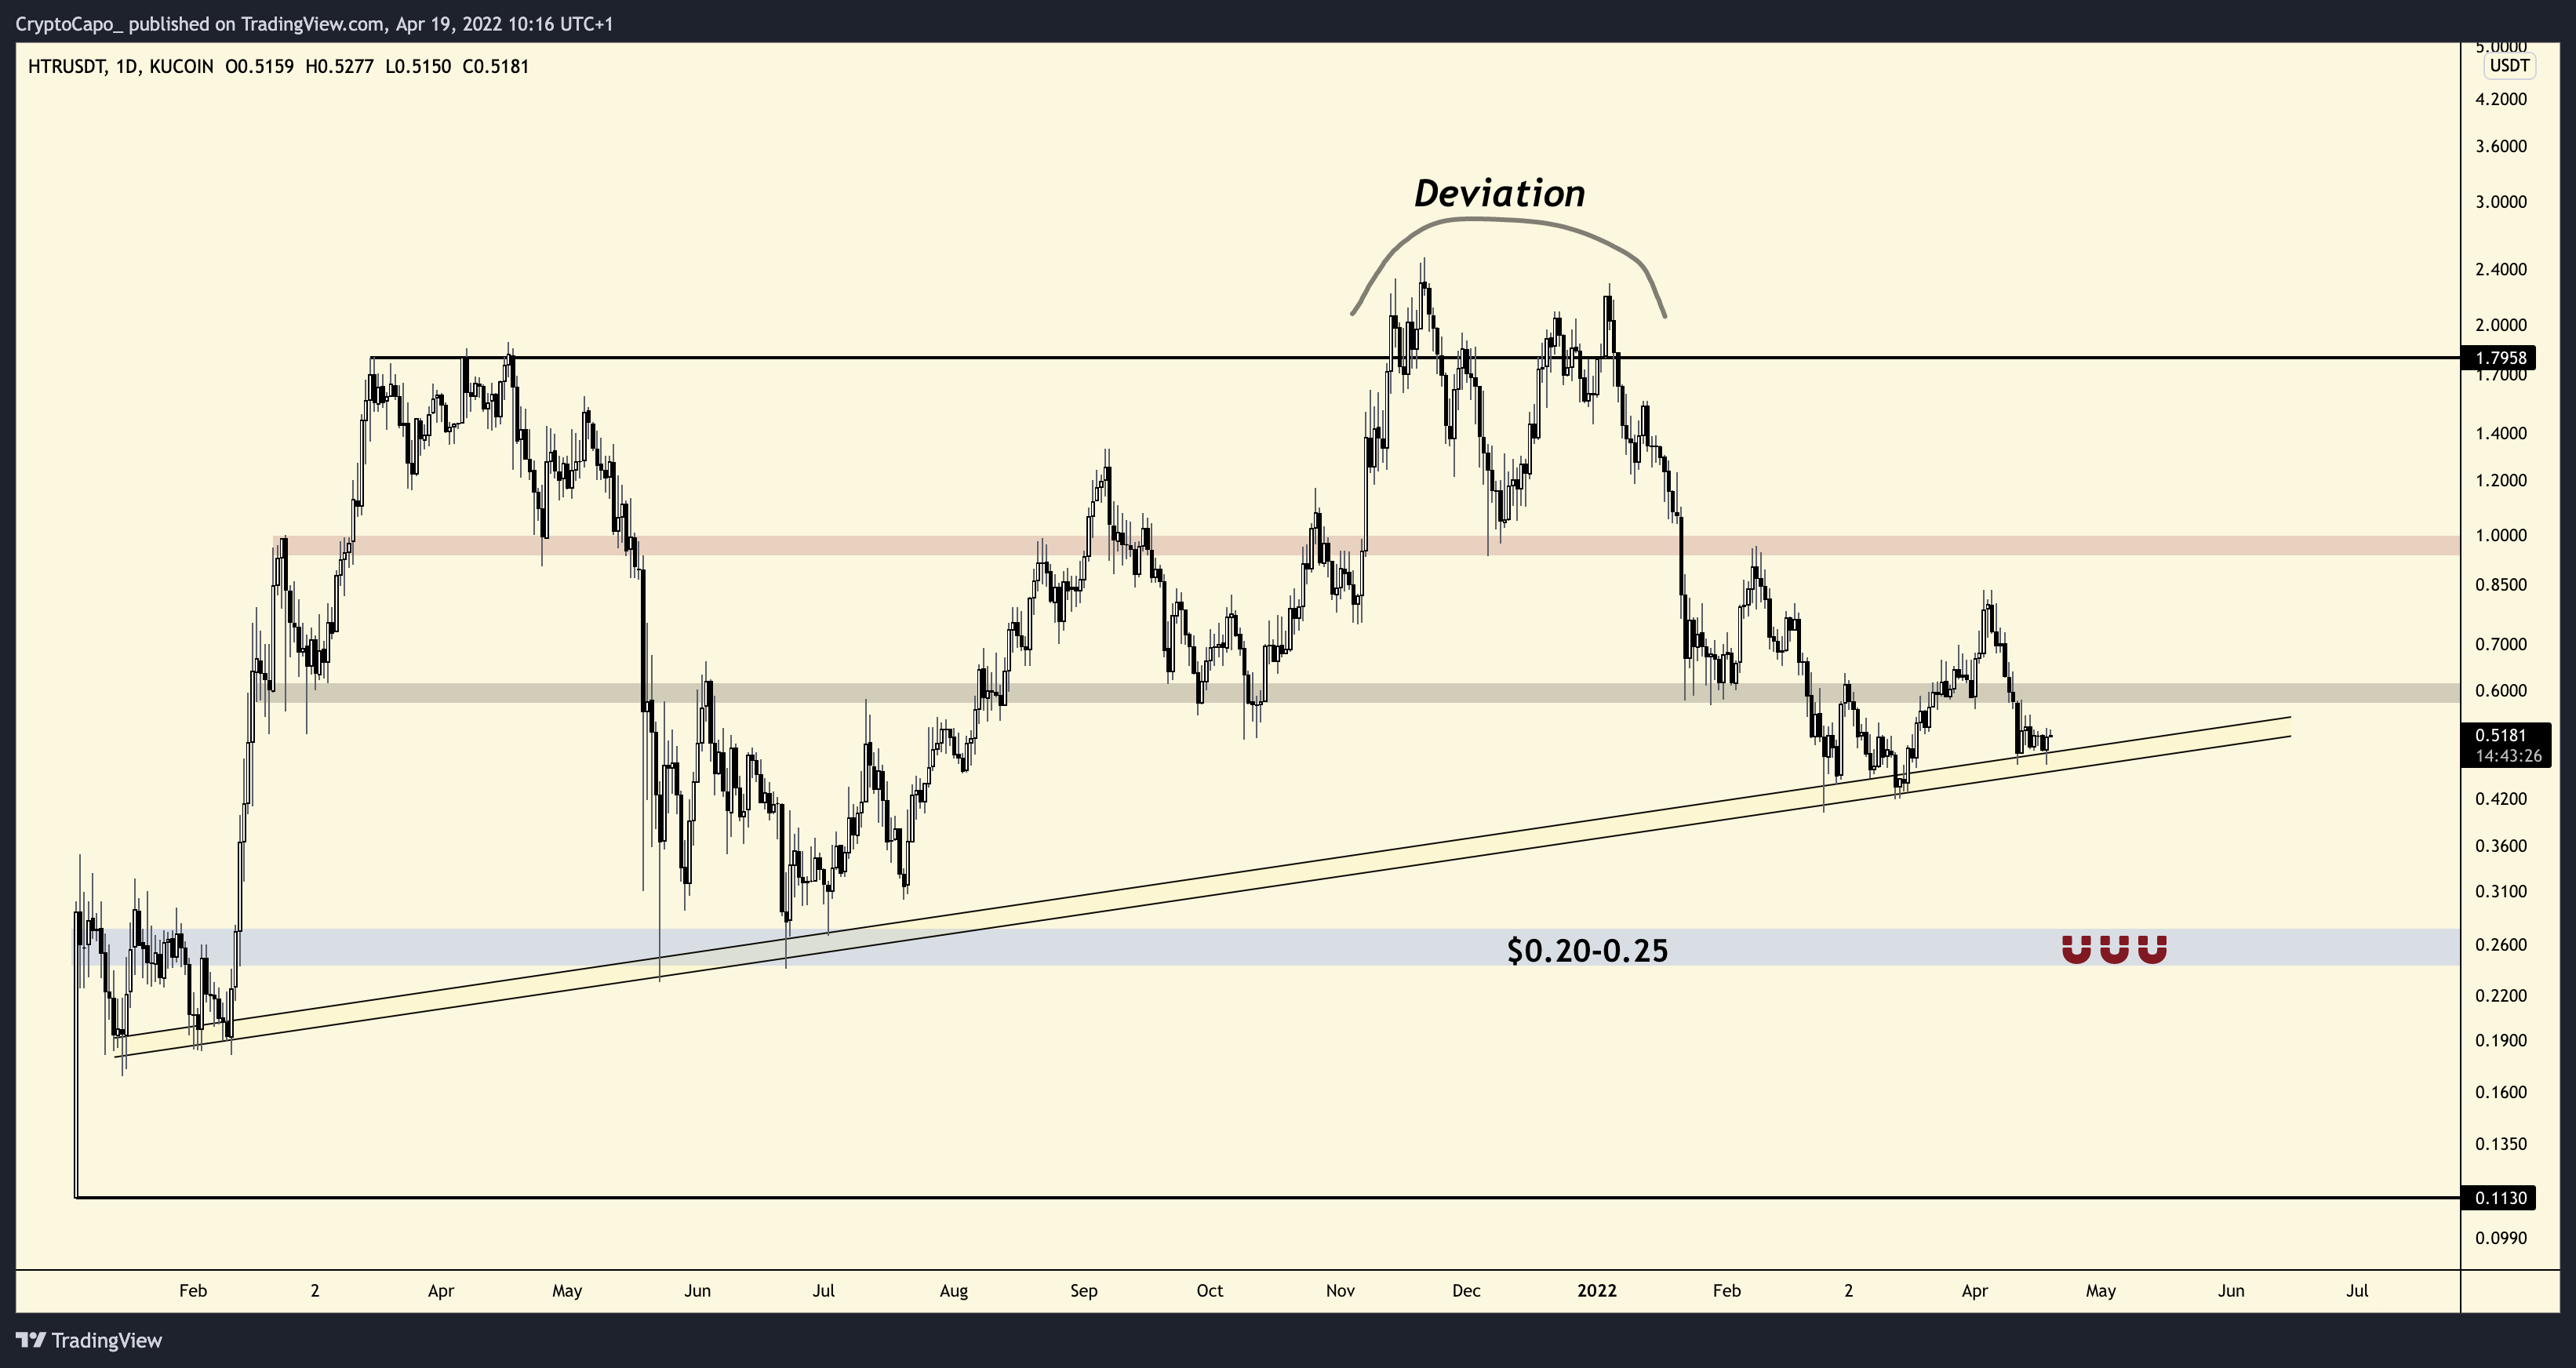
HTR has been falling since reaching a high of $2.490 on Nov. 21. After a sharp drop, the price initiated an upward movement, but only ended up creating a lower high (red icon) in the beginning of Jan. 2022. So far, the downward movement has so far led to a low of $0.40 on April 25.
The closest support area is at $0.26. This is a horizontal area that has been in place since the beginning of Feb. 2021.

Cryptocurrency analyst @CryptoCapo_ tweeted a chart of HTR, stating that if it breaks down from the current channel, it will fall to $0.20-$0.25. The level coincides with the horizontal support area outlined above.
Will HTR break down?
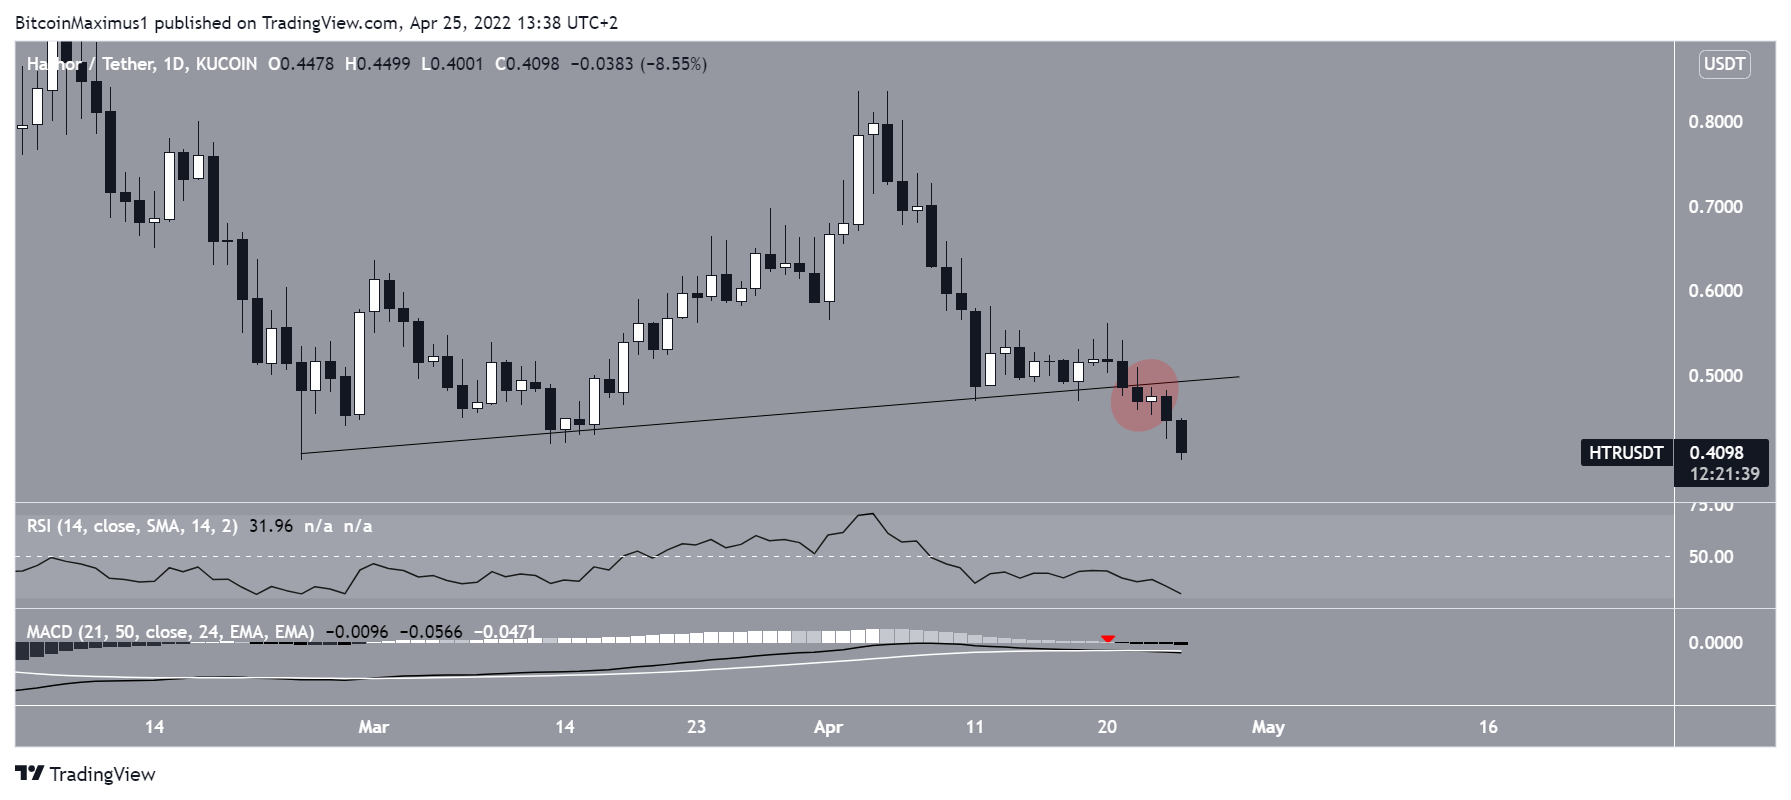
Technical indicators in the daily time frame are bearish, supporting the continuation of the downward movement. This is clearly visible by the decreasing MACD and RSI.
Besides the fact that they are falling, the RSI has nearly dropped below 25, while the MACD has already made a bearish cross (red icon). Therefore, both indicators suggest that the continuation of the downward movement is likely.
Moreover, HTR seems to have broken down from an ascending support line (red circle), which had previously been in place since Feb. 24.
Short-term movement
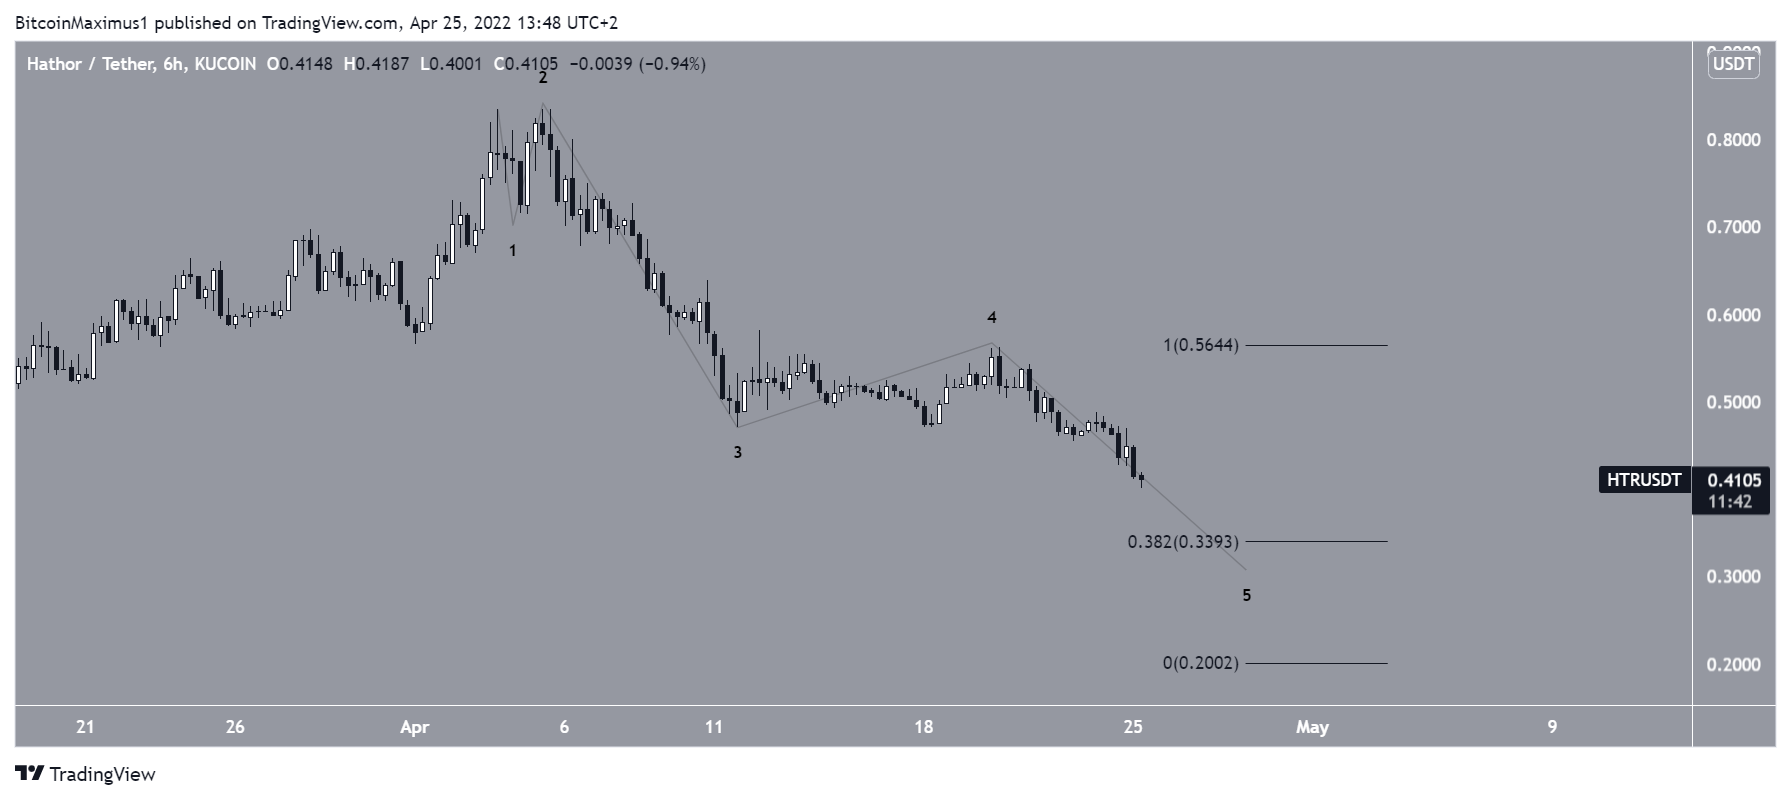
The six-hour chart suggests that the entire decrease since the beginning of April is likely to be a five wave downward movement. If so, HTR is in the fifth and final wave of this descent.
There are two main targets for the bottom of this movement. The first is at $0.34. It is found by the 0.618 length of waves 103.
The second is at $0.20, and would give wave five the same length as waves 1-3.
While the exact level for the bottom cannot be yet determined, it seems that HTR is in the final portion of its decrease prior to a significant bounce.
For BeInCrypto’s latest Bitcoin (BTC) analysis, click here
Trusted
Disclaimer
In adherence to the Trust Project guidelines, BeInCrypto is committed to unbiased, transparent reporting. This news article aims to provide accurate, timely information. However, readers are advised to verify facts independently and consult with a professional before making any decisions based on this content. Please note that our Terms and Conditions, Privacy Policy, and Disclaimers have been updated.
