

The Graph (GRT) has reclaimed the previous breakdown level and validated it as support afterwards. As long as the newly created support area holds, GRT should continue increasing towards the resistance areas at $0.47 and $0.59.
Reclaim of Support
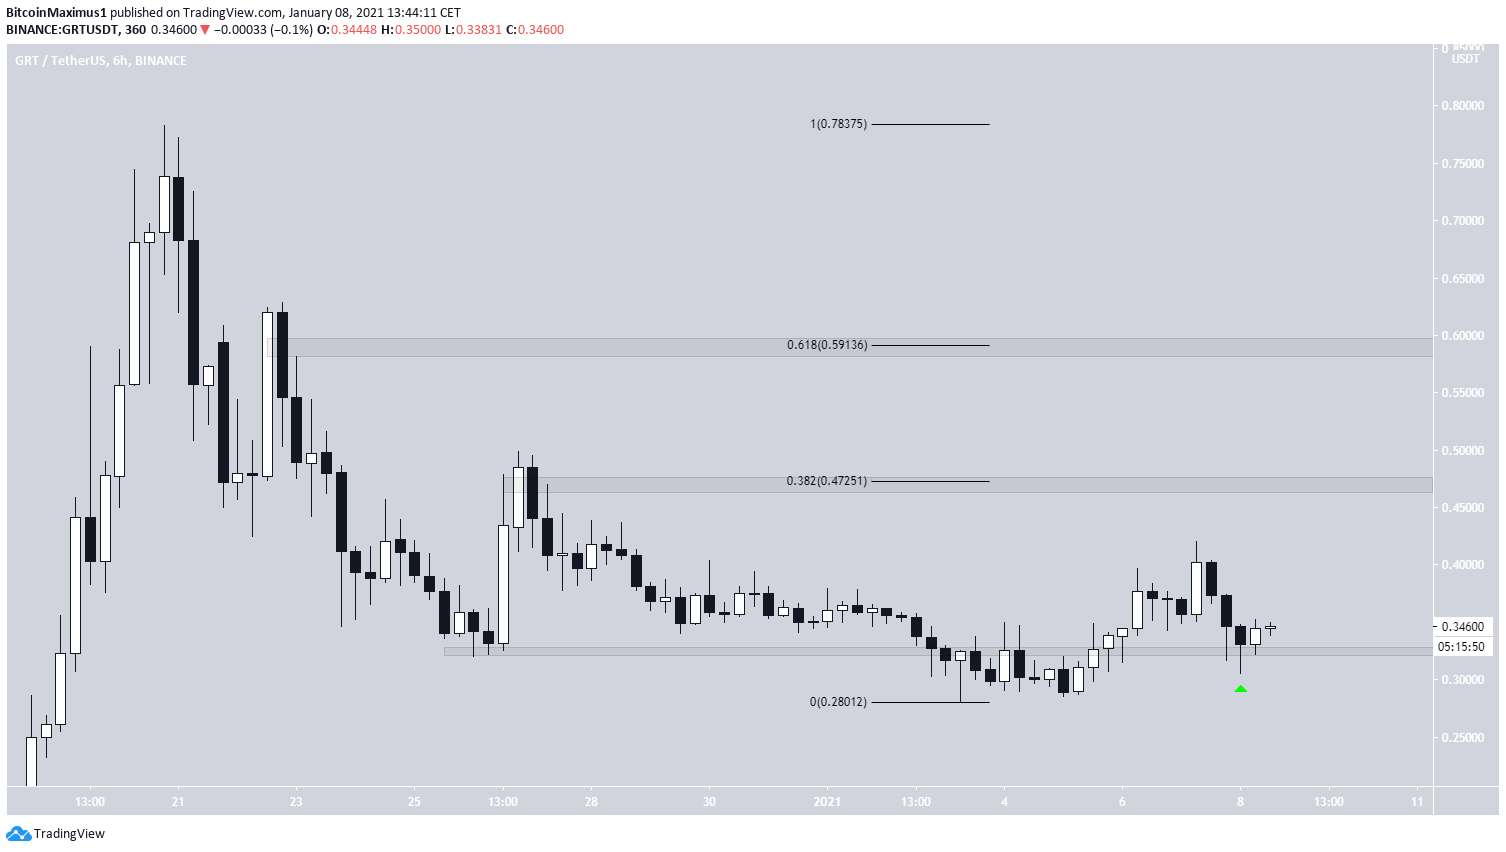
GRT has been moving downwards since Dec. 20, when it reached a high of $0.783. On Dec. 26, it reached a low of $0.32 and initiated a bounce, which was short-lived.
The ensuing decline took GRT to a low of $0.28 on Jan. 11. Nevertheless, it reclaimed the $0.325 area shortly afterward and validated it as support on Jan. 7. As long as GRT is trading above this level, it should continue moving upwards.
If it does, the next resistance areas are at $0.47 and $0.59, the 0.382 and 0.618 Fib retracement levels, respectively.
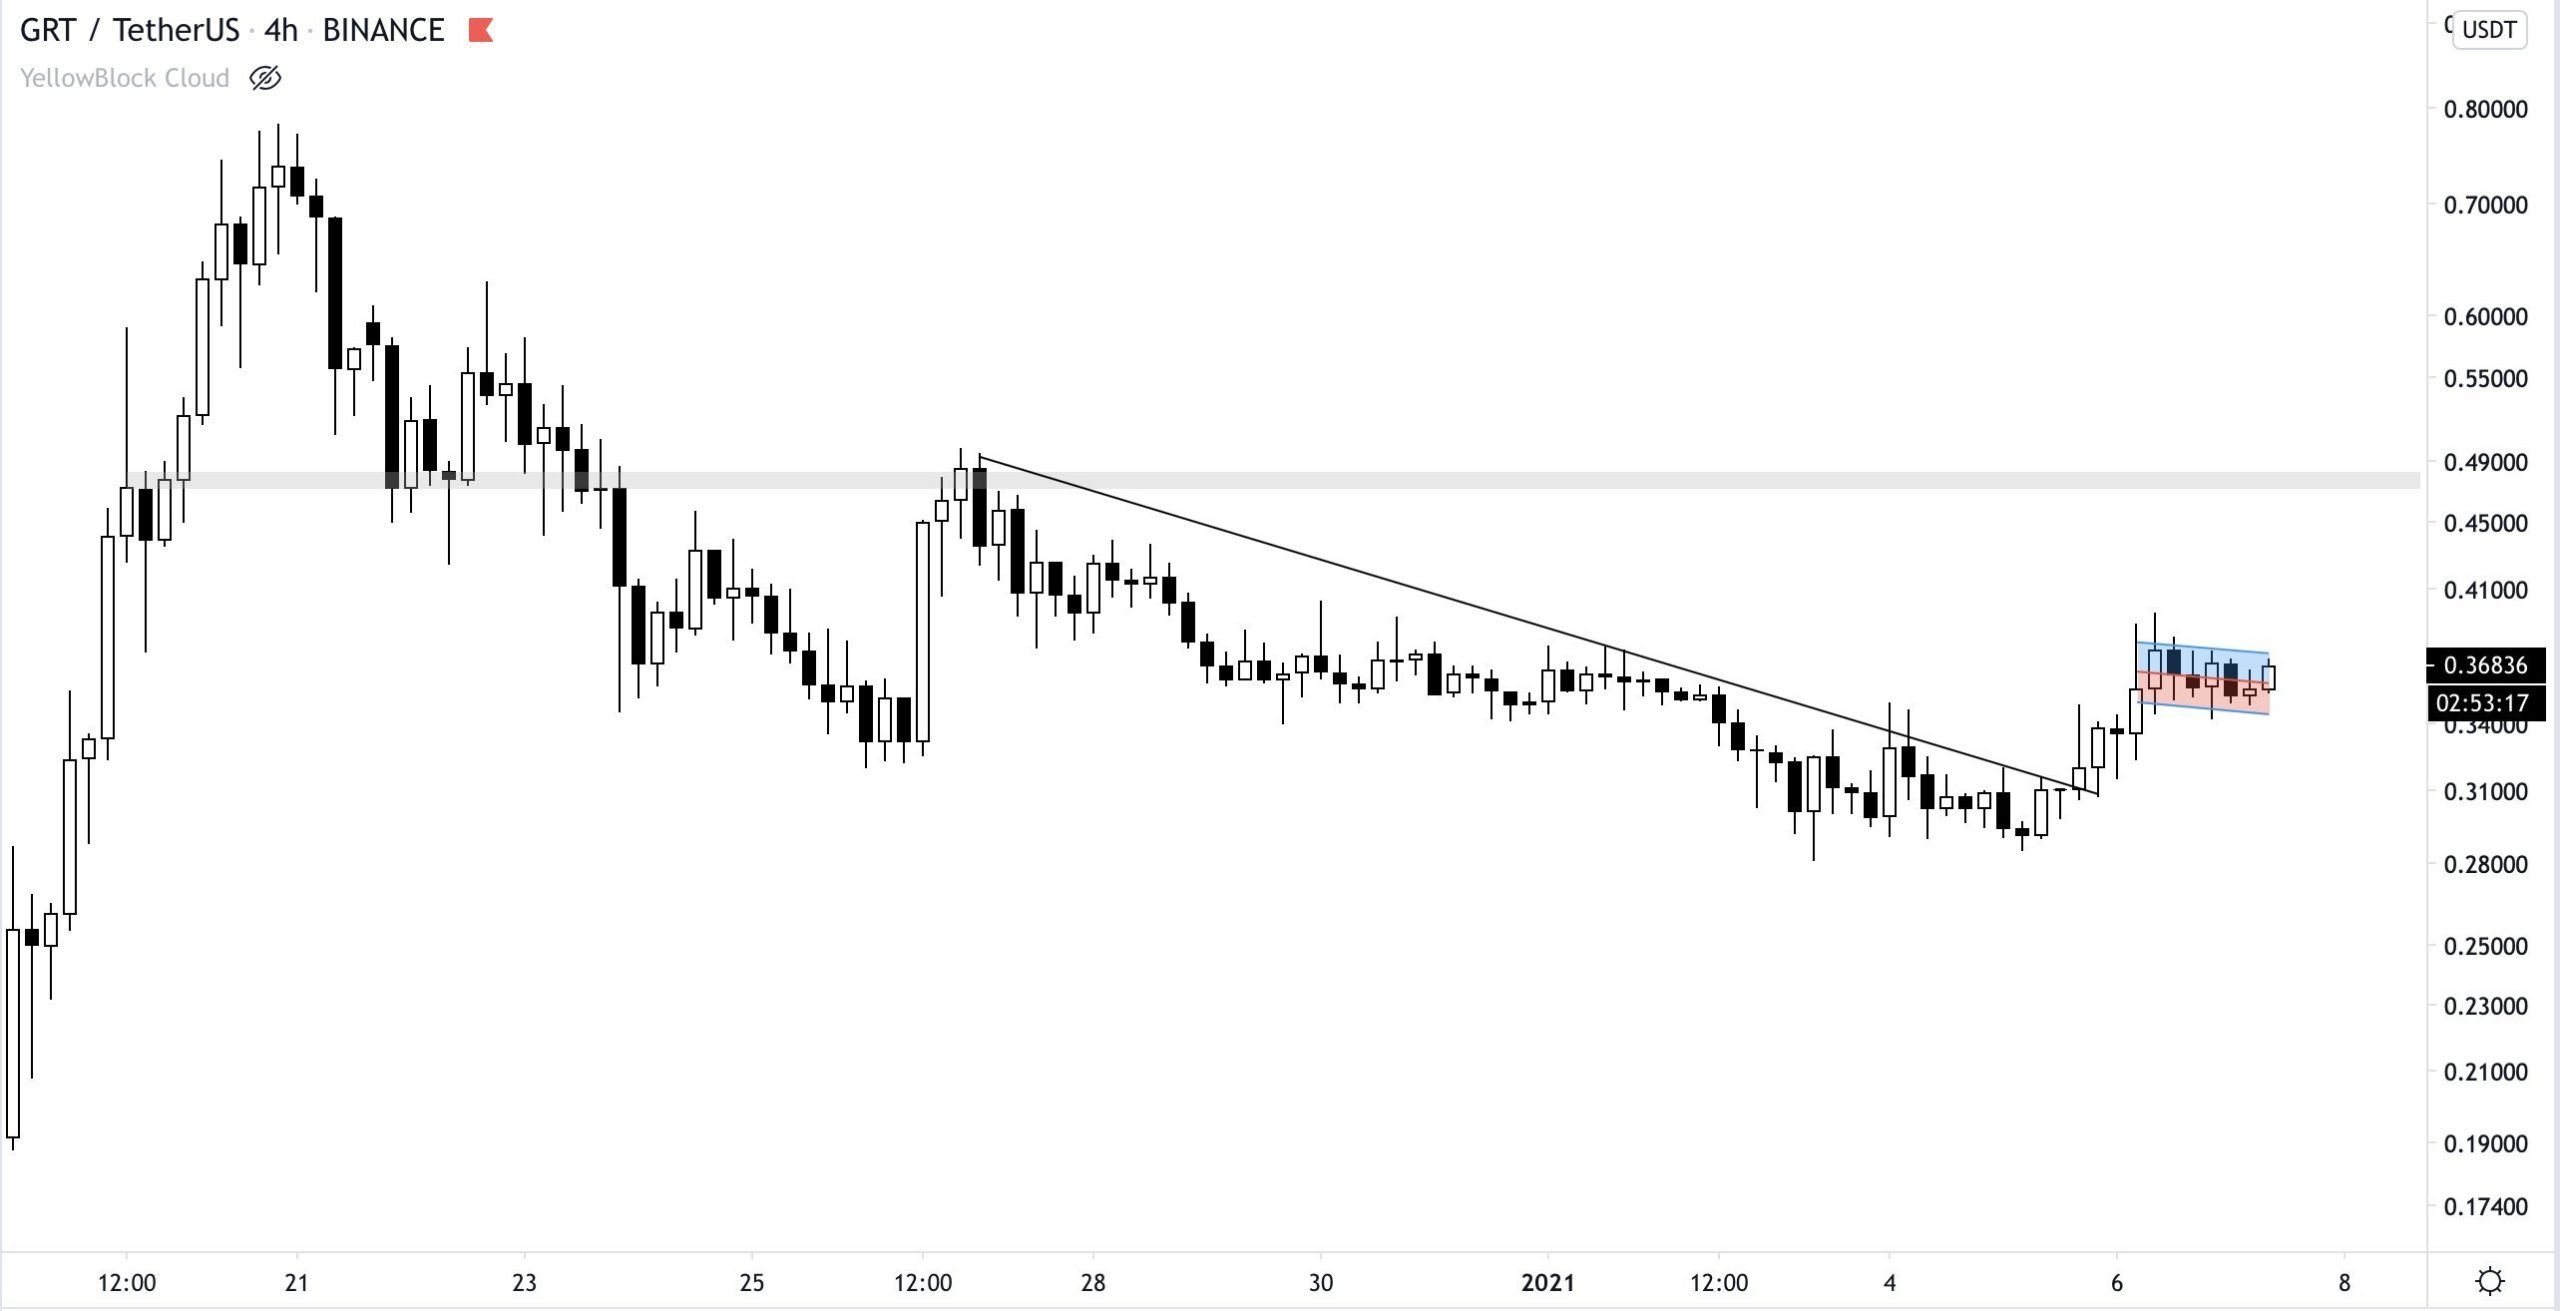
Cryptocurrency trader @TeddyCleps outlined a GRT chart, stating that the ensuing breakout could take it to $0.48. The area coincides with the 0.382 Fib retracement level, making it a very likely level to act as resistance.
Short-Term Movement
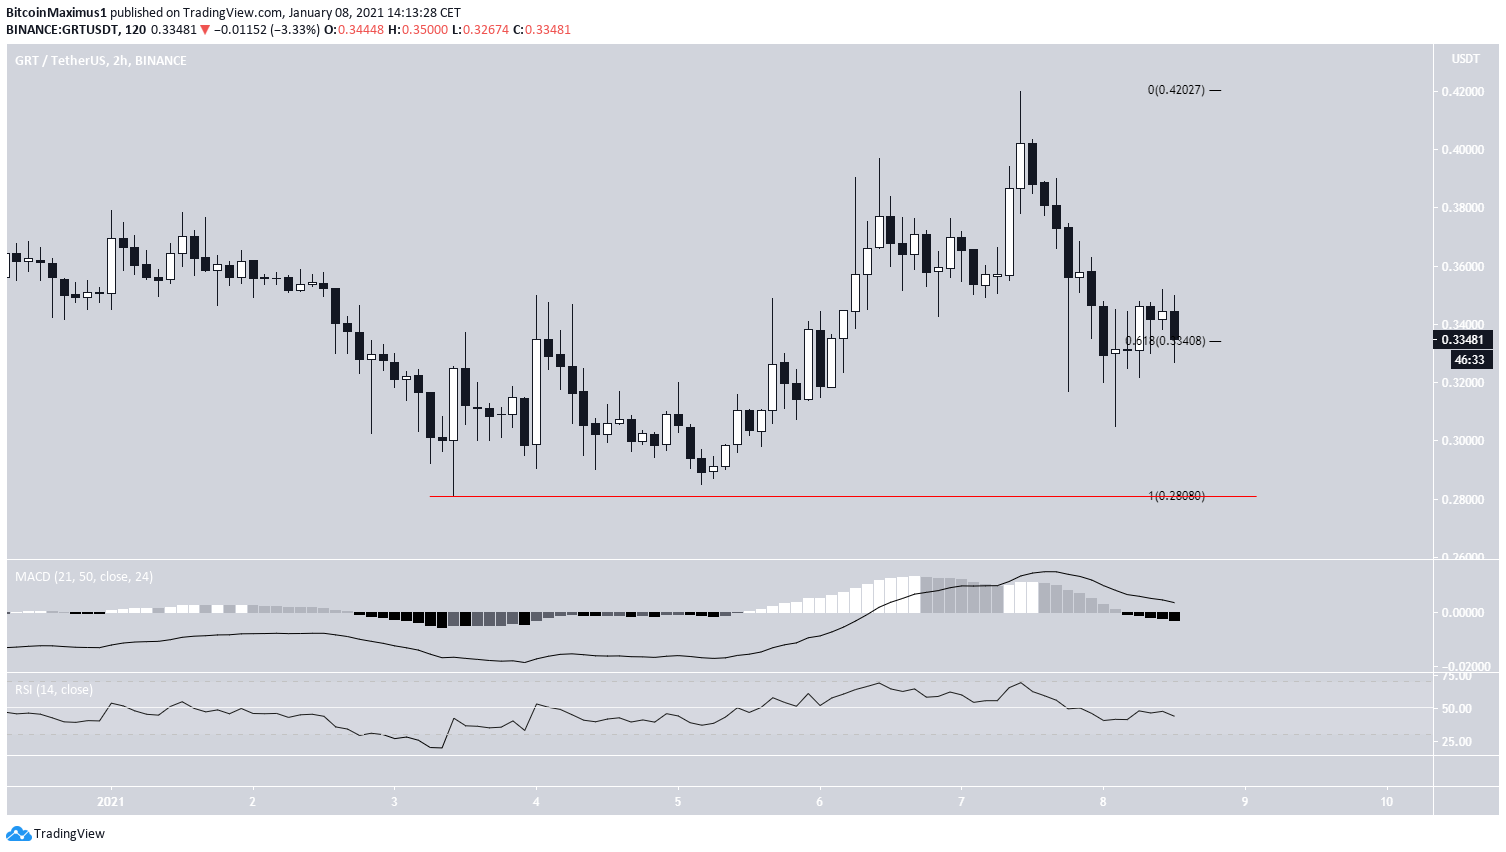
The shorter-term two-hour chart shows that GRT has bounced at the 0.618 Fib retracement level at $0.34 and is trading above it. As long as it does, the recent decline is likely just a correction that will eventually create a higher low and take prices higher.
Nevertheless, technical indicators are bearish, failing to provide any bullish reversal signs.
A fall below the $0.28 low would indicate that the upward move has ended and GRT is heading lower.
Conclusion
To conclude, due to the lack of sufficient price history and confirmation for indicators, the GRT trend is unclear. In any case, whether GRT trades above or below the $0.325 area should act as a gauge for the direction of the trend.
For BeInCrypto’s previous Bitcoin (BTC) analysis, click here!
Disclaimer: Cryptocurrency trading carries a high level of risk and may not be suitable for all investors. The views expressed in this article do not reflect those of BeInCrypto.
Trusted
Disclaimer
In line with the Trust Project guidelines, this price analysis article is for informational purposes only and should not be considered financial or investment advice. BeInCrypto is committed to accurate, unbiased reporting, but market conditions are subject to change without notice. Always conduct your own research and consult with a professional before making any financial decisions. Please note that our Terms and Conditions, Privacy Policy, and Disclaimers have been updated.
