

The ‘Wall Street Cheat Sheet’ is a popular chart that shows the perceived emotions a trader feels while holding an asset — such as Ethereum (ETH) — throughout the peaks and troughs of a market cycle.
The chart consists of positive emotions throughout the run-up to the top and negative ones in the downtrend towards the bottom.
Applying the same cheat sheet to the Ethereum price, it looks as if the June 2019 high was part of the “Disbelief phase. This means that we have just begun a new market cycle. If this holds true, we are likely to see a significant price increase over the next two years.
Trader and market analyst Bitcoin Jack posted the cheat sheet with the price of Ethereum pictured over it. The price movement closely resembles that displayed in the sheet.
In case it is difficult to analyze the image from the tweet, the chart below offers a full-sized image of the price of Ethereum since 2017 with the emotional stages outlined in the price cycle.The $ETH cycle
— //Bitcoin 𝕵ack 🐐 (@BTC_JackSparrow) October 16, 2019
I can't make this more visually appealing
You do you, I do me 📈🙏 pic.twitter.com/XFDK9XwpPv
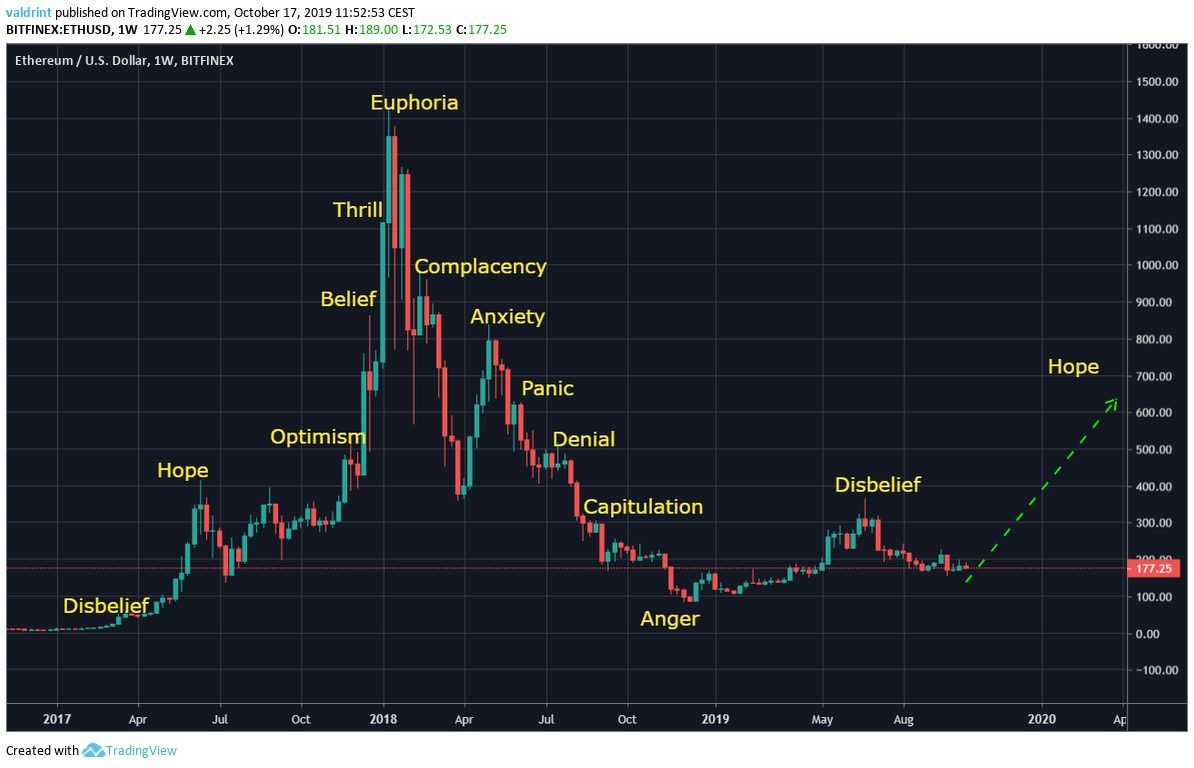 Judging from the chart, we are currently retracing from the “Disbelief” phase. If this upward movement continues, the succeeding price high should be that of “Hope.”
Since the chart is repetitive, this movement should coincide with that in June 2017.
Using the RSI, which is a momentum indicator, we can come to a similar conclusion about the position of the current Ethereum price relative to the market cycle.
The RSI has been oversold (<30) only twice throughout its history.
Judging from the chart, we are currently retracing from the “Disbelief” phase. If this upward movement continues, the succeeding price high should be that of “Hope.”
Since the chart is repetitive, this movement should coincide with that in June 2017.
Using the RSI, which is a momentum indicator, we can come to a similar conclusion about the position of the current Ethereum price relative to the market cycle.
The RSI has been oversold (<30) only twice throughout its history.
- The first time was in December 2016, when the price reached a low of $5.60.
- The second was in December 2019, when the price reached a low of $83.
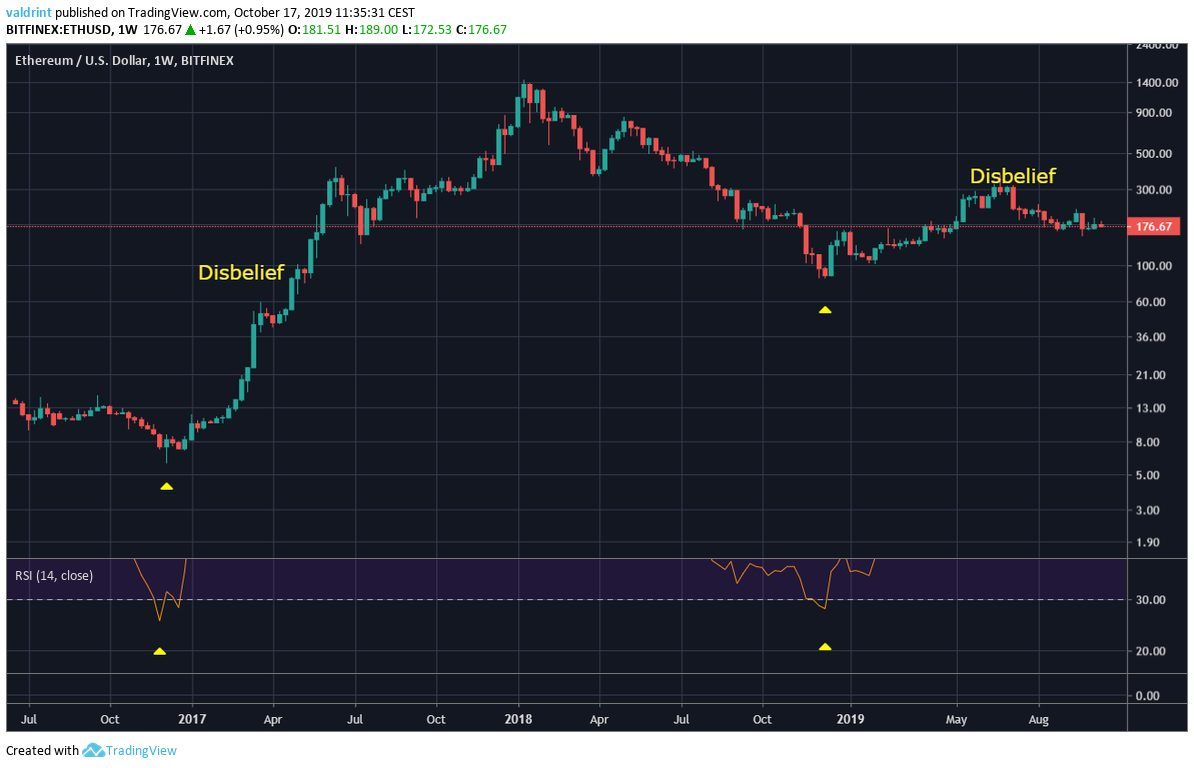 The similar RSI values are a further indication that the Ethereum price might currently be retracing from the “Disbelief” phase.
For the upcoming high, we can make a very rough prediction based on the magnitude of an increase in the previous cycle.
In the 2016-2018 upward move, the price of Ethereum increased by 19500 percent in a period of 378 days.
The similar RSI values are a further indication that the Ethereum price might currently be retracing from the “Disbelief” phase.
For the upcoming high, we can make a very rough prediction based on the magnitude of an increase in the previous cycle.
In the 2016-2018 upward move, the price of Ethereum increased by 19500 percent in a period of 378 days.
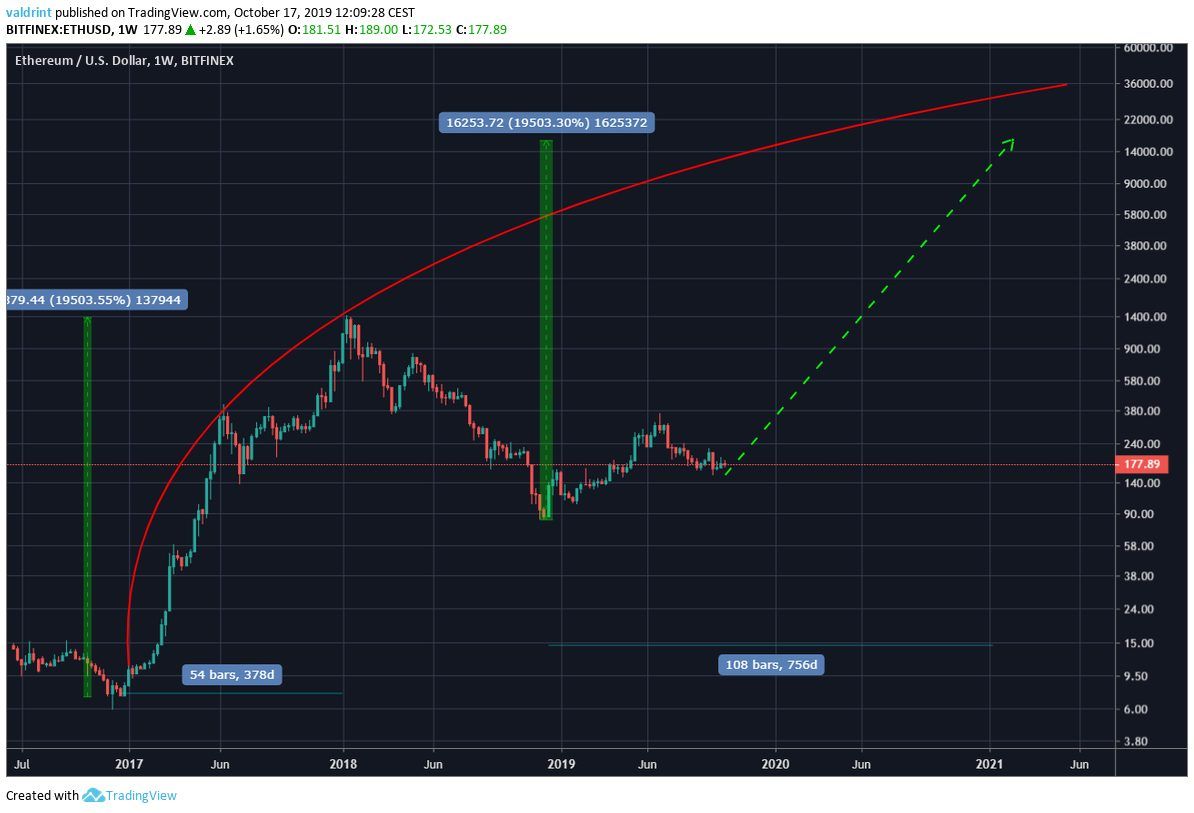 Assuming a similar increase, we get a price of $16,400 for the next high.
We have used a curved resistance line in order to limit the scope of possible price movement.
Since this value is currently above the resistance line, the high should be reached sometime after February 2020.
While the previous upward move took 378 days to materialize, it makes sense for this one to be slower since the rate of increase decelerates in logarithmic growth curves.
In what phase of the market cycle do you think Ethereum is currently in? Let us know in the comments below.
Assuming a similar increase, we get a price of $16,400 for the next high.
We have used a curved resistance line in order to limit the scope of possible price movement.
Since this value is currently above the resistance line, the high should be reached sometime after February 2020.
While the previous upward move took 378 days to materialize, it makes sense for this one to be slower since the rate of increase decelerates in logarithmic growth curves.
In what phase of the market cycle do you think Ethereum is currently in? Let us know in the comments below.
[Disclaimer: This article is not trading advice and should not be construed as such. Always consult a trained financial professional before investing in cryptocurrencies, as the market is particularly volatile.]
Top crypto projects in the US | April 2024
Trusted
Disclaimer
In line with the Trust Project guidelines, this price analysis article is for informational purposes only and should not be considered financial or investment advice. BeInCrypto is committed to accurate, unbiased reporting, but market conditions are subject to change without notice. Always conduct your own research and consult with a professional before making any financial decisions. Please note that our Terms and Conditions, Privacy Policy, and Disclaimers have been updated.

Valdrin Tahiri
Valdrin discovered cryptocurrencies while he was getting his MSc in Financial Markets from the Barcelona School of Economics. Shortly after graduating, he began writing for several different cryptocurrency related websites as a freelancer before eventually taking on the role of BeInCrypto's Senior Analyst.
(I do not have a discord and will not contact you first there. Beware of scammers)
READ FULL BIO
Sponsored
Sponsored