

Ethereum (ETH) has made an attempt at moving upwards past resistance, but failure caused the price to retrace almost completely.
Even though some technical indicators are bullish, a breakout from the current resistance area is required for the trend to flip bullish.
Ethereum Trading Range
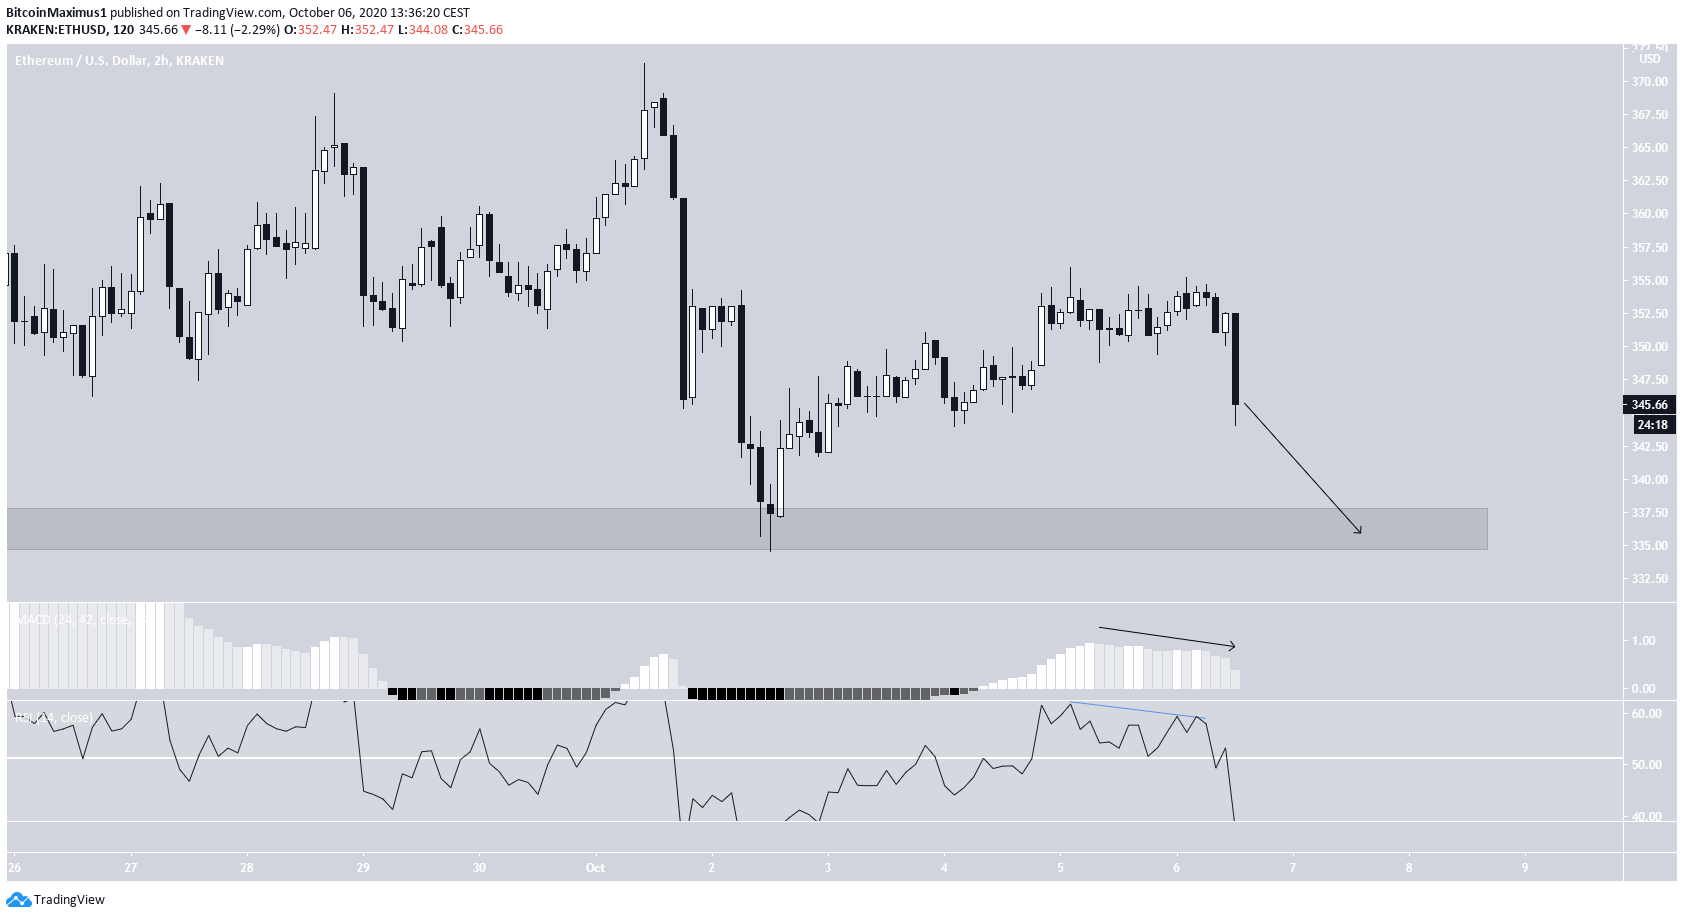
The Ethereum price has been decreasing since Sept 1, when it reached a high of $489.57. The decrease continued until it reached a low of $311.04 on Sept 5. The low initiated an upward move which was relatively short-lived since ETH was rejected after reaching $394. Currently, ETH is stuck in a range between $315-$380. A breakdown from the support area could trigger a rapid decrease towards $240, while a breakout above the resistance area would likely cause the price to move towards the 0.618 Fib level at $420.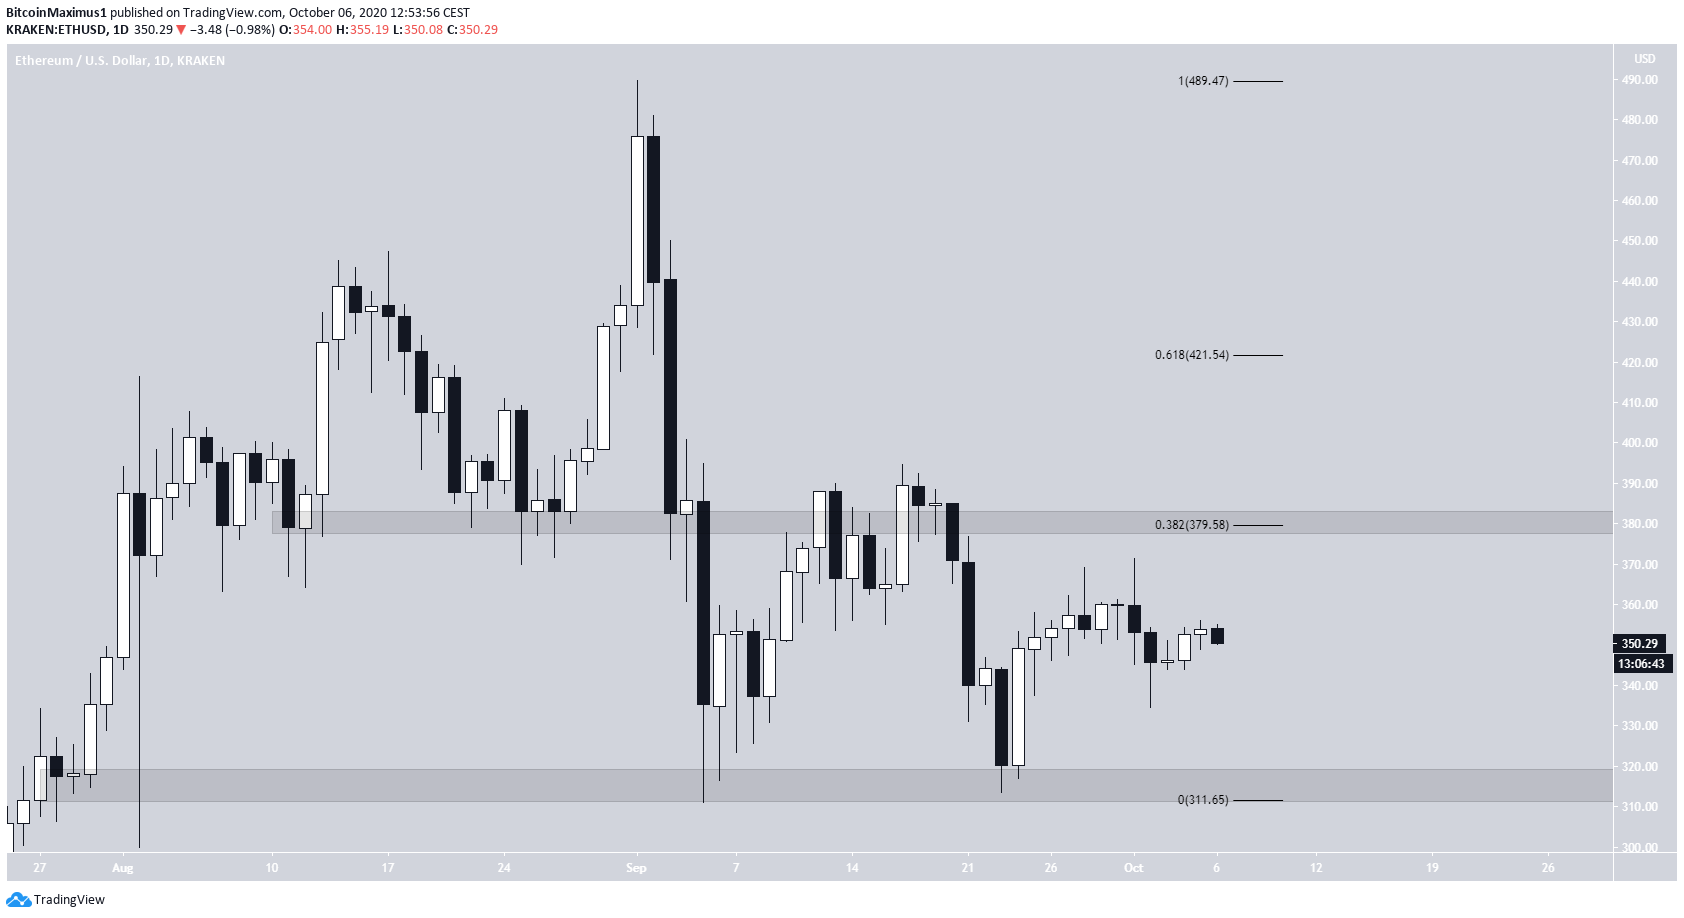
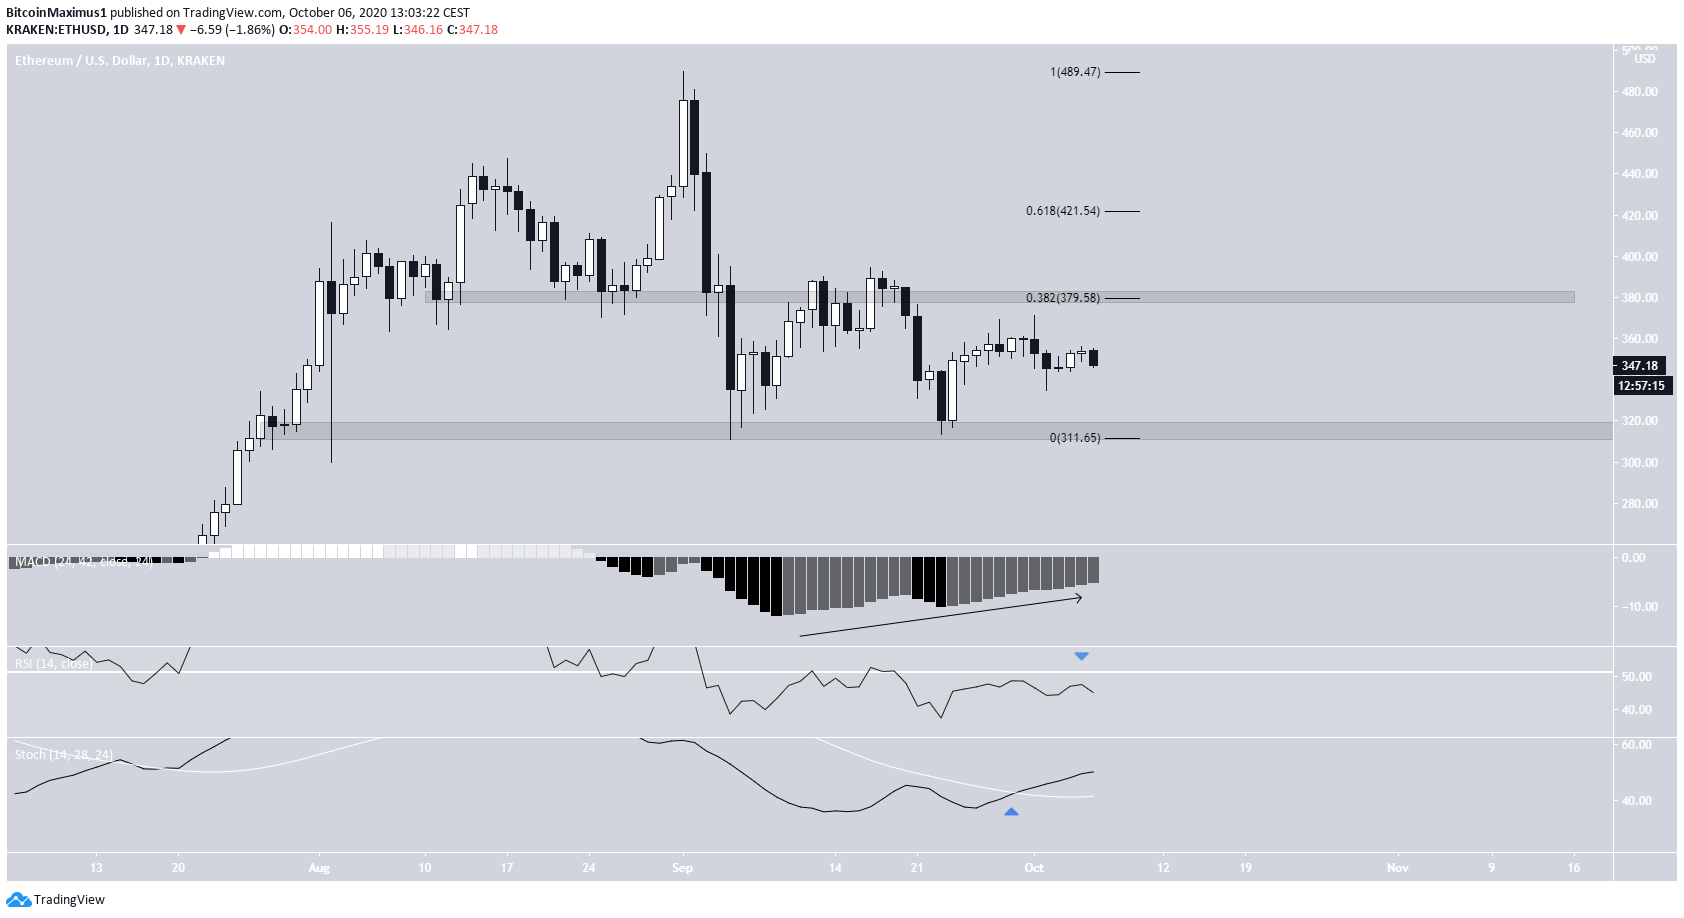
- The MACD is increasing and has generated bullish divergence, but is nowhere close to positive territory
- The RSI has failed to generate bullish divergence and is trading below 50
- The stochastic oscillator has made a bullish cross and is increasing
Short-Term Movement
Cryptocurrency trader @ACXTrades outlined an Ethereum chart with a short target of $333.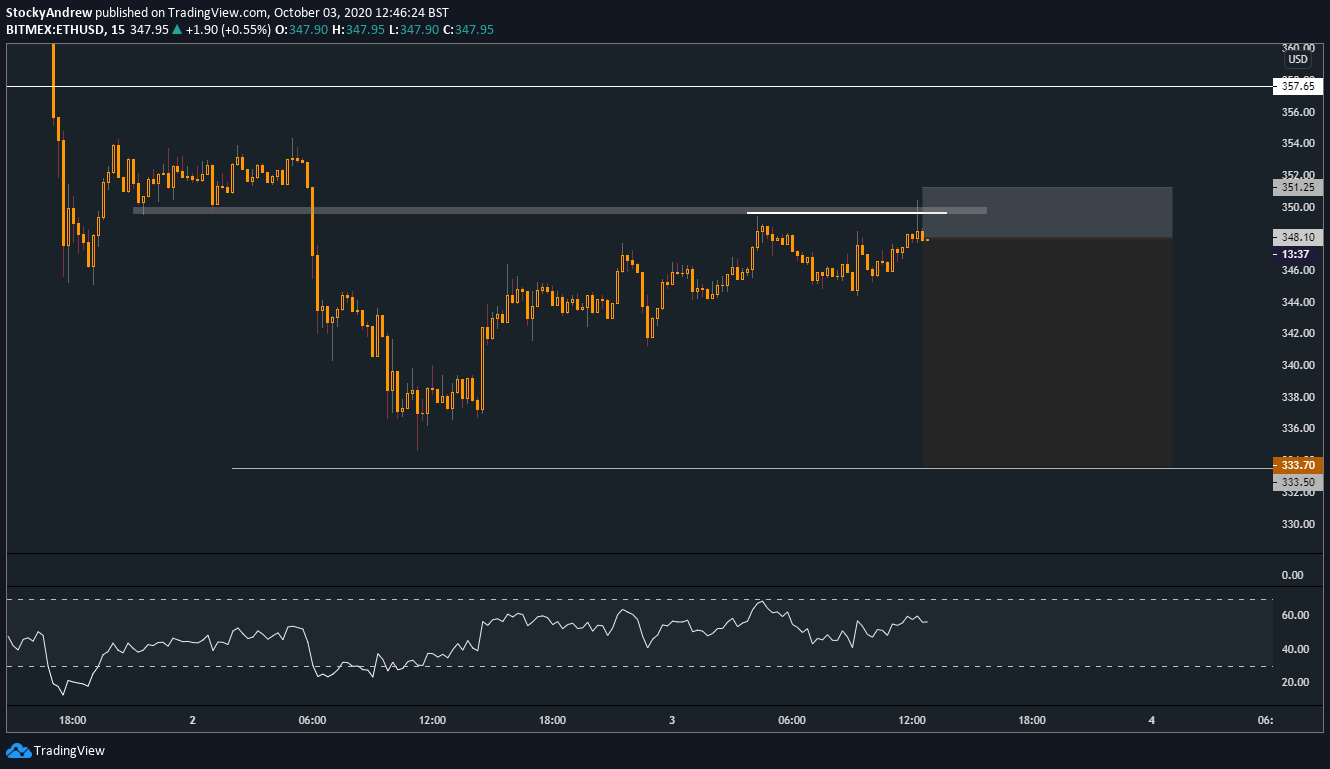
Wave Count
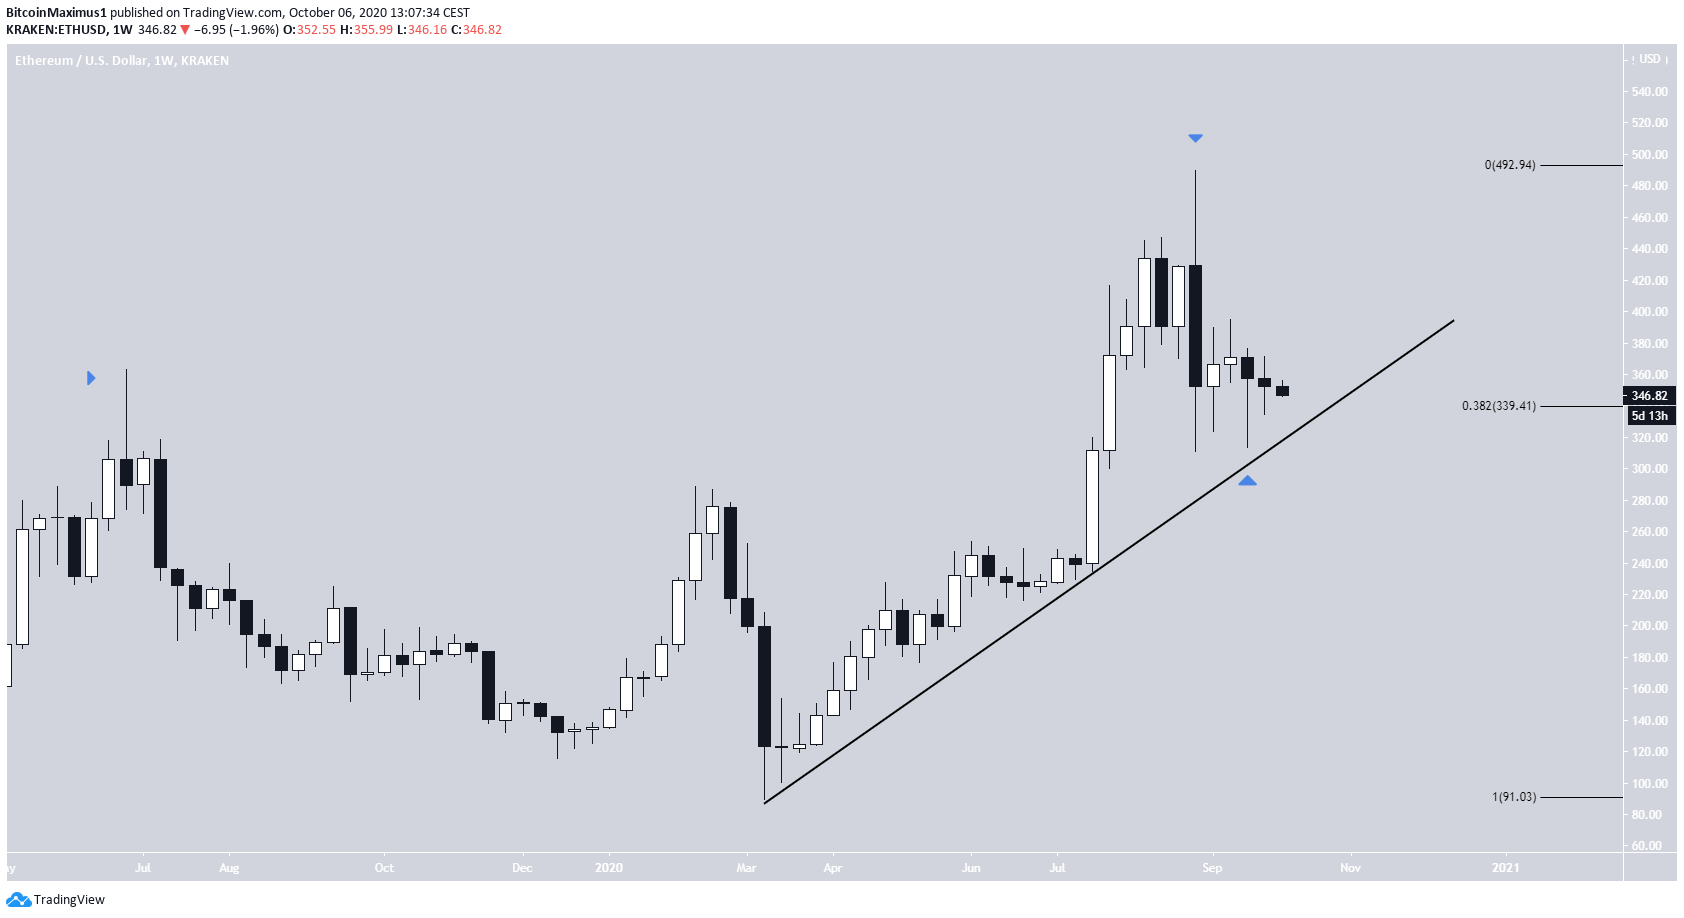
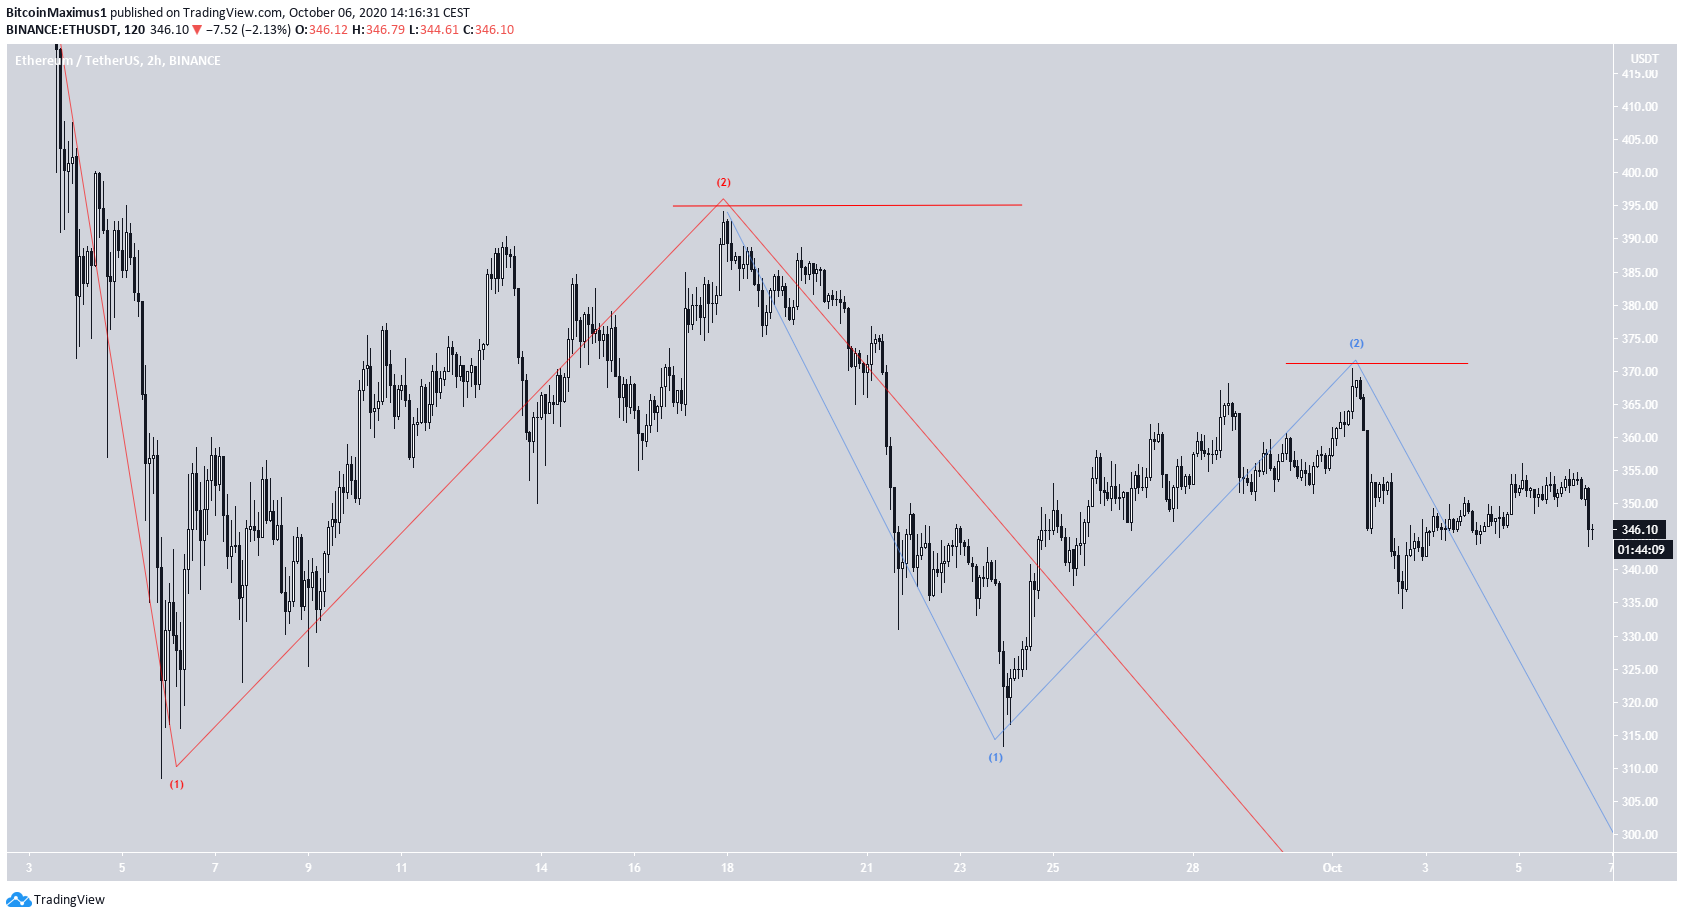
The most likely count suggests that the price began an A-B-C corrective formation (shown in black below). with the March 3 low, and is currently in the fifth sub-wave (blue) of wave C. Based on the length of the previous movements, the wave could end near $545.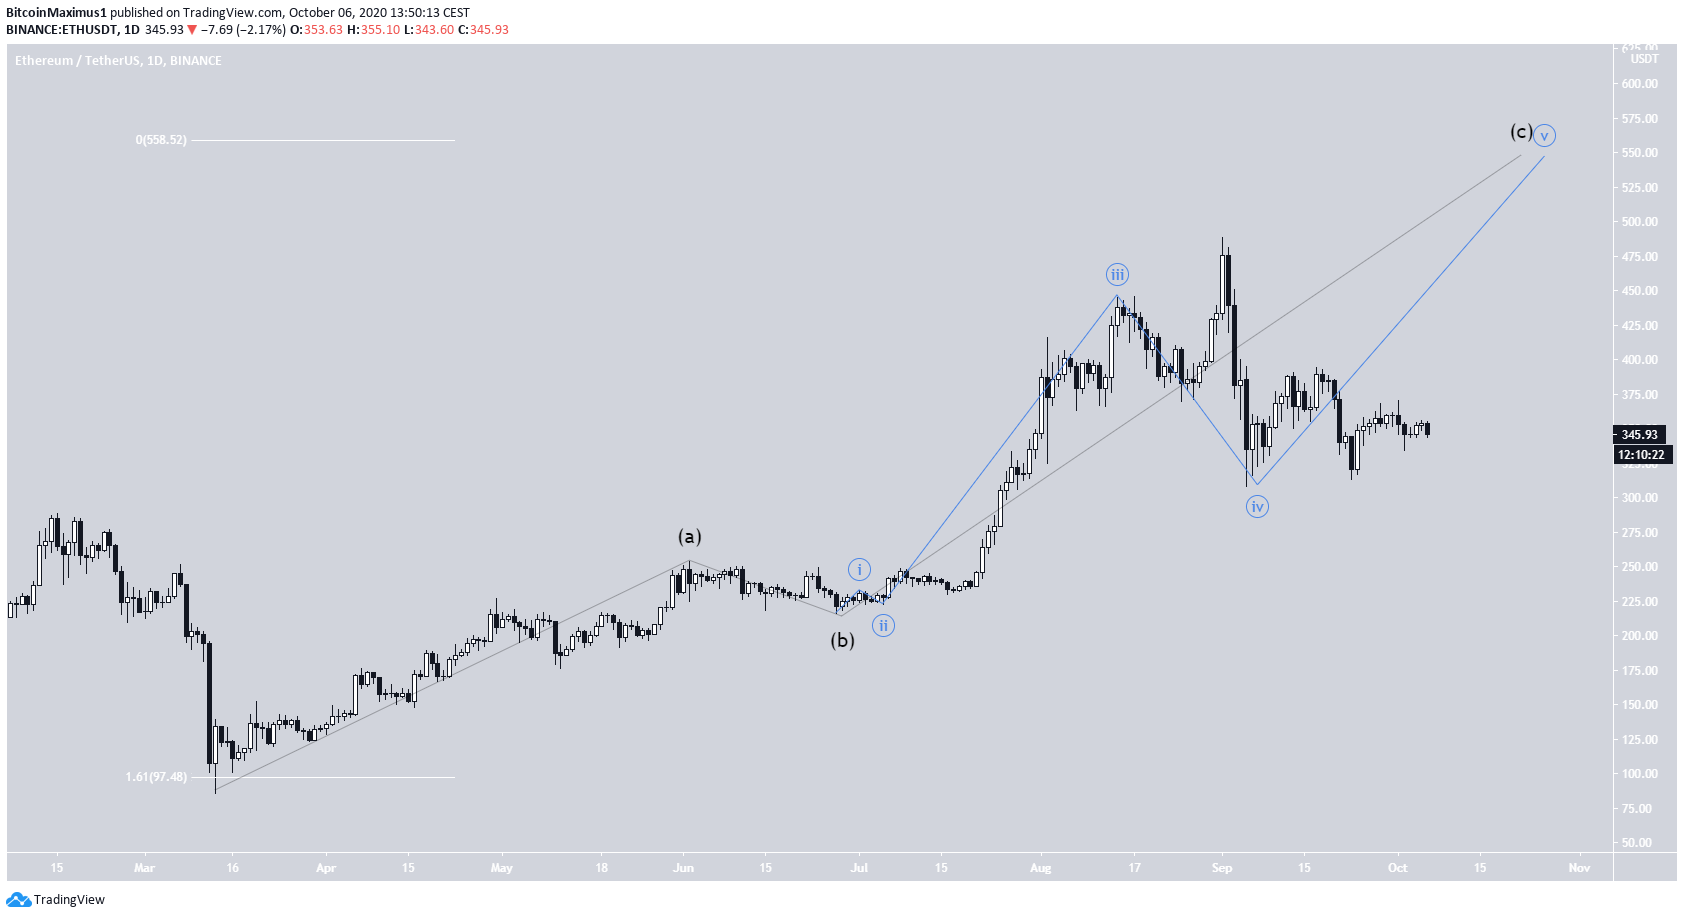 ETH Chart By TradingView
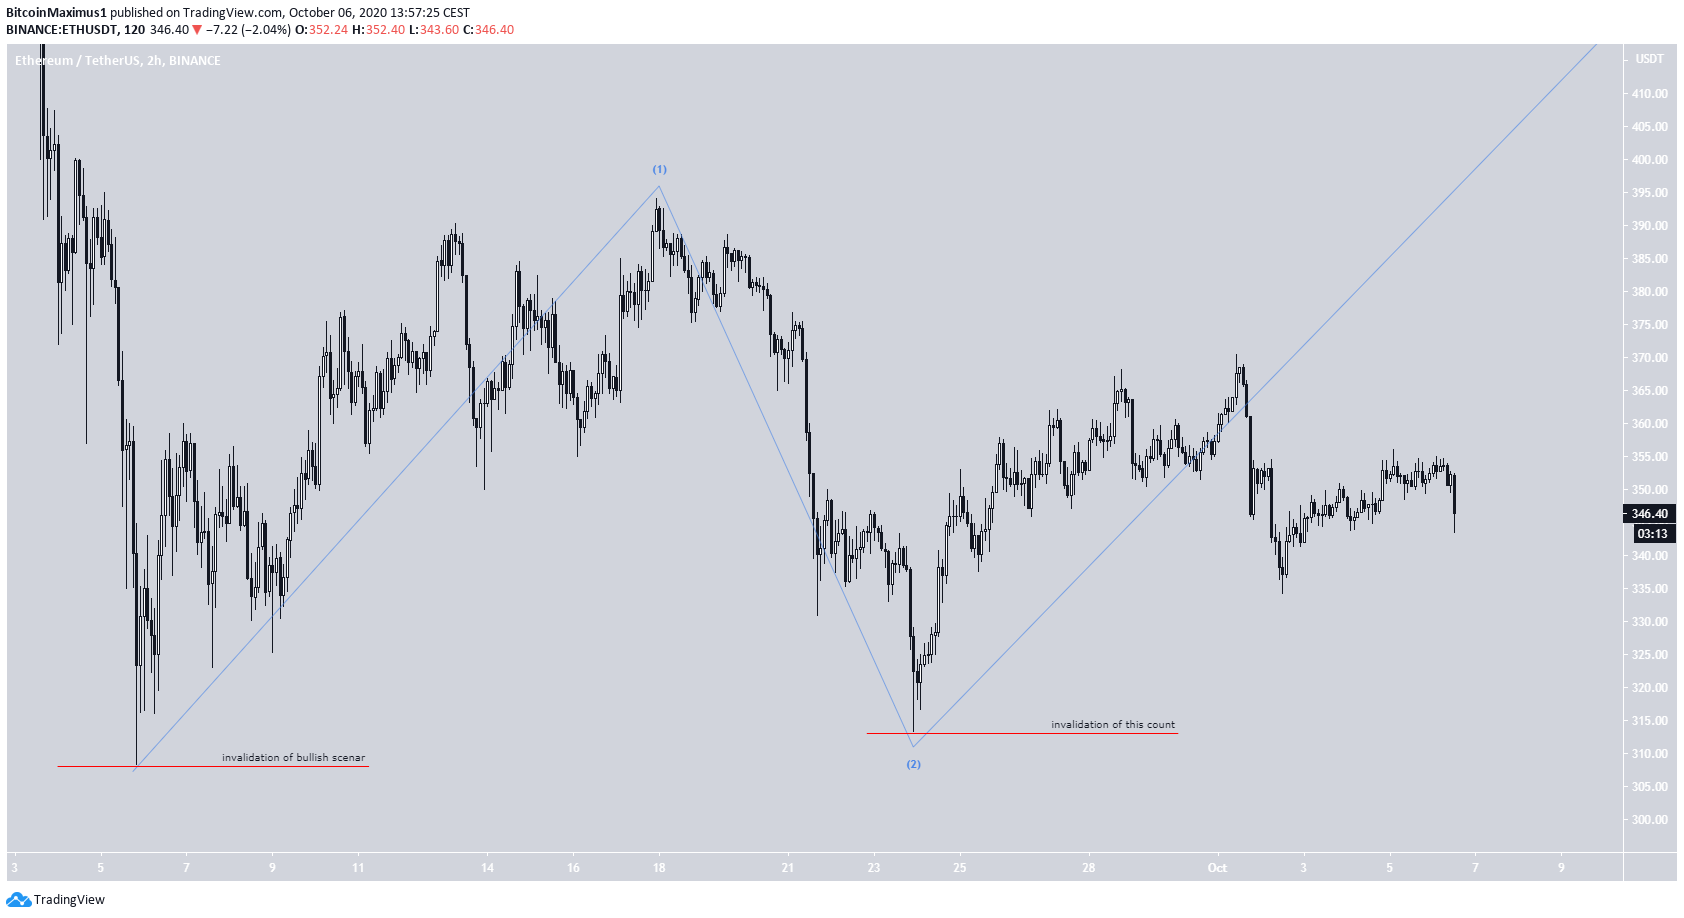
If the count is correct, then ETH has begun a new upward move has completed waves 1 and 2 (in blue below).
A decrease below the wave 2 low of $313.29 would invalidate this particular wave count, while a decrease below the Sept 5 low of $308.42 would invalidate the bullish scenario.
ETH Chart By TradingView
If the count is correct, then ETH has begun a new upward move has completed waves 1 and 2 (in blue below).
A decrease below the wave 2 low of $313.29 would invalidate this particular wave count, while a decrease below the Sept 5 low of $308.42 would invalidate the bullish scenario.
Alternate Count
An alternate wave count suggests that ETH has completed its upward move and began a bearish impulse (shown in red below) on Sept 2. The issue with this count is that wave 5 (outlined) does not look like an impulse but rather an A-B-C formation, making this count unlikely.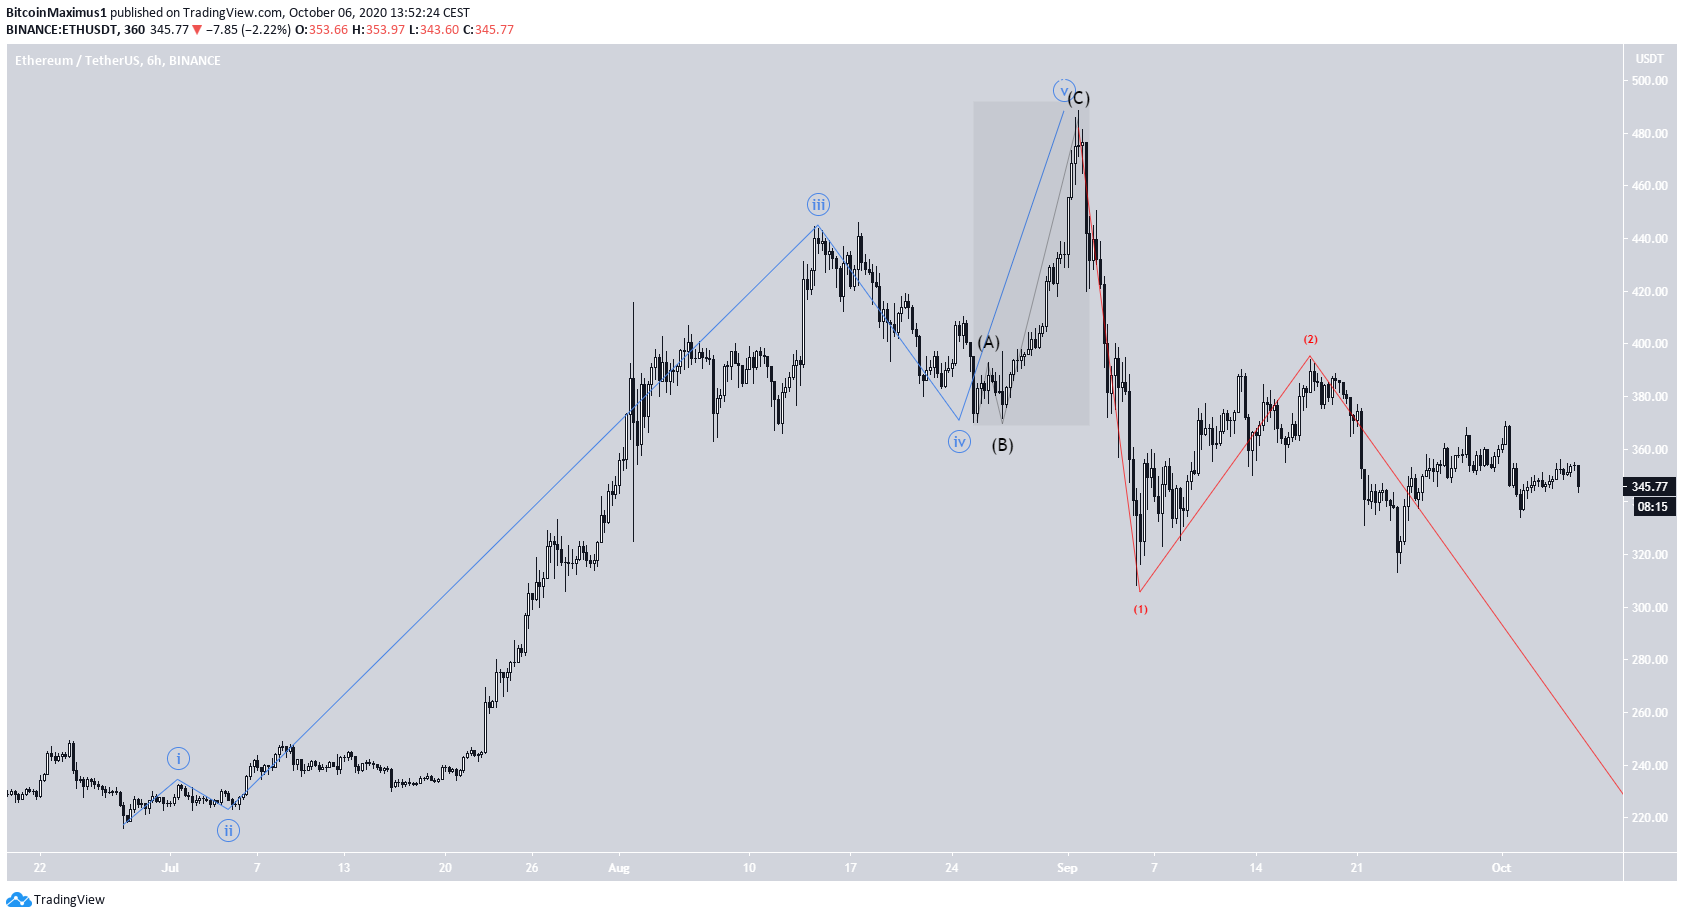 ETH Chart By TradingView
The bearish count would be invalidated with an increase above the Sept 17 high of $390, while its sub-wave count would be invalidated with an increase above the Oct 1 high of $368.1.
ETH Chart By TradingView
The bearish count would be invalidated with an increase above the Sept 17 high of $390, while its sub-wave count would be invalidated with an increase above the Oct 1 high of $368.1.
ETH/BTC
The ETH/BTC chart shows movement relatively similar to its USD counterpart. The price has broken out from a descending resistance line in place since the Sept 1 high but failed to increase significantly after doing so. Currently, the price is approaching the ₿0.0315 support area, with the main resistance levels being found at ₿0.0333 and ₿.036. Technical indicators are neutral/bearish, and a bullish cross in the stochastic oscillator is seemingly getting rejected. Therefore, there is not sufficient evidence to determine the direction of the future trend.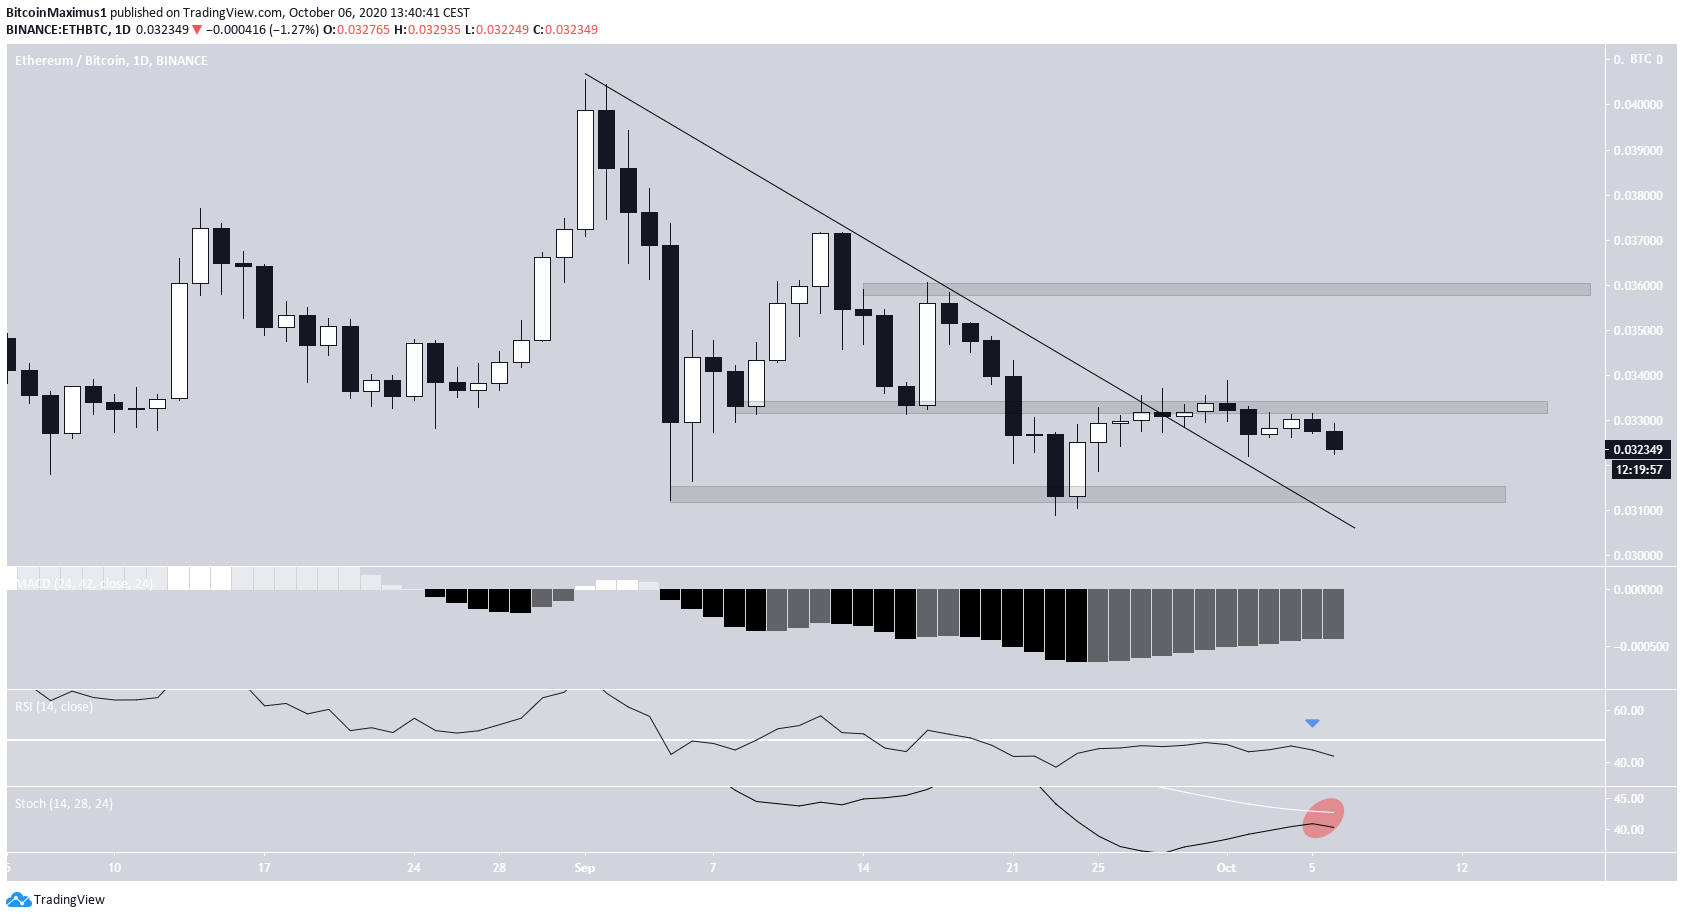
Top crypto projects in the US | April 2024
Trusted
Disclaimer
In line with the Trust Project guidelines, this price analysis article is for informational purposes only and should not be considered financial or investment advice. BeInCrypto is committed to accurate, unbiased reporting, but market conditions are subject to change without notice. Always conduct your own research and consult with a professional before making any financial decisions. Please note that our Terms and Conditions, Privacy Policy, and Disclaimers have been updated.

Valdrin Tahiri
Valdrin discovered cryptocurrencies while he was getting his MSc in Financial Markets from the Barcelona School of Economics. Shortly after graduating, he began writing for several different cryptocurrency related websites as a freelancer before eventually taking on the role of BeInCrypto's Senior Analyst.
(I do not have a discord and will not contact you first there. Beware of scammers)
READ FULL BIO
Sponsored
Sponsored