

Between Feb 24-26, the ETH price was subject to a significant decrease and has since been trading in a range between ₿0.0251-₿0.0263.
Ethereum (ETH) Price Highlights
- The price is trading in a range between ₿0.0251-₿0.0263.
- It is trading inside a short-term descending wedge.
- There is strong support at ₿0.0253 and ₿0.0225.
- The price is trading inside a longer-term symmetrical triangle.
Note: This is a short-term analysis. For the longer-term version, please click here.Have no idea what to expect on the $ETH dollar pair but relative to Bitcoin, it still looks like it wants to move lower. pic.twitter.com/ww77AmSd0S
— Luke Martin (@VentureCoinist) March 4, 2020
Descending Wedge
Since Feb 26, the Ethereum price has been trading in a range between ₿0.0251-₿0.0263. It reached the resistance line on March 2 and has been decreasing since. The decrease has taken the form of a descending wedge, which is considered a bullish reversal pattern. In addition, there is bullish divergence developing inside this pattern. These signs add up to an eventual breakout that would take the price to the top of this range. However, the tweet outlines a symmetrical triangle instead of a wedge, albeit at a higher time-frame. Let’s zoom out in order to take a look at it and determine if this short-term increase will cause a breakout from the longer-term triangle.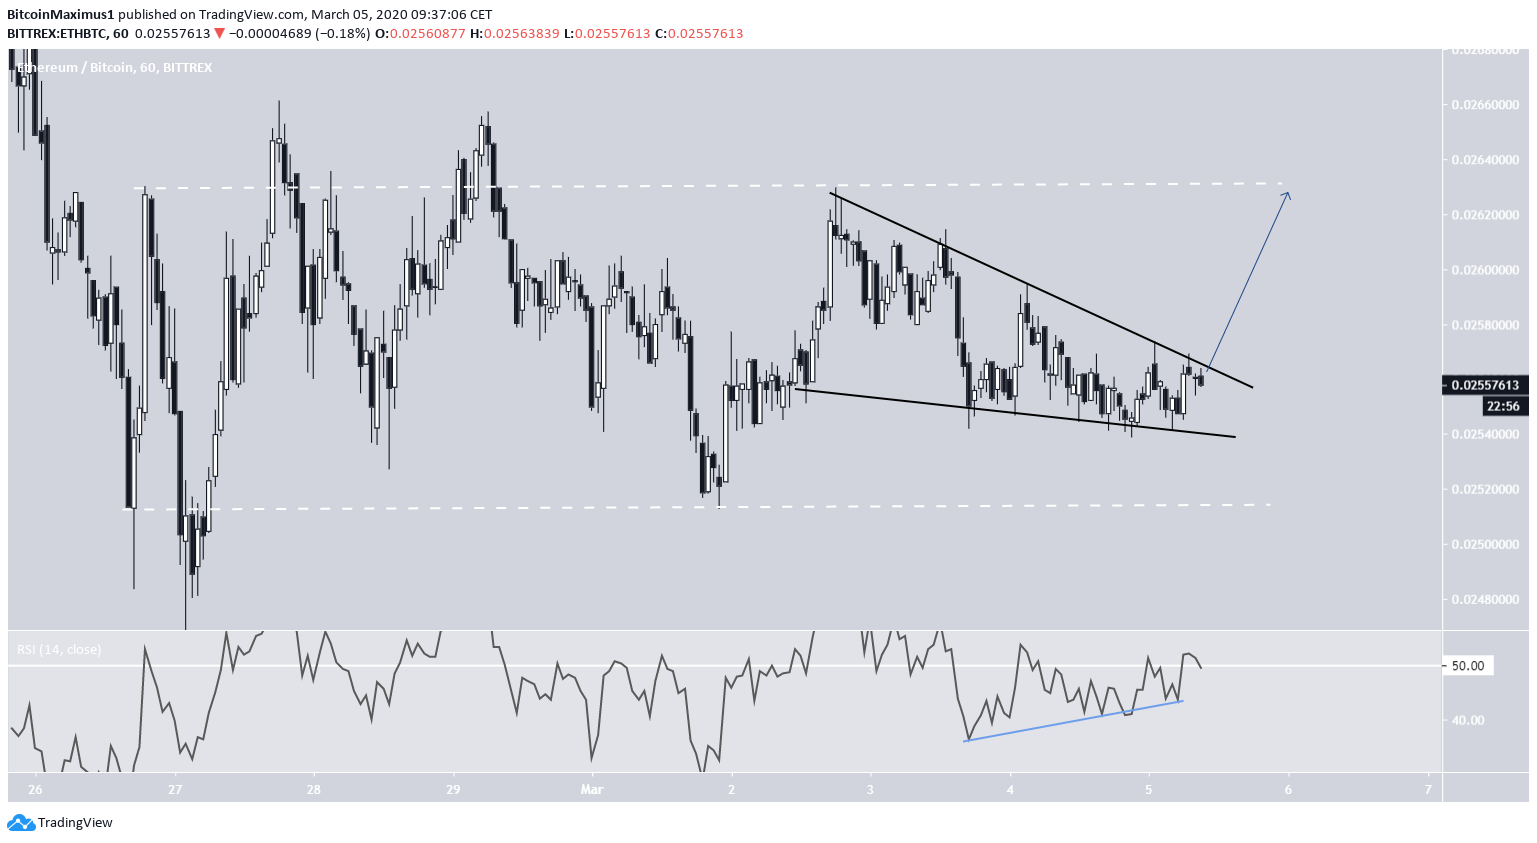
Symmetrical Triangle
The six-hour chart reveals that the proposed breakout would likely take the price all the way to the resistance line of the symmetrical triangle, but not necessarily cause a breakout. Since the triangle is considered a neutral pattern and is succeeding a price decrease, the expected movement would be a breakdown. This is supported by the fact that each successive bounce from the ₿0.0253 support area has been weaker, as evidenced by the lower-highs created.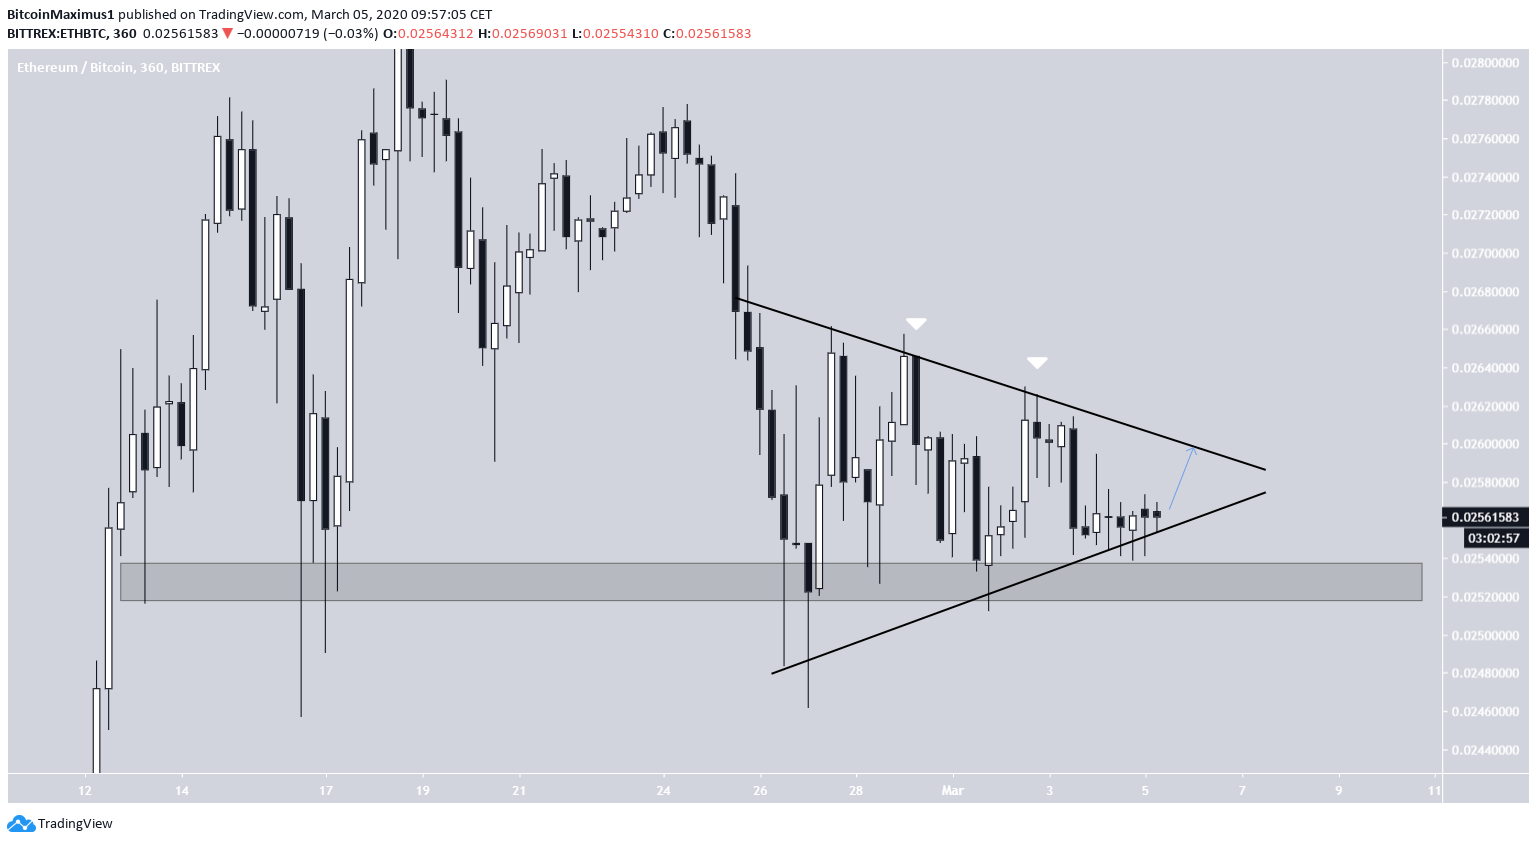 If the proposed breakdown happens, it would mean that ETH would fall below the ₿0.0253 support area and head lower towards the next support area at ₿0.0225.
A breakout above the resistance line would invalidate this possibility.
If the proposed breakdown happens, it would mean that ETH would fall below the ₿0.0253 support area and head lower towards the next support area at ₿0.0225.
A breakout above the resistance line would invalidate this possibility.
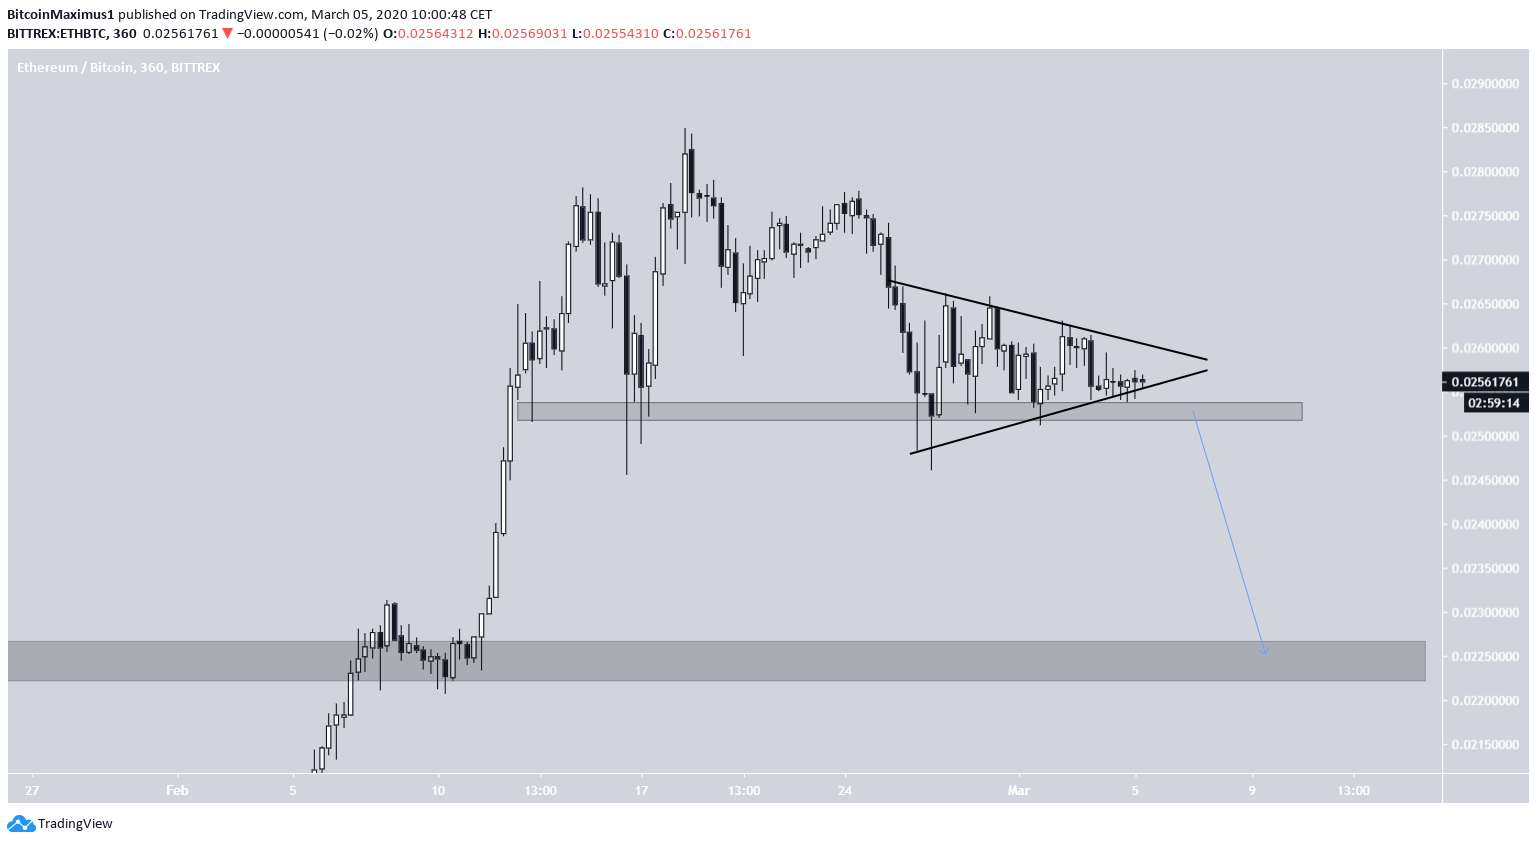 To conclude, the Ethereum price has created a descending wedge, out of which it looks likely to break out of. However, this is expected to be a short-term movement, and Ethereum is expected to break down from its longer-term pattern afterward and reach the support area outlined above.
Top crypto projects in the US | April 2024
Trusted
Disclaimer
In line with the Trust Project guidelines, this price analysis article is for informational purposes only and should not be considered financial or investment advice. BeInCrypto is committed to accurate, unbiased reporting, but market conditions are subject to change without notice. Always conduct your own research and consult with a professional before making any financial decisions. Please note that our Terms and Conditions, Privacy Policy, and Disclaimers have been updated.

Valdrin Tahiri
Valdrin discovered cryptocurrencies while he was getting his MSc in Financial Markets from the Barcelona School of Economics. Shortly after graduating, he began writing for several different cryptocurrency related websites as a freelancer before eventually taking on the role of BeInCrypto's Senior Analyst.
(I do not have a discord and will not contact you first there. Beware of scammers)
READ FULL BIO
Sponsored
Sponsored