
On Mar 6, 2019, Ethereum (ETH) reached a high near $144. A gradual drop followed with Ethereum’s price continues following a downward trend.
Here’s a look at the prices between Mar 6 and 15:
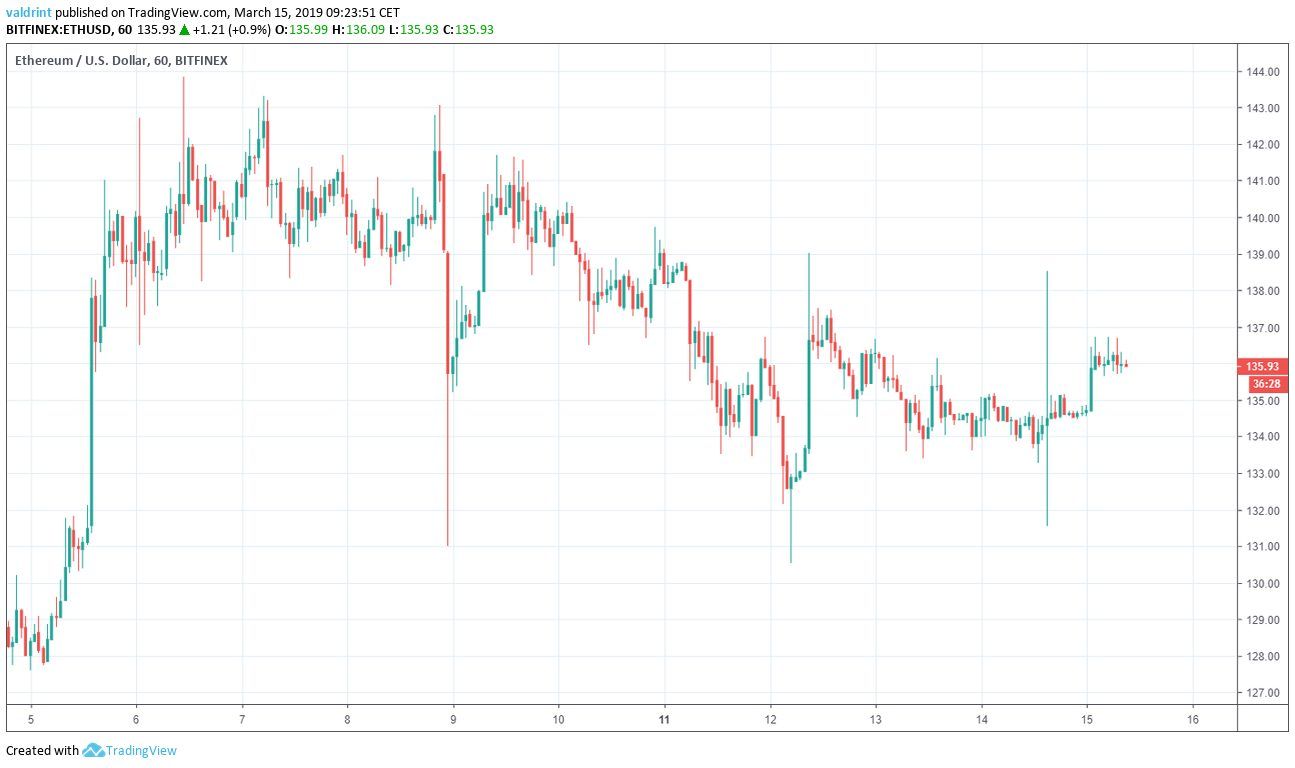 In our Mar 14 analysis of Ethereum, we predicted that the price would trade above $134 before a subsequent price increase. Since that time, the price has risen slightly to current levels of $136.
Based on today’s analysis, we believe that a slight drop in the price of ETH is to be expected but that a breakout should follow initiating price increases.
In our Mar 14 analysis of Ethereum, we predicted that the price would trade above $134 before a subsequent price increase. Since that time, the price has risen slightly to current levels of $136.
Based on today’s analysis, we believe that a slight drop in the price of ETH is to be expected but that a breakout should follow initiating price increases.
Key Highlights For March 14
- The price of Ethereum (ETH) has been on a downward trend since Mar 6.
- It has been trading inside a medium-term descending channel and a short-term ascending triangle.
- There are resistance areas near $153 and $145.
- There is a support area near $126.
- There has been bullish divergence developing.
Descending Resistance Line
The price of ETH on Bitfinex was analyzed at one-hour intervals from Mar 6 to Mar 15. On Mar 6, the price of ETH reached a high of $143.83. A gradual decrease followed. Several market cycles were completed between Mar 4 and 15 with each high being lower than the last. Tracing these successive highs gives us a descending resistance line.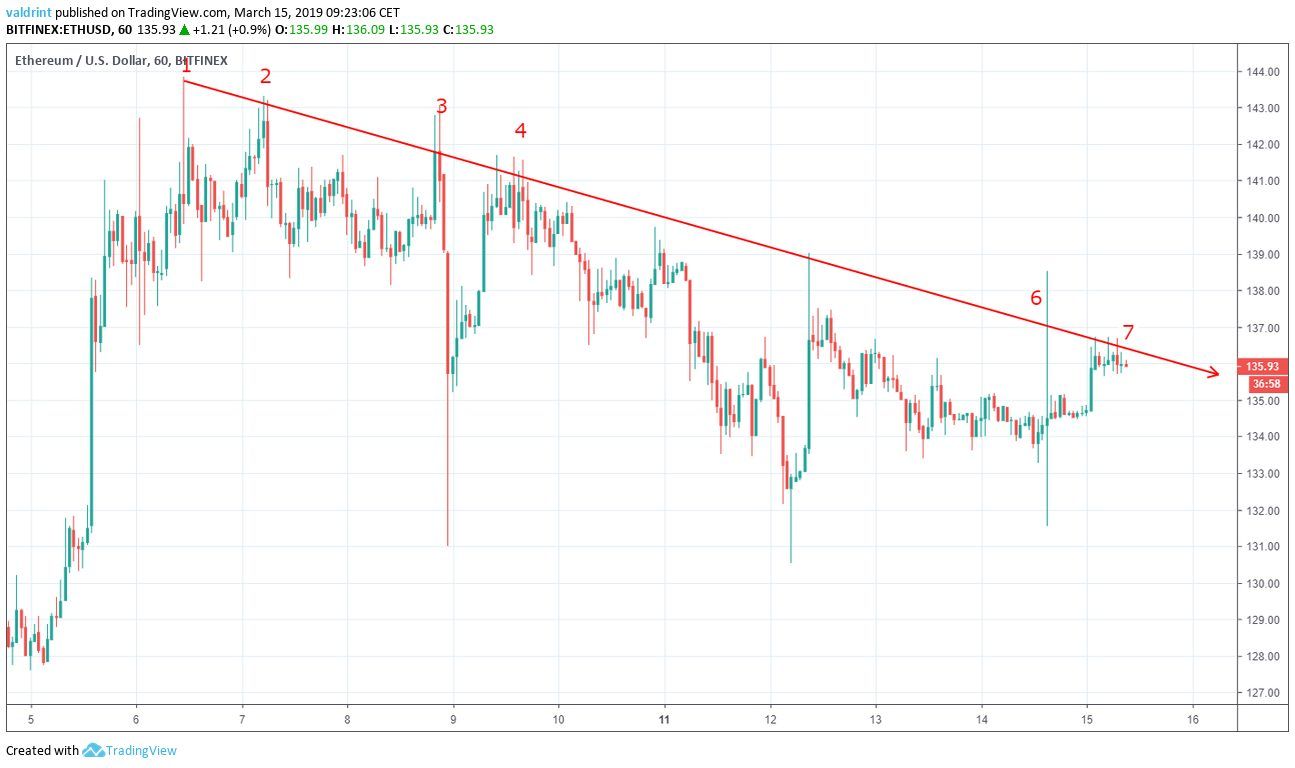 The resistance line can act as a ceiling to price. It should theoretically trace the upper limits of price over a period of time. It also gauges the rate of a price decrease.
The price of ETH has decreased at the same rate as predicted by the resistance line. Furthermore, the downward trend for ETH may be a market response to its prior rapid increases.
Further price decreases at a rate predicted by the descending resistance line are to be expected. However, the resistance line alone is not sufficient to determine how long these decreases may last.
The resistance line can act as a ceiling to price. It should theoretically trace the upper limits of price over a period of time. It also gauges the rate of a price decrease.
The price of ETH has decreased at the same rate as predicted by the resistance line. Furthermore, the downward trend for ETH may be a market response to its prior rapid increases.
Further price decreases at a rate predicted by the descending resistance line are to be expected. However, the resistance line alone is not sufficient to determine how long these decreases may last.
Descending Channel
After reaching the Mar 6 high, a gradual decrease ensued. The price of ETH made a low of $131.0 on Mar 8. It made another low of $130.55 on Mar 12. Tracing the lines corresponding to the closing prices of those intervals gives us a descending support line.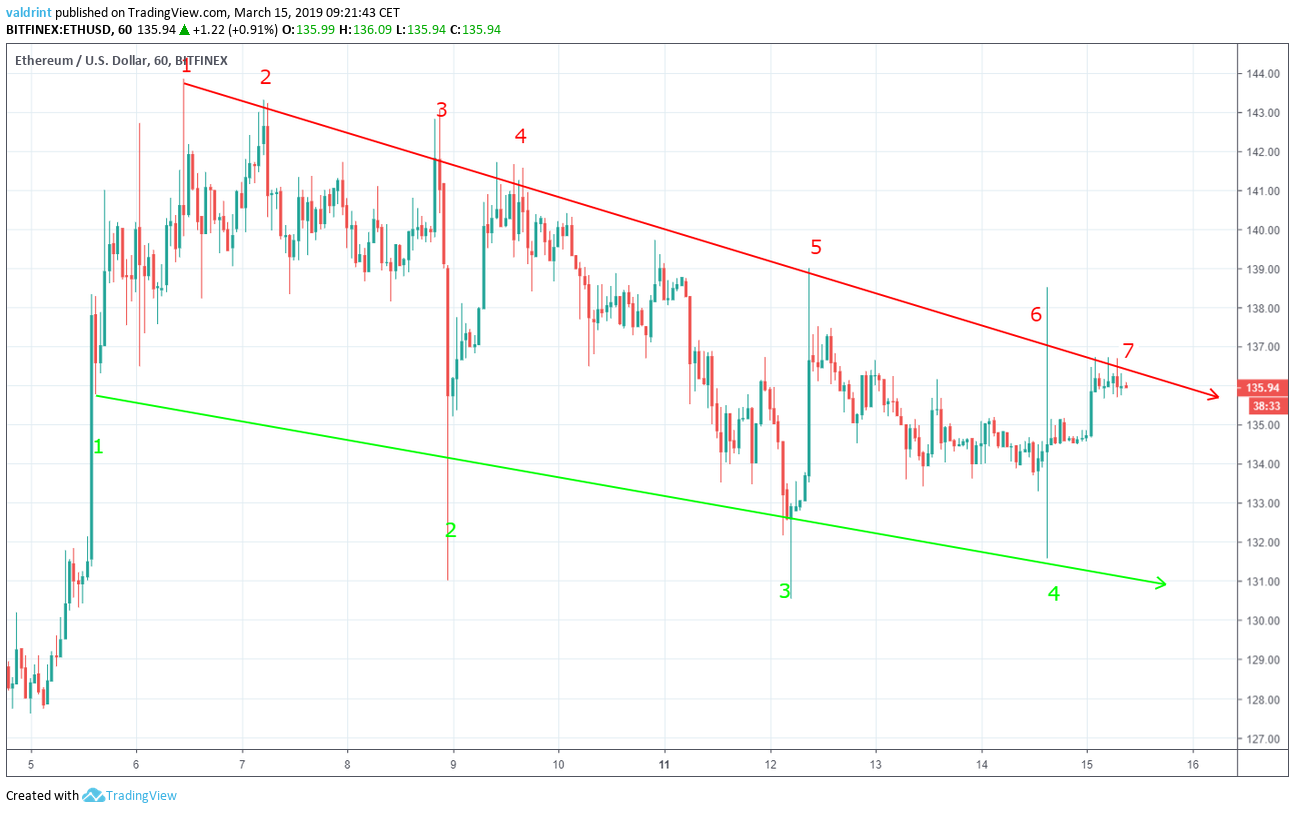 The support line can act as a floor to price similarly to the way resistance acts as a ceiling. It theoretically traces the lower limits of the price, preventing further downward movement.
Breakdowns below the support line by a wick in a volatile market are relatively unimportant as long as they are not supported by continued breakdowns. In the case of the ETH, one-hour lows rarely broke below support and were not supported by maintained losses.
The support and resistance lines combine to create a parallel descending channel which is considered a neutral pattern. Since the channel is trending downward, price decreases can be expected. However, the current channel does not help us determine whether price will move toward support or resistance. Price decreases and increases within the channel both appear possible.
Therefore, an analysis on a shorter time-frame is necessary.
The support line can act as a floor to price similarly to the way resistance acts as a ceiling. It theoretically traces the lower limits of the price, preventing further downward movement.
Breakdowns below the support line by a wick in a volatile market are relatively unimportant as long as they are not supported by continued breakdowns. In the case of the ETH, one-hour lows rarely broke below support and were not supported by maintained losses.
The support and resistance lines combine to create a parallel descending channel which is considered a neutral pattern. Since the channel is trending downward, price decreases can be expected. However, the current channel does not help us determine whether price will move toward support or resistance. Price decreases and increases within the channel both appear possible.
Therefore, an analysis on a shorter time-frame is necessary.
Ascending Triangle
The price of ETH on Bitfinex was analyzed at 15-minute intervals from Mar 12 to Mar 15. The price made a high of $136.39 on Mar 13. At the time of writing it has visited the same level five times. Tracing these highs gives us a horizontal resistance line. The price made a low of $132.82 on Mar 12. It has created higher lows since. Tracing these lows gives us the ascending support line.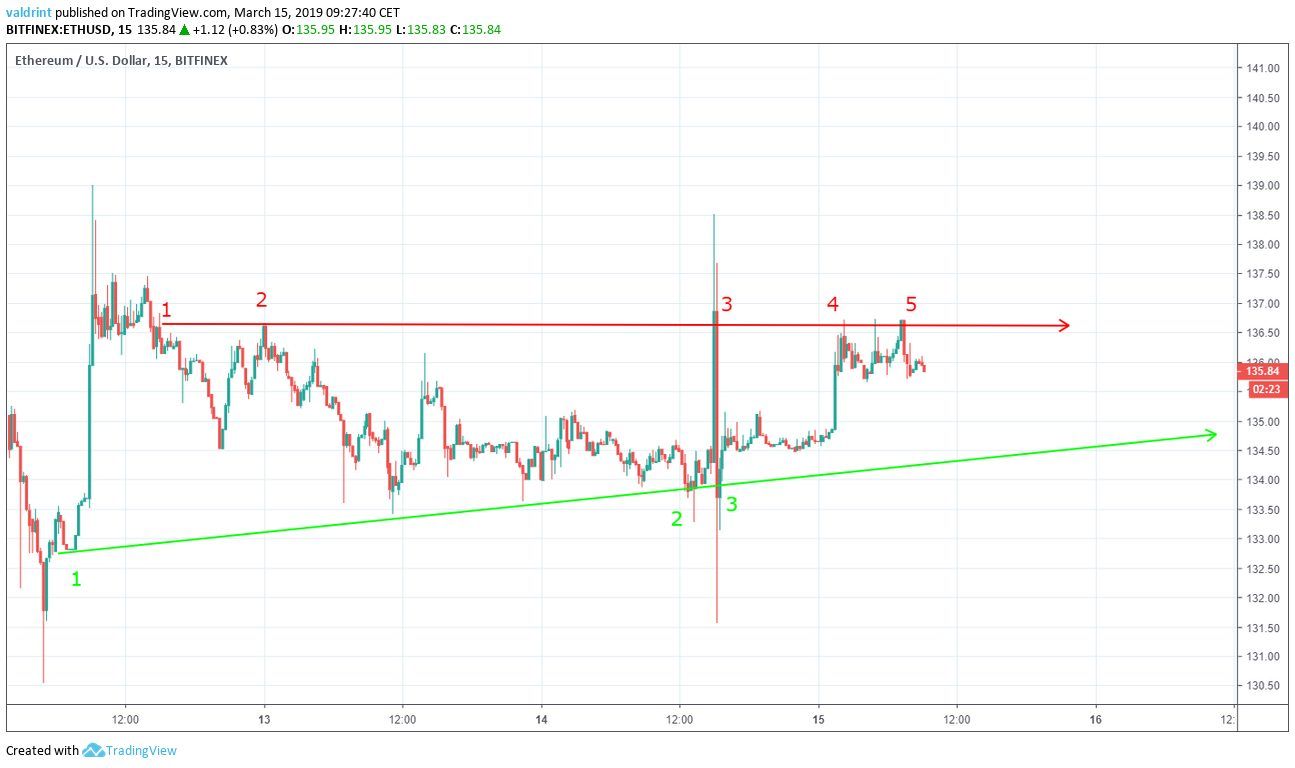 The support and resistance lines combine to create an ascending triangle, which is a bullish pattern, making price increases more likely.
Breakouts and breakdowns above/below the line can be considered insignificant if they are not supported by continuous gains/losses. This was the case with ETH.
Based on this pattern, the price is likely to trade inside the confines of the ascending triangle until a point of convergence occurs. Then a breakout is likely to happen.
The support and resistance lines combine to create an ascending triangle, which is a bullish pattern, making price increases more likely.
Breakouts and breakdowns above/below the line can be considered insignificant if they are not supported by continuous gains/losses. This was the case with ETH.
Based on this pattern, the price is likely to trade inside the confines of the ascending triangle until a point of convergence occurs. Then a breakout is likely to happen.
Potential Reversal
Combining relative strength index (RSI) bullish/bearish divergence with support/resistance essentially predicts price fluctuations. The RSI is an indicator which calculates the size of the changes in price in order to determine oversold or overbought conditions in the market.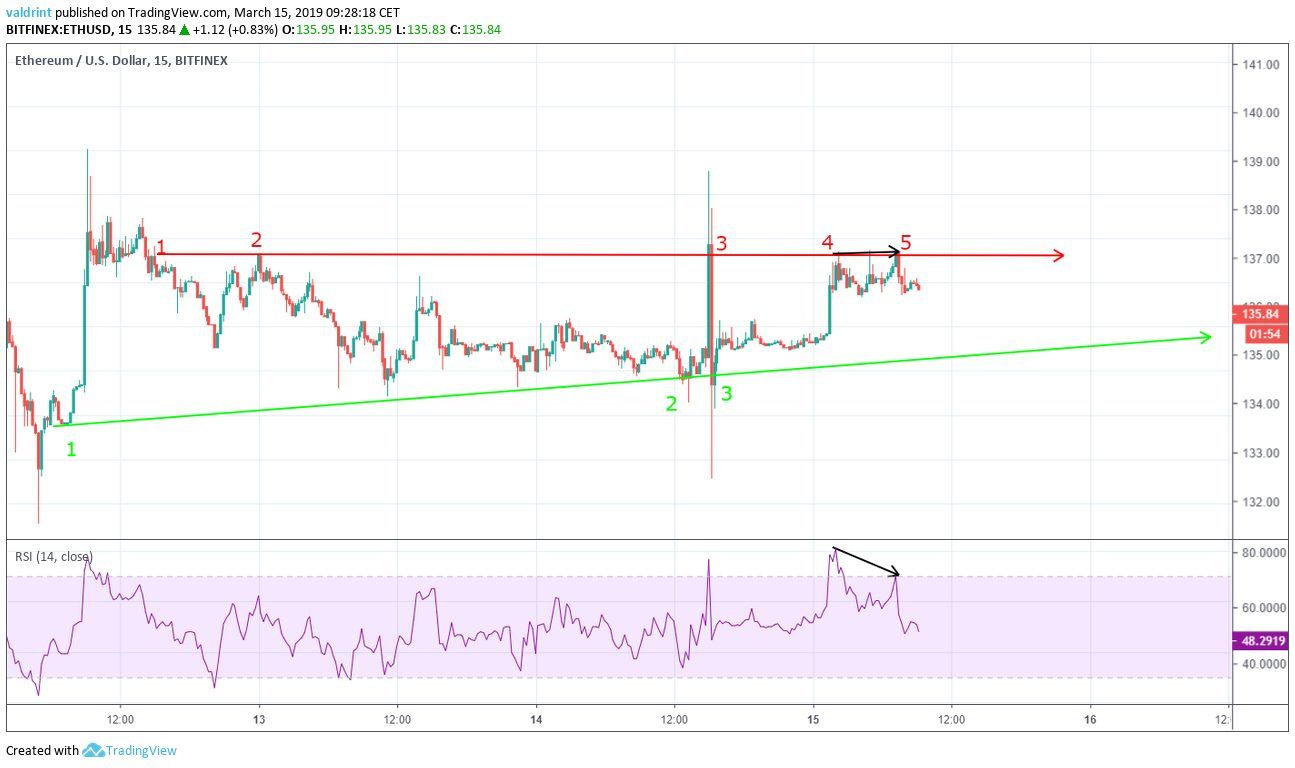 The price made a high of 136.54 on Mar 15. It revisited the same level a few hours later.
However, during the same interval, the RSI made the first high but continued to make a lower high. This is called bearish divergence and often precedes drops in price.
Using this indicator, it is likely that the price drops to touch the support line before eventually starting an upward move.
The price made a high of 136.54 on Mar 15. It revisited the same level a few hours later.
However, during the same interval, the RSI made the first high but continued to make a lower high. This is called bearish divergence and often precedes drops in price.
Using this indicator, it is likely that the price drops to touch the support line before eventually starting an upward move.
Resistance and Support Areas
The price of ETH on Bitfinex was analyzed at two-hour intervals from Feb 17 to Mar 14 to determine possible resistance and support areas during a breakout/breakdown situation.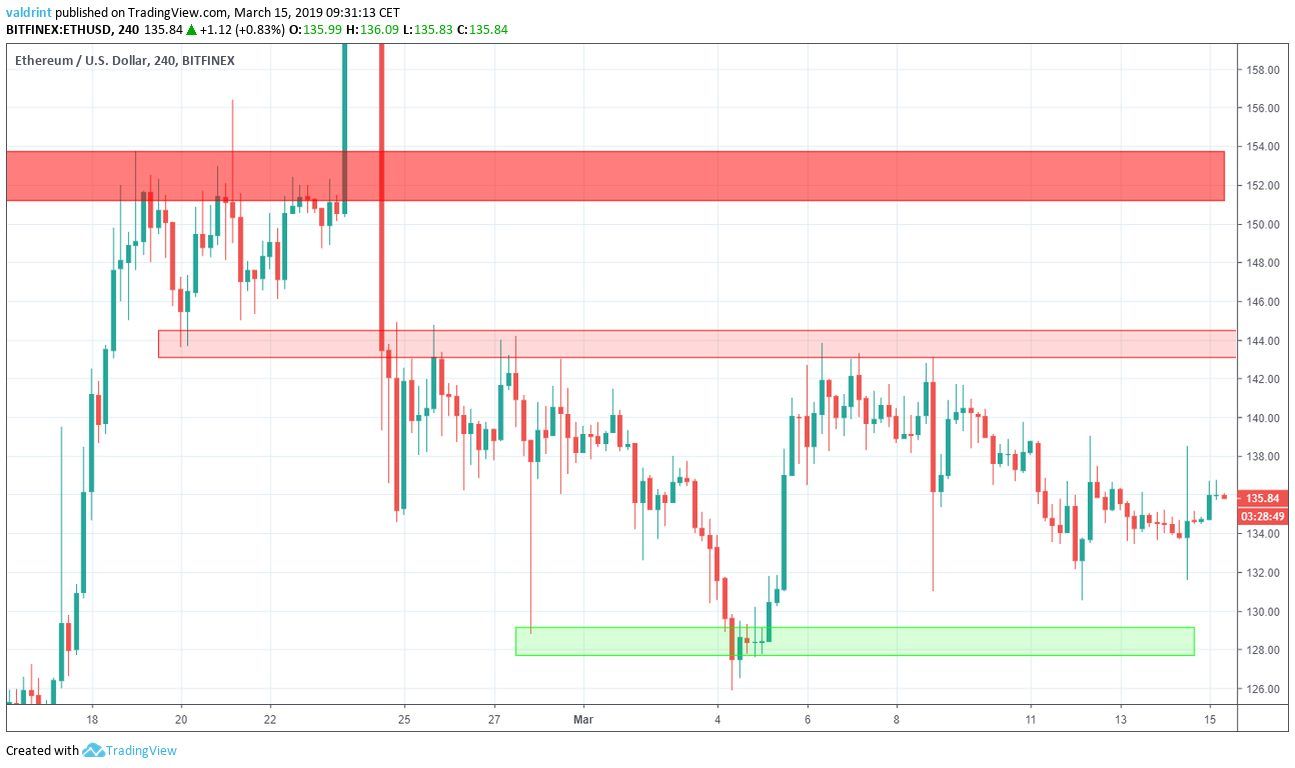 The first resistance area is located near $144, with the second being found near $153. If the price were to break out of the channel, these two would provide likely reversal areas. This means that a sudden breakout above the resistance line may lead to prices of $144 or $153.
The closest support area is found near $128. According to our analysis, it is unlikely that the price will reach this level soon.
The first resistance area is located near $144, with the second being found near $153. If the price were to break out of the channel, these two would provide likely reversal areas. This means that a sudden breakout above the resistance line may lead to prices of $144 or $153.
The closest support area is found near $128. According to our analysis, it is unlikely that the price will reach this level soon.
Summary of Analysis
Based on this analysis, the price of ETH is likely to keep trading inside the triangle until a breakout occurs. If the price breaks out of the triangle, the prediction will be partially validated. If it drops to touch the support line then initiates an upward move and breaks out, the prediction will be fully validated. A breakdown with prices dropping below $134 would invalidate the prediction. When do you think the breakout will occur? Let us know in the comments below. Disclaimer: This article is not trading advice and should not be construed as such. Always consult a trained financial professional before investing in cryptocurrencies, as the market is particularly volatile.
Top crypto projects in the US | April 2024
Trusted
Disclaimer
In line with the Trust Project guidelines, this price analysis article is for informational purposes only and should not be considered financial or investment advice. BeInCrypto is committed to accurate, unbiased reporting, but market conditions are subject to change without notice. Always conduct your own research and consult with a professional before making any financial decisions. Please note that our Terms and Conditions, Privacy Policy, and Disclaimers have been updated.

Valdrin Tahiri
Valdrin discovered cryptocurrencies while he was getting his MSc in Financial Markets from the Barcelona School of Economics. Shortly after graduating, he began writing for several different cryptocurrency related websites as a freelancer before eventually taking on the role of BeInCrypto's Senior Analyst.
(I do not have a discord and will not contact you first there. Beware of scammers)
READ FULL BIO
Sponsored
Sponsored