

The Ethereum Classic (ETC) price is currently making its fifth attempt to break out above the $7.40 resistance area.
Both technical indicators and the wave count support the possibility of a breakout, which would take ETC to at least $9.30.
Long-Term Resistance
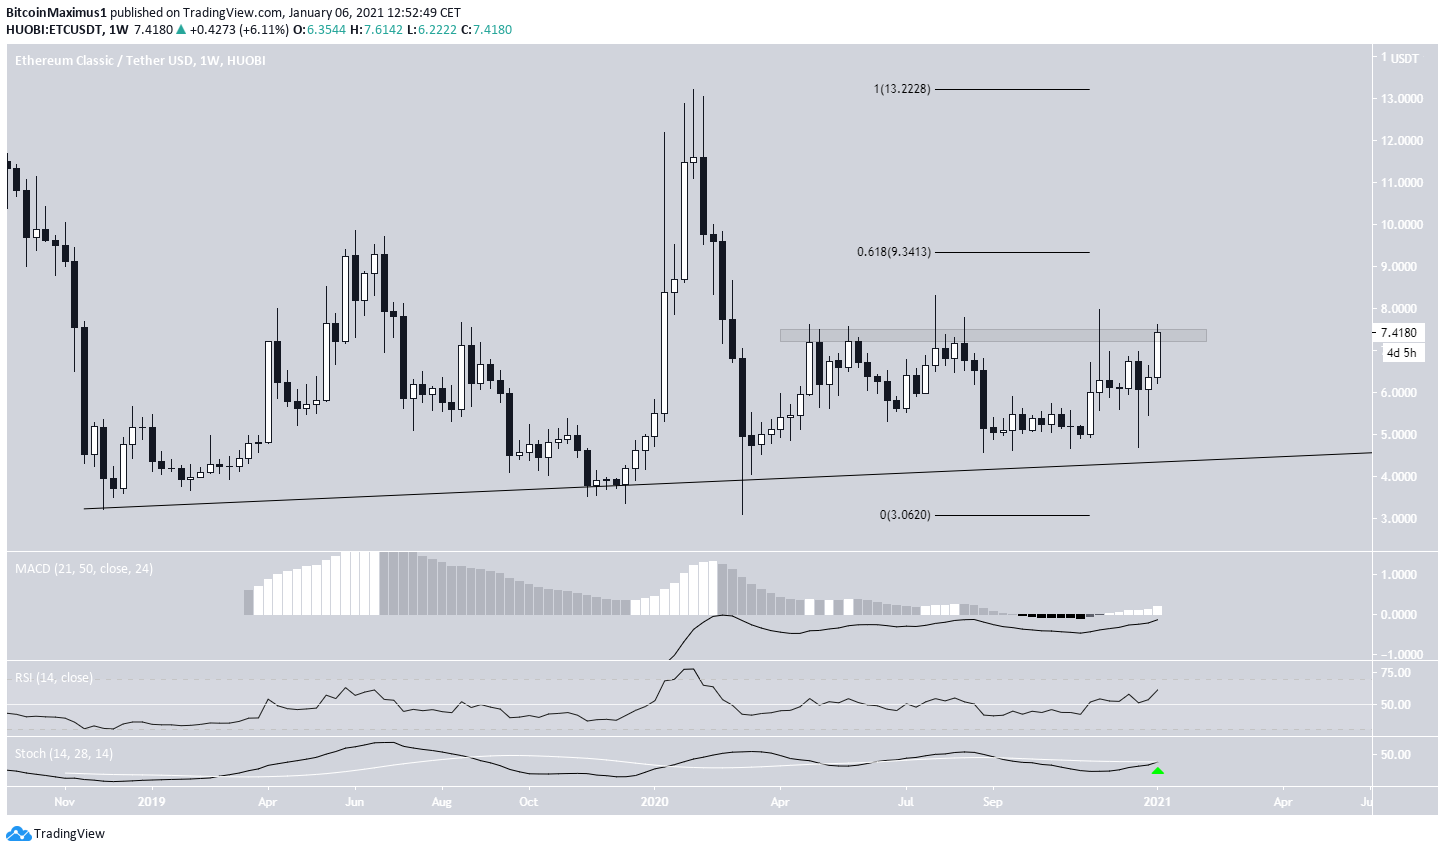
ETC has been trading below the $7.40 resistance area since the rapid decline in March. Until now, ETC has made four unsuccessful attempts to break out and is currently making its fifth one.
If successful, the next closest resistance area would be at $9.35, the 0.618 Fib retracement level of the entire downward movement.
Technical indicators are bullish, supporting the possibility of a breakout. In addition, ETC is also following an ascending support line, which currently sits just below $5.
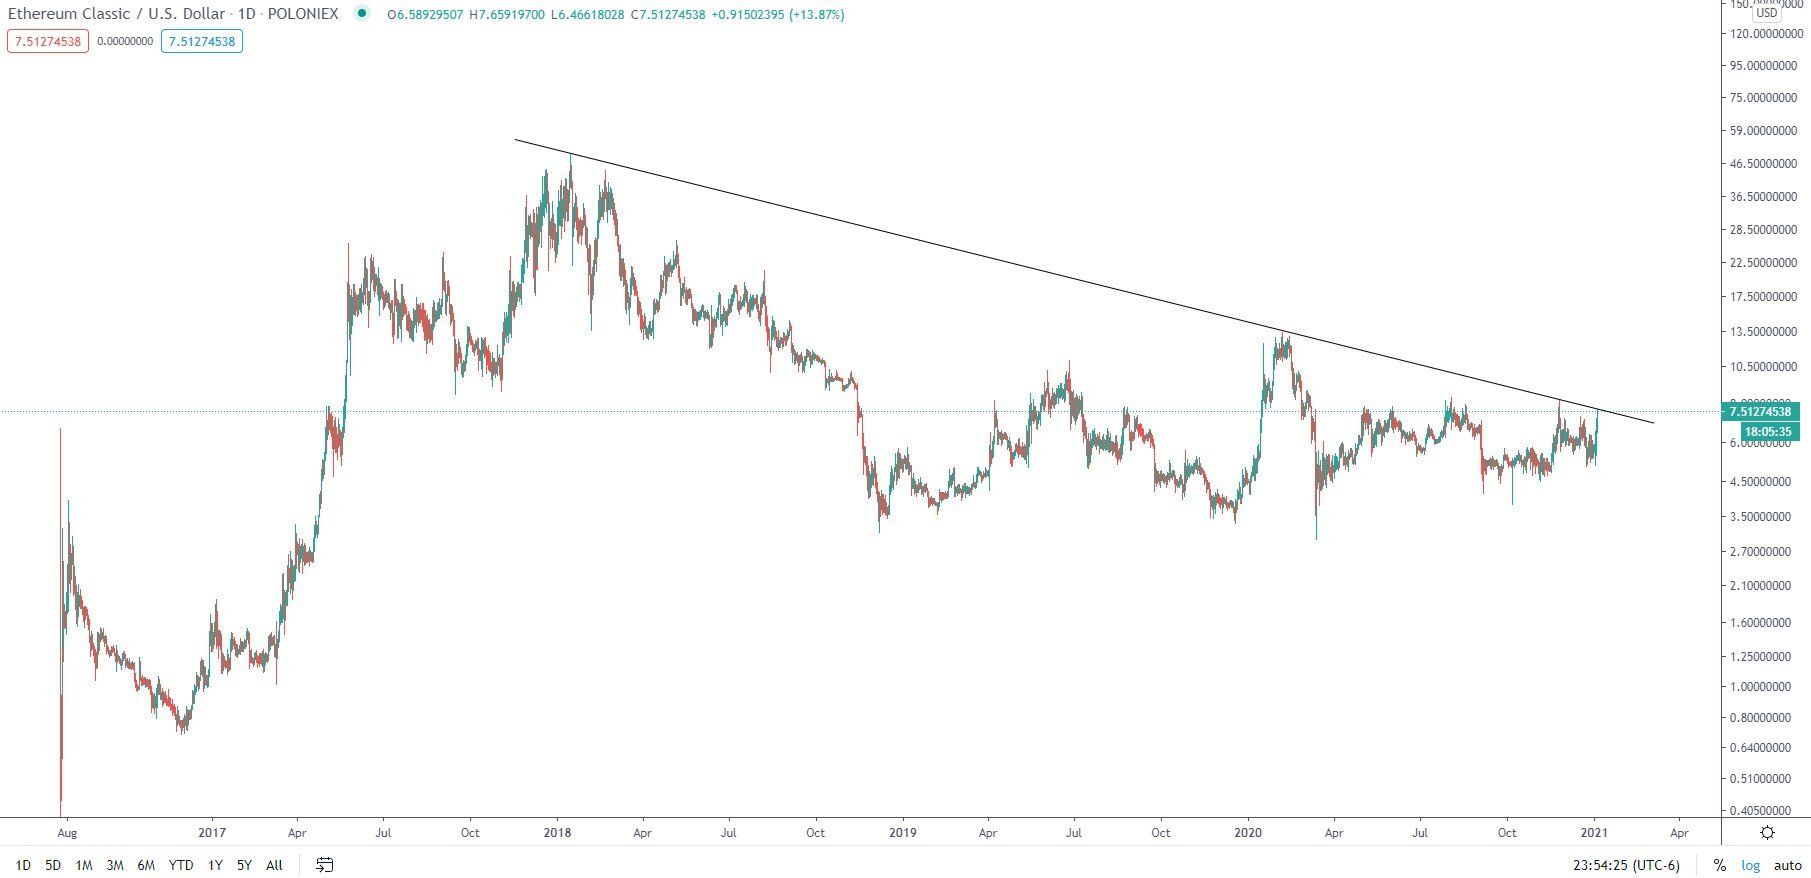
Cryptocurrency trader @CryptoKaleo outlined an ETC chart, stating that it’s in the process of breaking out from a three-year descending resistance line. However, the line is only visible when using the log chart, and since it coincides with the $7.40 resistance area, it seems somewhat redundant.
In any case, a breakout above $7.40 is likely to trigger an acceleration in the rate of increase.
Ongoing Breakout
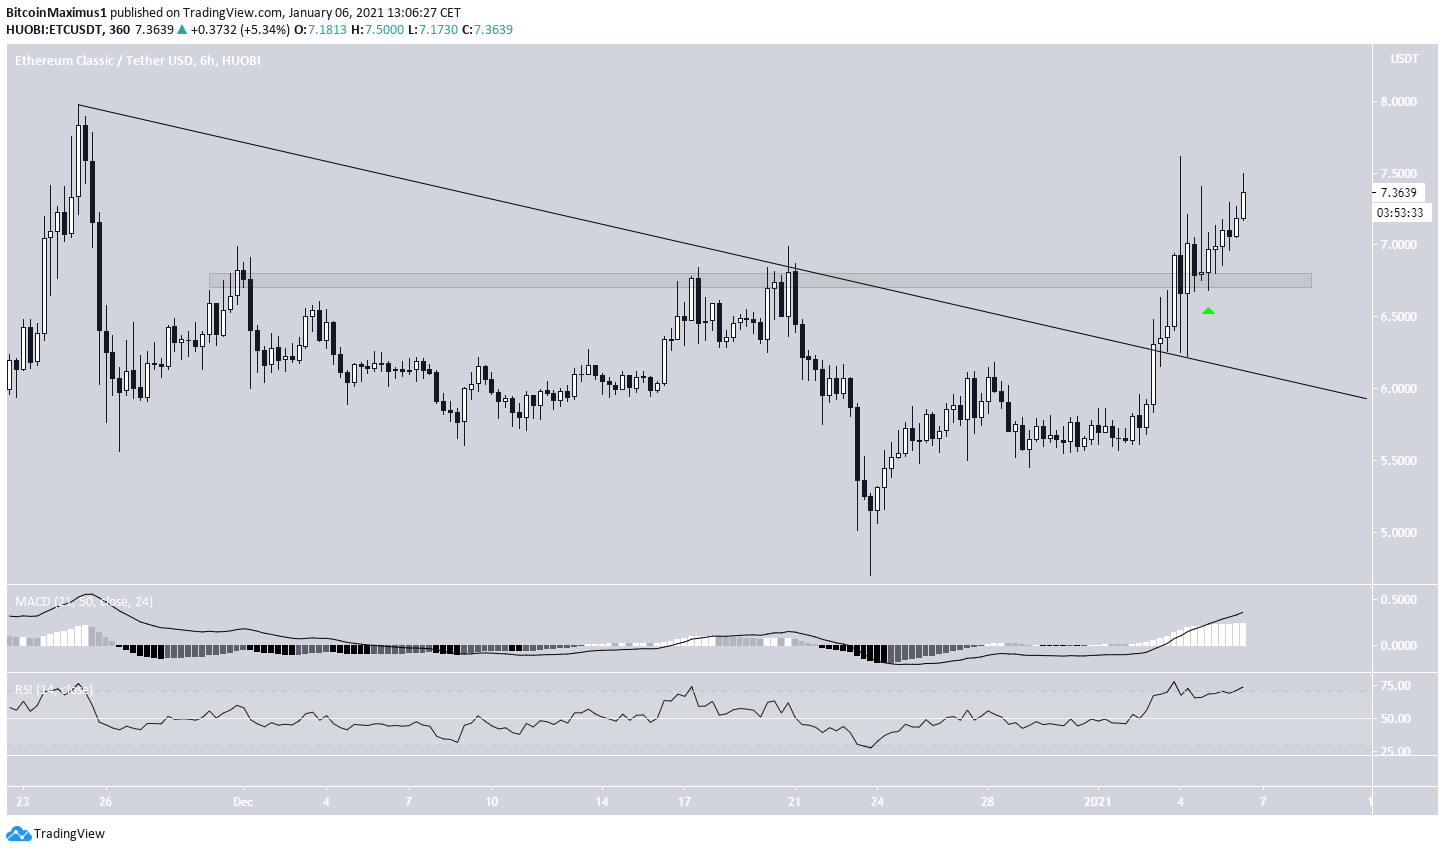
A look at lower time-frames shows that ETC has already broken out from a descending resistance line and validated it as support afterward. Furthermore, it has also reclaimed the $6.70 area, which is now likely to act as support.
Similar to the weekly time-frame, technical indicators are bullish. This suggests a continuation of the upward move and a breakout above the $7.40 resistance area.
Therefore, as long as ETC is trading above $6.70, it should continue rallying.
Wave Count
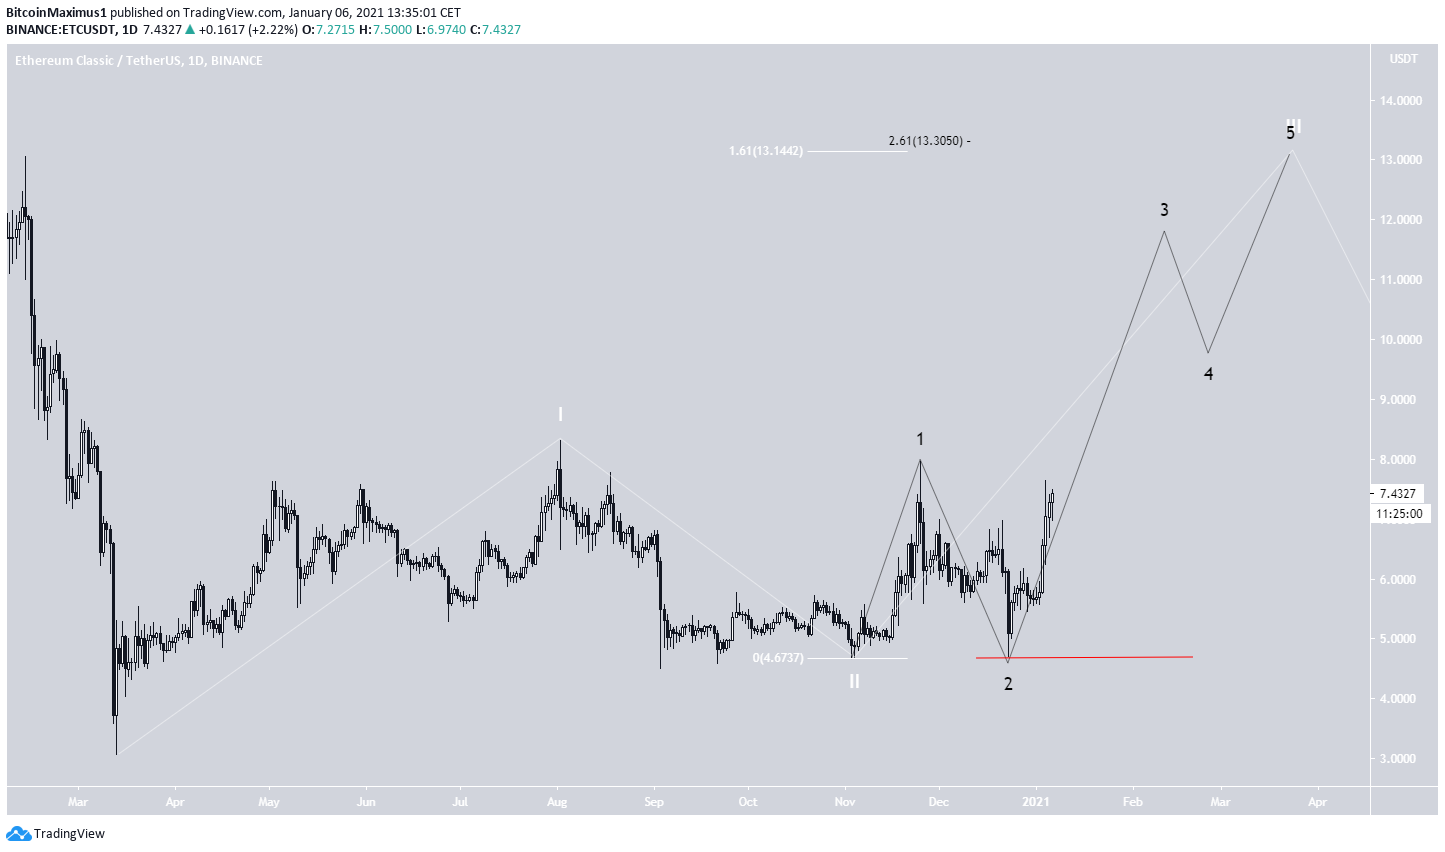
The wave count suggests that ETC has just begun wave 3 (shown in white below), currently having completed sub-waves 1 and 2 (shown in black below).
A preliminary target for the top of the move is between $13.14 – $13.30, the 1.61 Fib extension of wave 1 (white) and the 2.61 Fib extension of sub-wave 1 (black).
A fall below the sub-wave 2 low at $4.71 would invalidate this particular wave count.
Conclusion
To conclude, ETC should break out above the current resistance area, and increase towards $9.34 and possibly $13.10.
The rate of increase is likely to accelerate as soon as ETC decisively breaks out above $7.40.
For BeInCrypto’s latest Bitcoin (BTC) analysis, click here!
Disclaimer: Cryptocurrency trading carries a high level of risk and may not be suitable for all investors. The views expressed in this article do not reflect those of BeInCrypto.
Trusted
Disclaimer
In line with the Trust Project guidelines, this price analysis article is for informational purposes only and should not be considered financial or investment advice. BeInCrypto is committed to accurate, unbiased reporting, but market conditions are subject to change without notice. Always conduct your own research and consult with a professional before making any financial decisions. Please note that our Terms and Conditions, Privacy Policy, and Disclaimers have been updated.
