

At BeInCrypto, we offer regular price analyses and predictions of the most popular and relevant cryptoassets. In our Apr 19 analysis of EOS (EOS), we predicted price decreases. Our prediction was validated on Apr 21, when the price reached the support area we defined. To learn more, read our EOS/USD($) and EOS/EUR(€) analysis below:
On Apr 10, 2019, the price of EOS reached a high of $6.07 and €5.38. A sharp increase ensued, and the price reached a low of $5.07 and €4.53 on Apr 12. After a gradual increase, the price dropped to the same levels on Apr 22.
EOS: Trends And Highlights For April 22, 2019
- EOS reached a high of $6.07 and €5.38 on Apr 10.
- It is trading inside a horizontal channel.
- Bullish divergence is developing in the RSI.
- There is support near $4.9 and €4.35.
Tracing the Current Trading Pattern
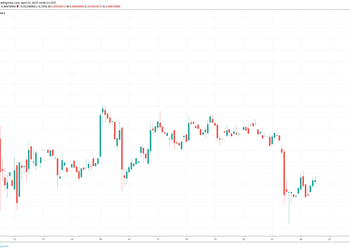
The price of EOS on Binance was analyzed at two-hour intervals from Apr 12 to Apr 22 to trace the current trading pattern. We do not include euros in this section because only one trading pair is needed to accomplish this. Both EOS/USD and EOS/EUR are discussed in the final section.
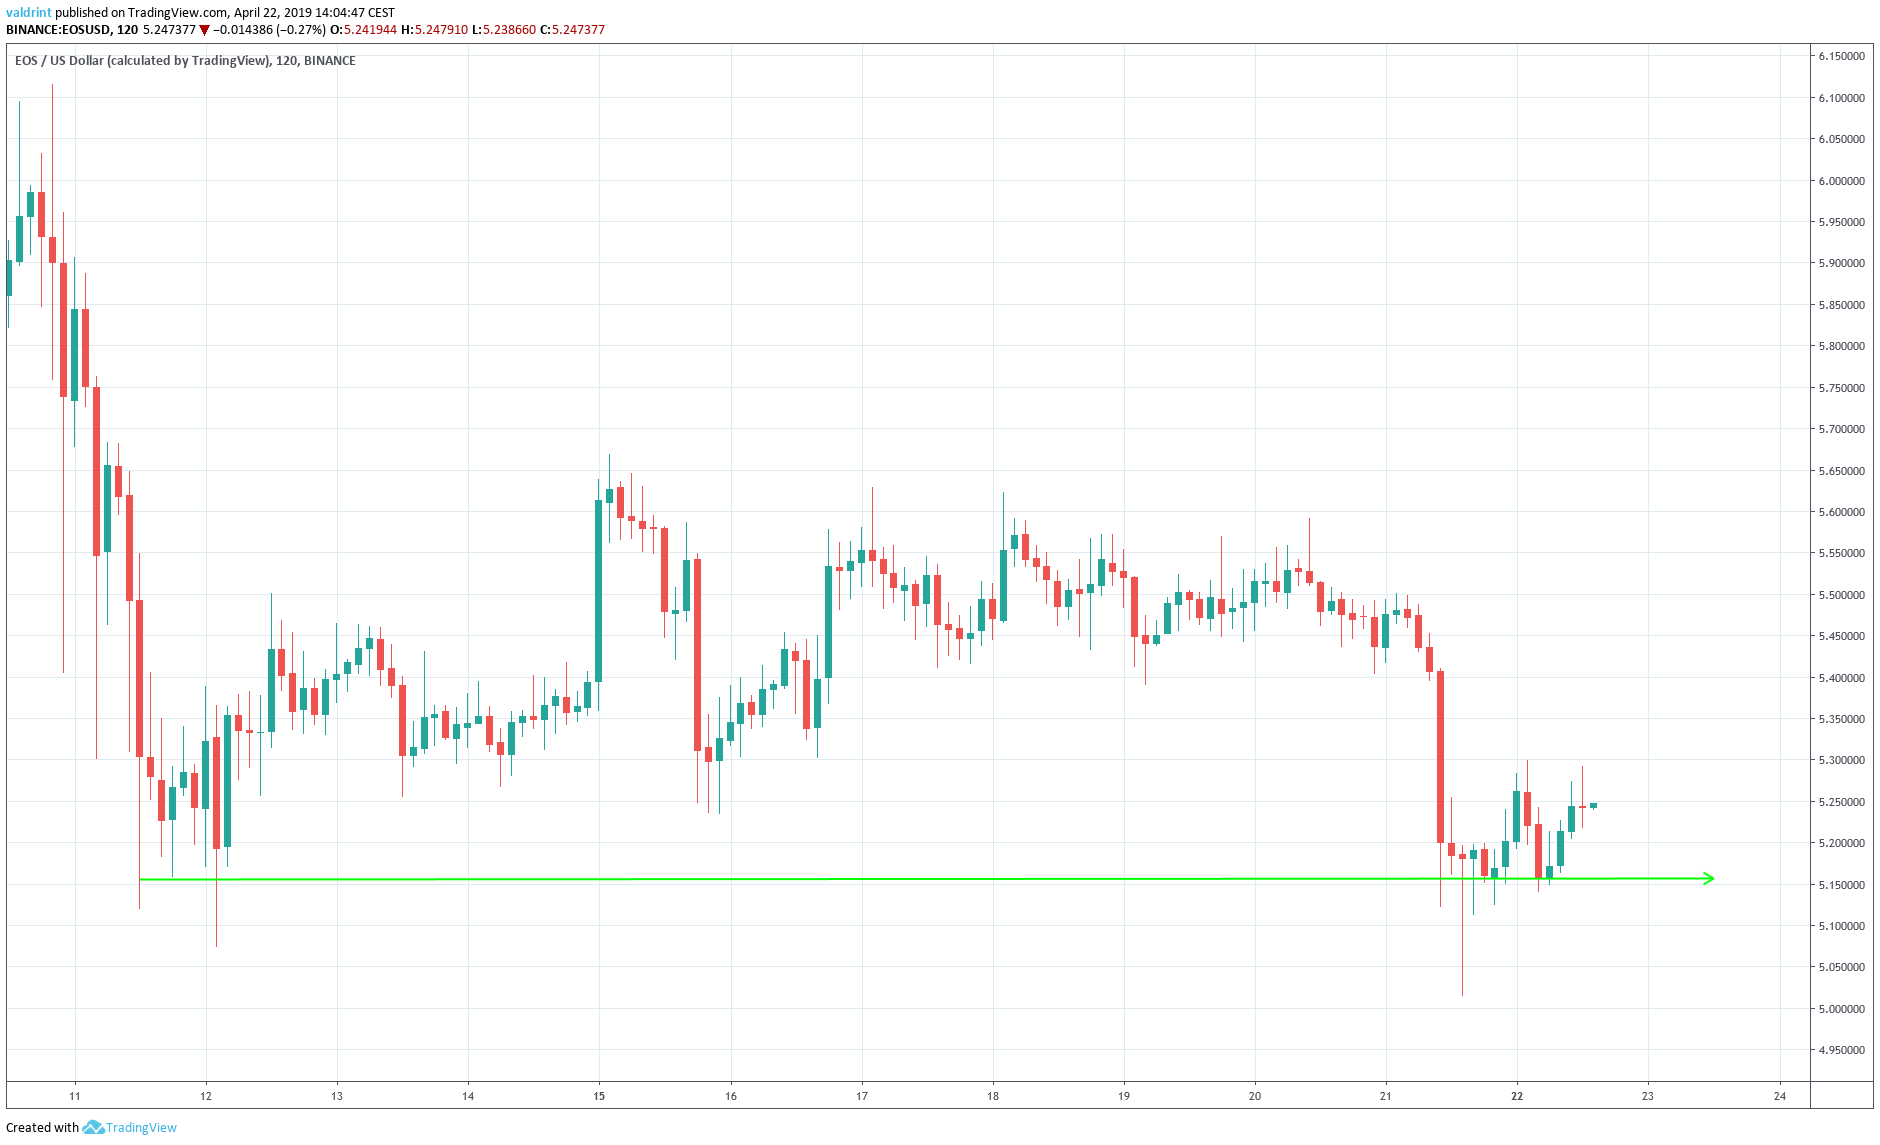
On Apr 11, the price made a low of $5.11. Several market cycles have been completed and the price has reached a similar level four times. Most recently, these levels were reached on Apr 21 and 22.
Tracing these lows gives us a horizontal support line:
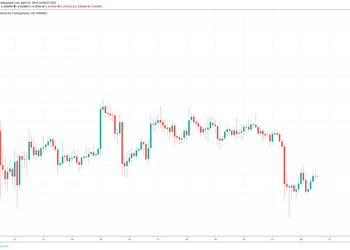
 On Apr 11, the price reached an hourly high of $5.64. Several market cycles have been completed and the price has reached the same level three times.
Tracing these highs gives us a horizontal resistance line.
On Apr 11, the price reached an hourly high of $5.64. Several market cycles have been completed and the price has reached the same level three times.
Tracing these highs gives us a horizontal resistance line.
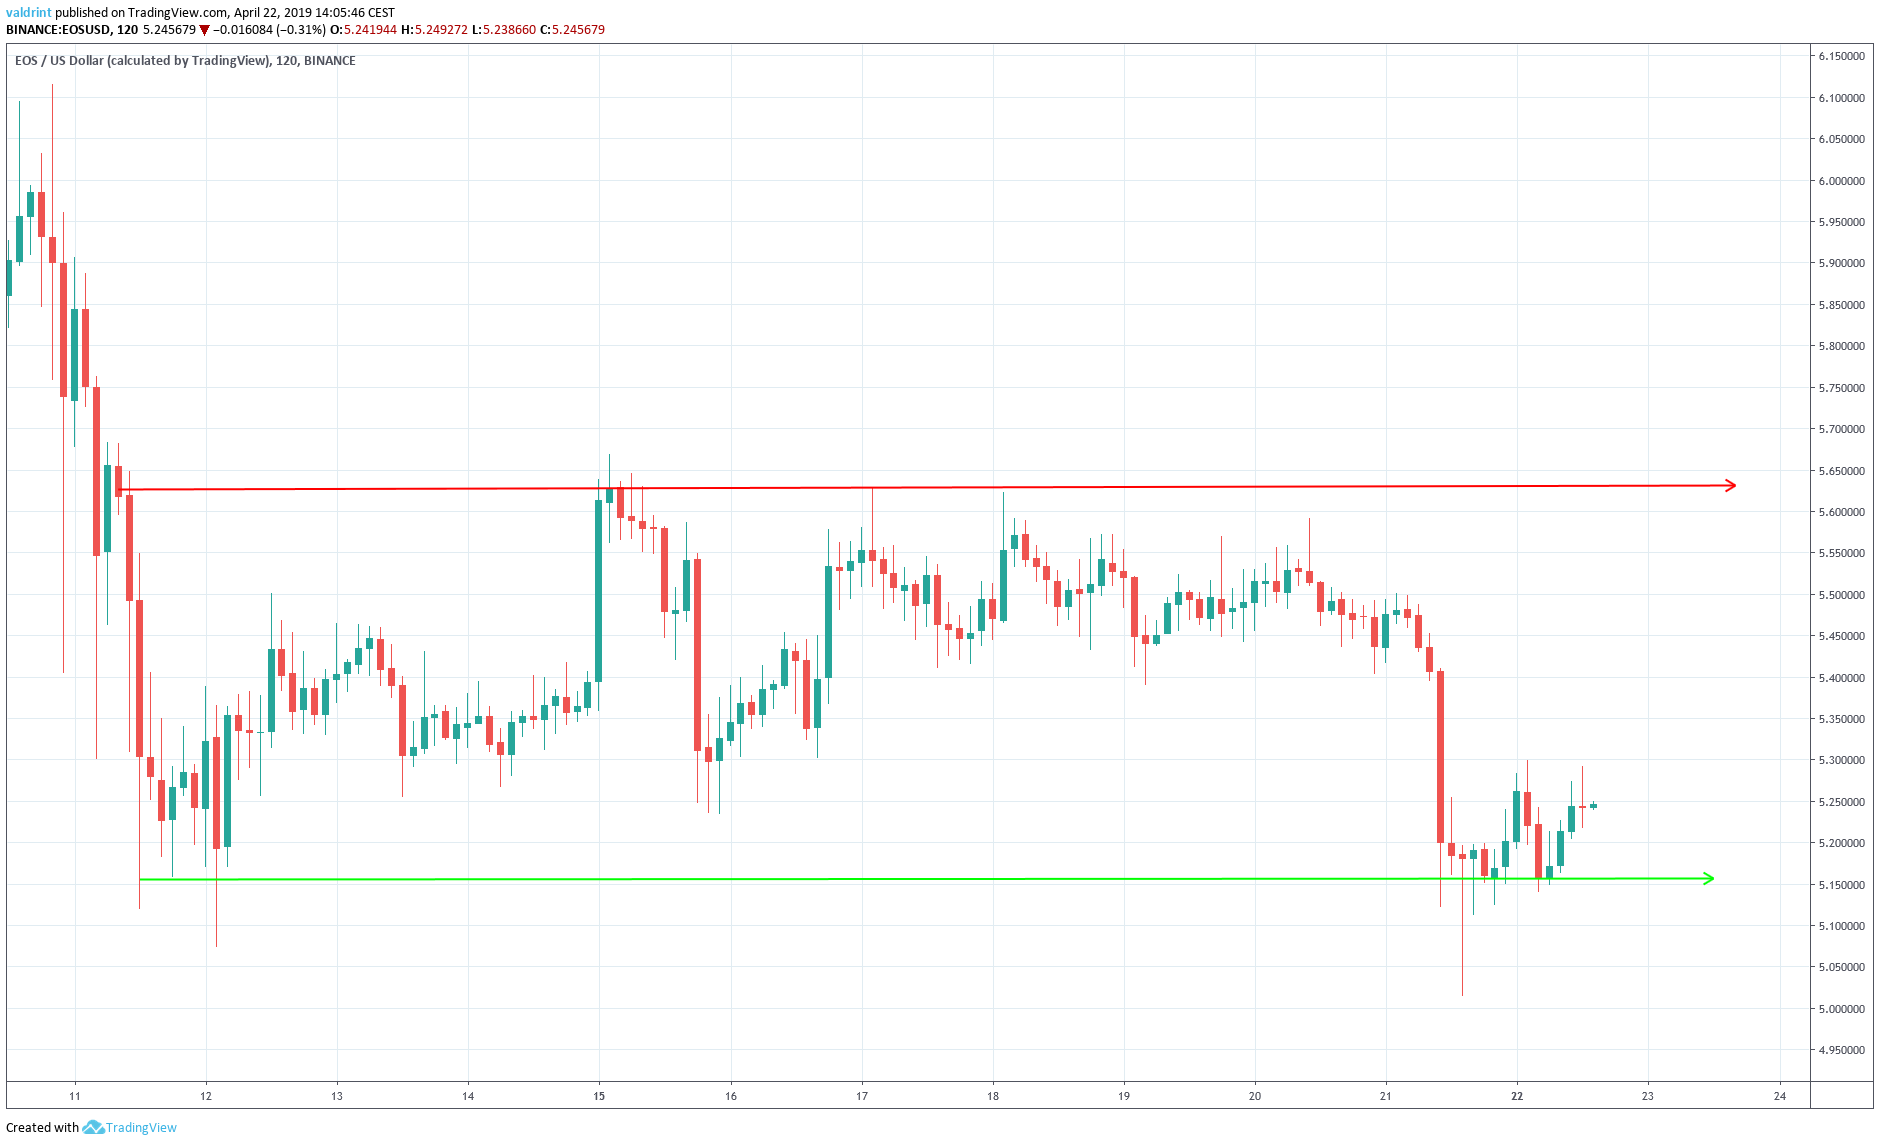 The resistance and support lines combine to create a horizontal channel.
It is likely that the price will keep trading inside the confines of this channel until a decisive move occurs.
In order to figure out the direction of the move, we need to look at some technical indicators.
The resistance and support lines combine to create a horizontal channel.
It is likely that the price will keep trading inside the confines of this channel until a decisive move occurs.
In order to figure out the direction of the move, we need to look at some technical indicators.
Technical Indicators
In this section, we incorporate RSI in our analysis to better assess possible future price fluctuations.The relative strength index (RSI) is an indicator which calculates the size of the changes in price in order to determine oversold or overbought conditions in the market.
The RSI is traced for EOS/USD below:
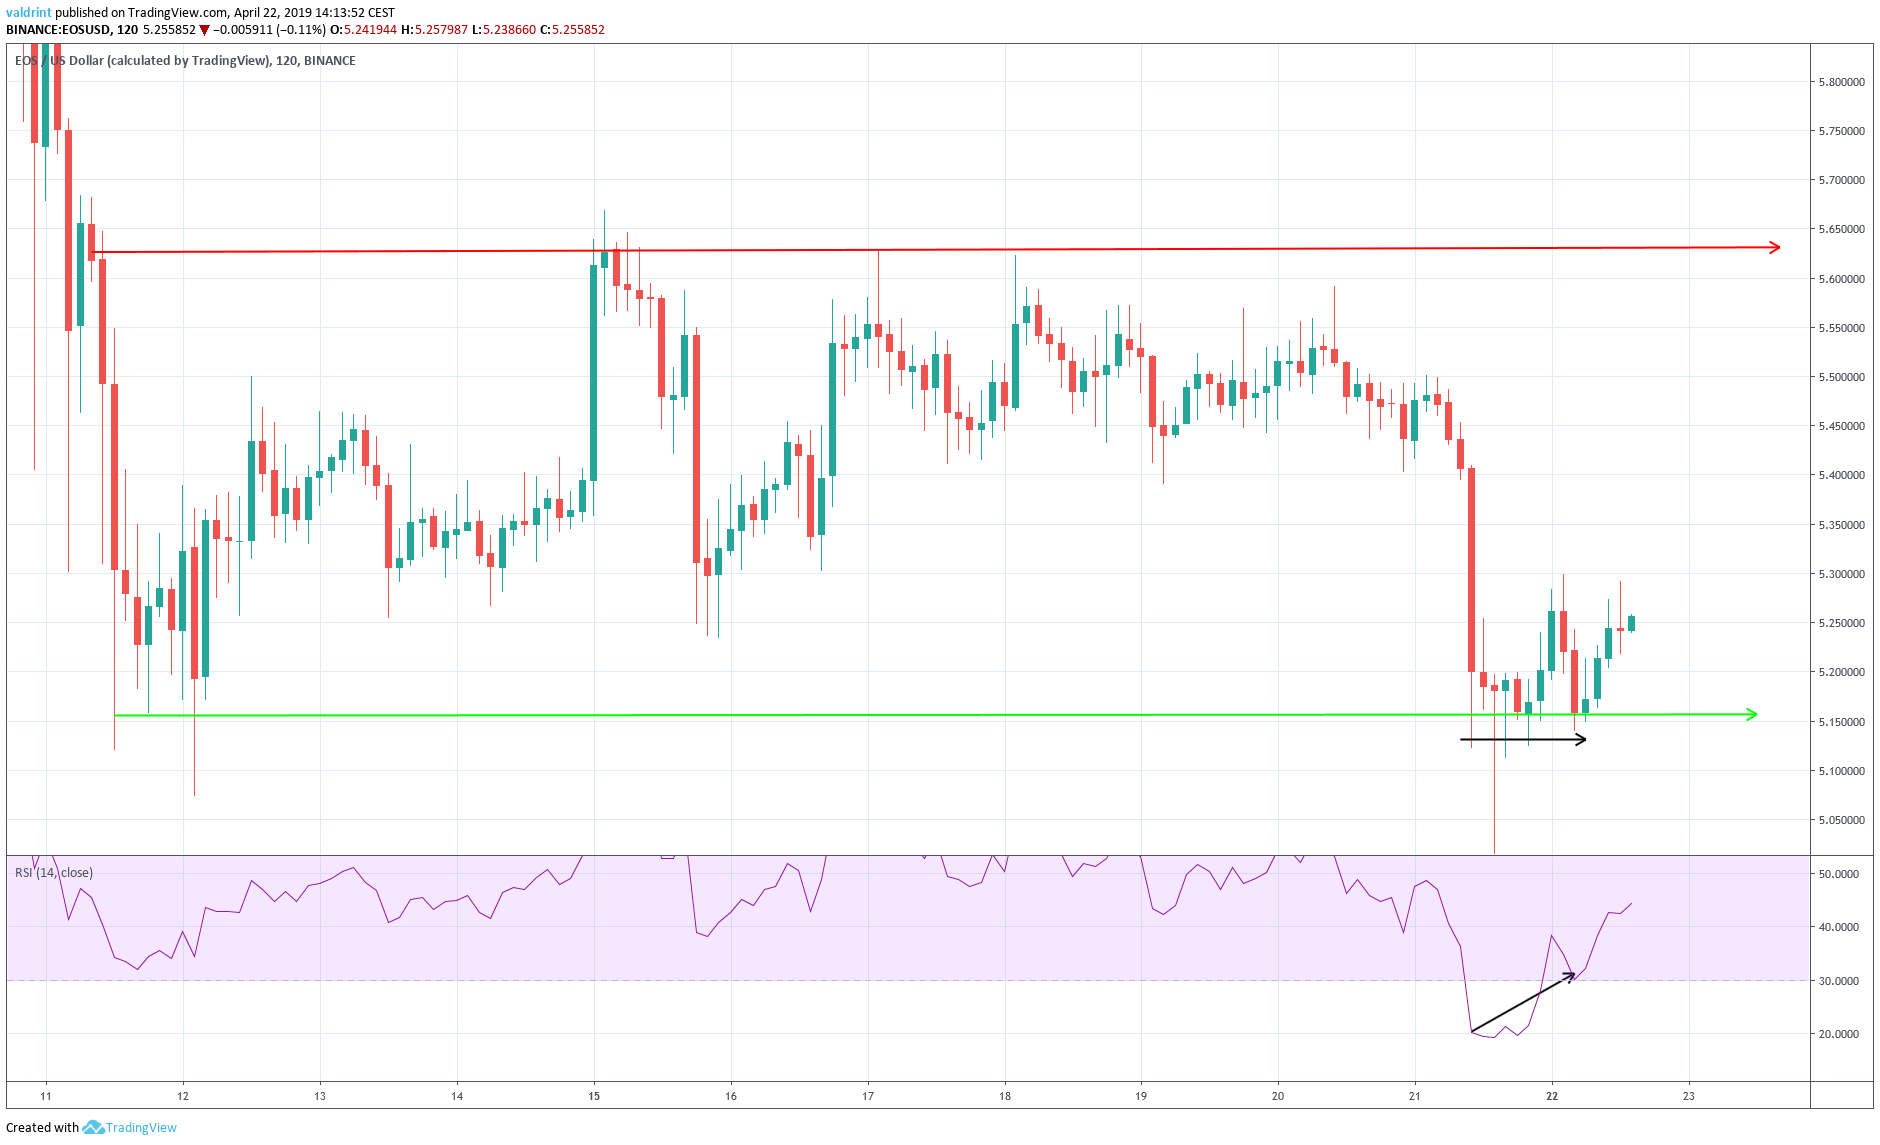
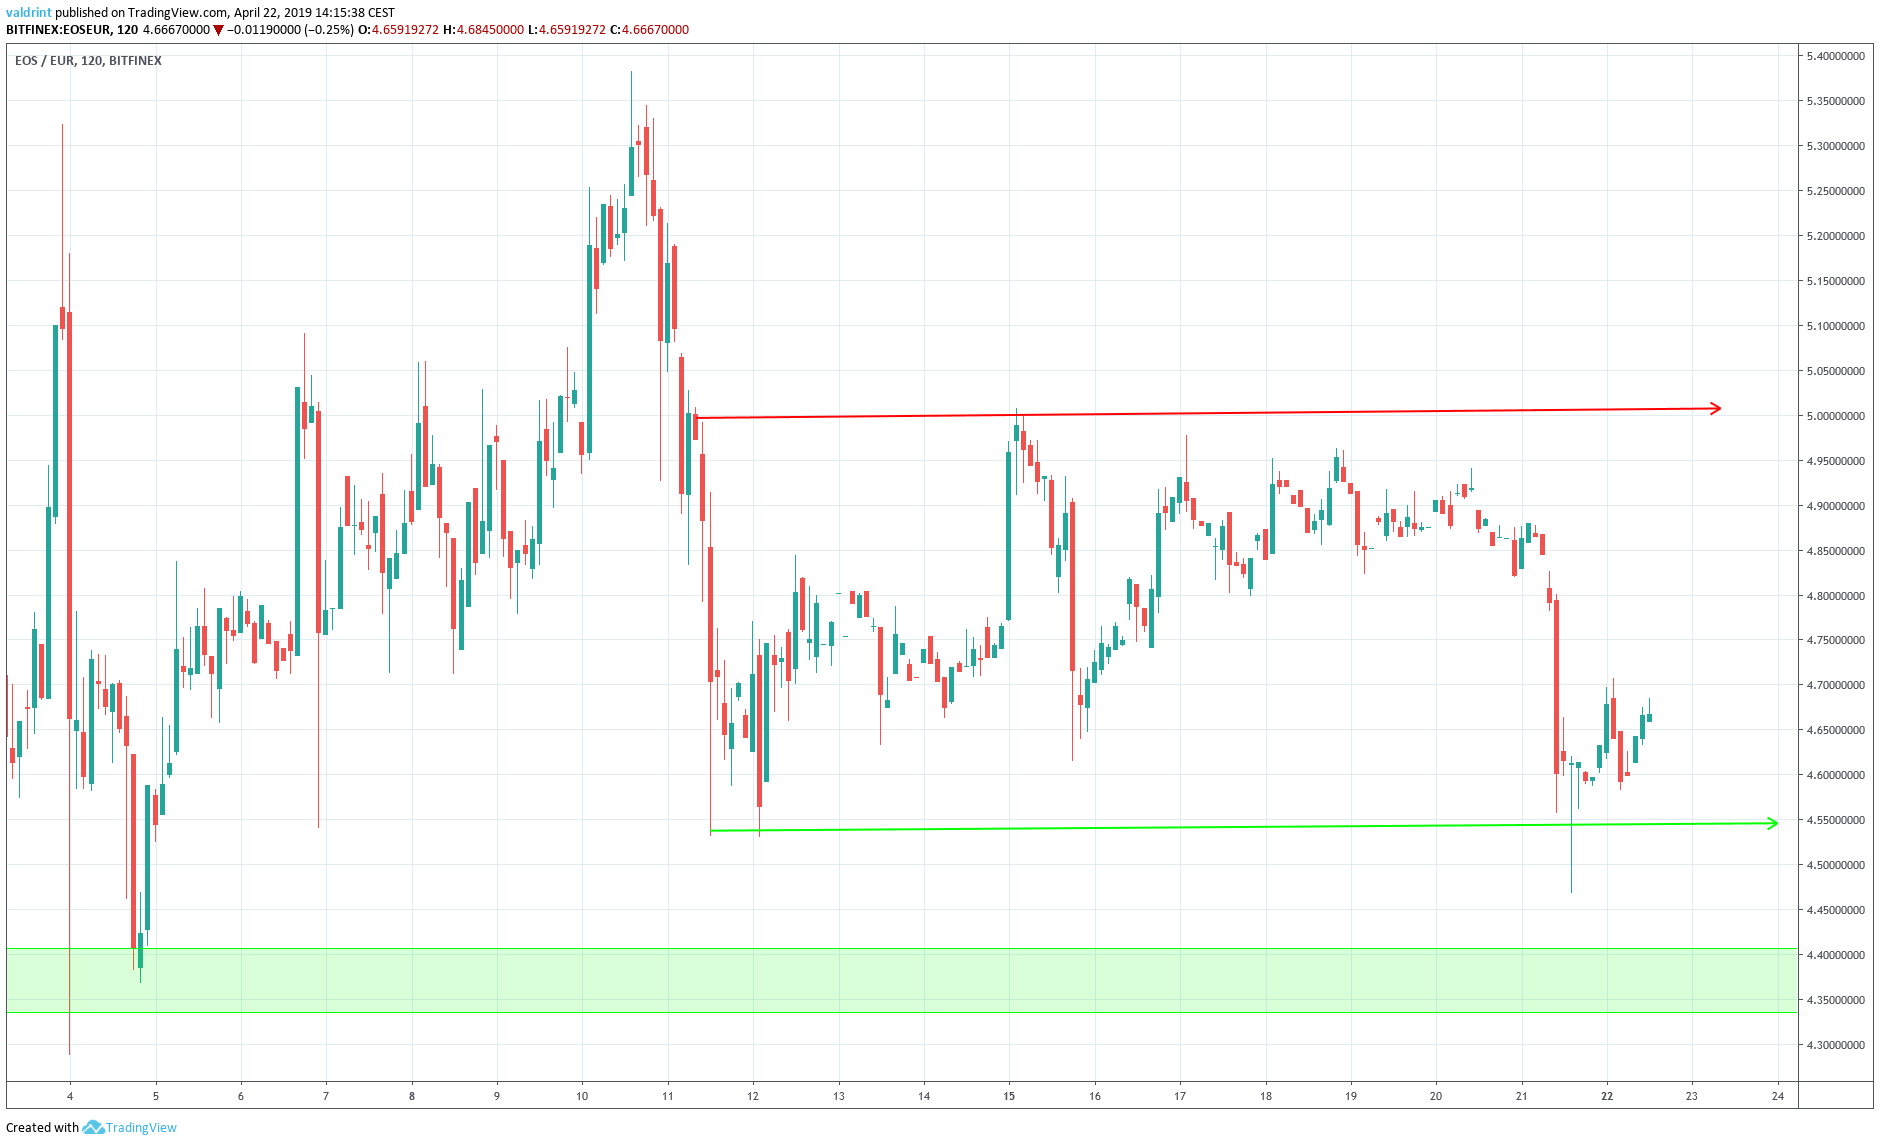
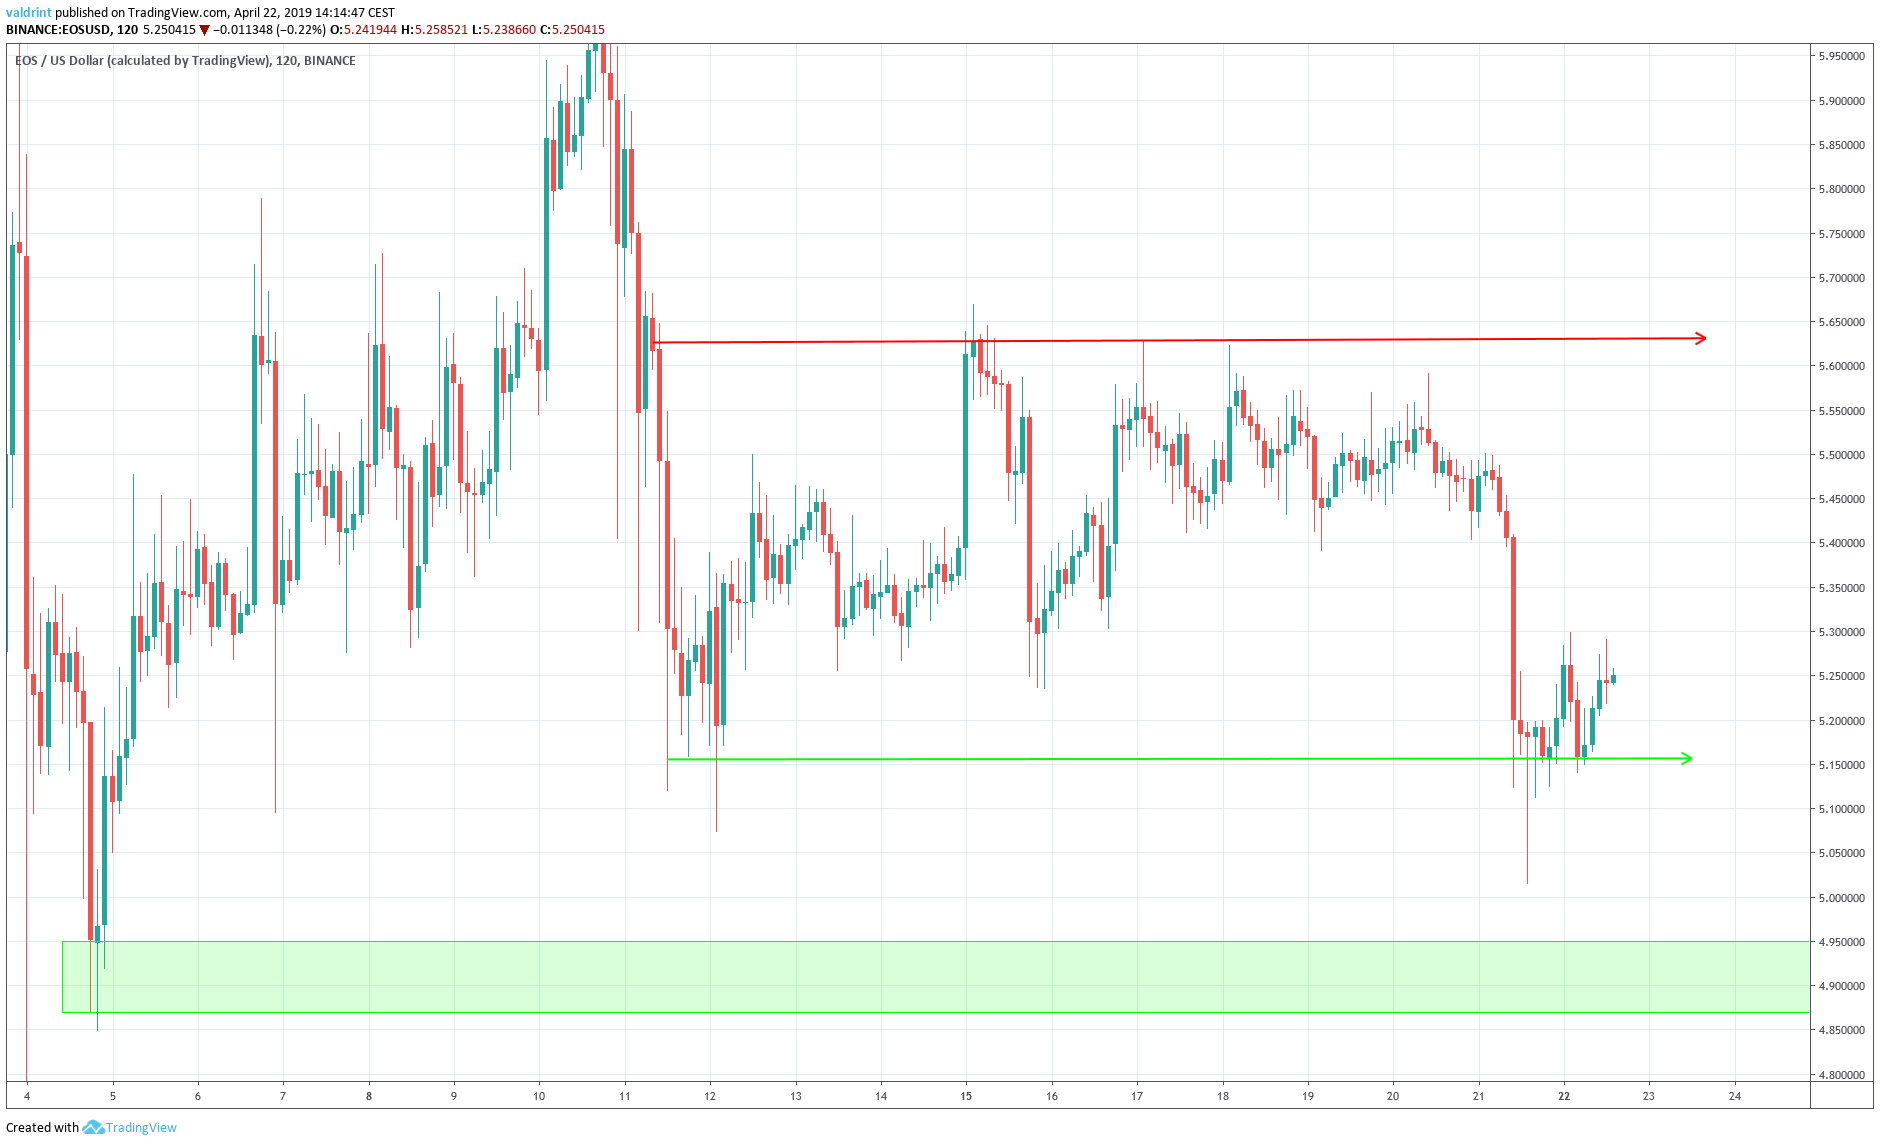
Future Movement
In this section, we incorporate support areas into the analysis to determine possible future price levels.Support areas are created when the price reaches a certain level numerous times. They can act as a reversal area in case a breakdown or breakout occurs.
One support area is shown for EOS/EUR (first graph) and EOS/USD (second graph) below:
Summary of Analysis
Based on our analysis, it is likely that the price of EOS will begin to increase towards the resistance line of the channel. This means that price gains may be seen in the near future. Do you think the price of EOS will break down from the channel? Let us know your thoughts in the comments below! For 2019 and 2020 price predictions, click on the green button below: Disclaimer: This article is not trading advice and should not be construed as such. Always consult a trained financial professional before investing in cryptocurrencies, as the market is particularly volatile.
Top crypto projects in the US | April 2024
Trusted
Disclaimer
In line with the Trust Project guidelines, this price analysis article is for informational purposes only and should not be considered financial or investment advice. BeInCrypto is committed to accurate, unbiased reporting, but market conditions are subject to change without notice. Always conduct your own research and consult with a professional before making any financial decisions. Please note that our Terms and Conditions, Privacy Policy, and Disclaimers have been updated.

Valdrin Tahiri
Valdrin discovered cryptocurrencies while he was getting his MSc in Financial Markets from the Barcelona School of Economics. Shortly after graduating, he began writing for several different cryptocurrency related websites as a freelancer before eventually taking on the role of BeInCrypto's Senior Analyst.
(I do not have a discord and will not contact you first there. Beware of scammers)
READ FULL BIO
Sponsored
Sponsored