

Dogecoin (DOGE) has returned to re-test the previous breakout level after a massive increase during the final week of 2020.
The Dogecoin/Bitcoin pair is very close to breaking out from a more than three-year-long descending resistance line.
Long-Term Dogecoin Levels
During the week of Dec. 28 – Jan. 4, DOGE increased massively, going from a low of $0.0041 to a high of $0.013 — an increase of 233%.
However, higher prices could not be sustained. DOGE was rejected at the 0.618 Fib retracement level of $0.0124 and left a long upper wick in place. DOGE has been moving downwards since.
Nevertheless, DOGE returned to validate the breakout level at $0.0068. As long as DOGE is trading above this level, the long-term trend is considered bullish.
Furthermore, weekly technical indicators are bullish, supporting the continuation of the upward movement and another attempt at breaking out above $0.0124.

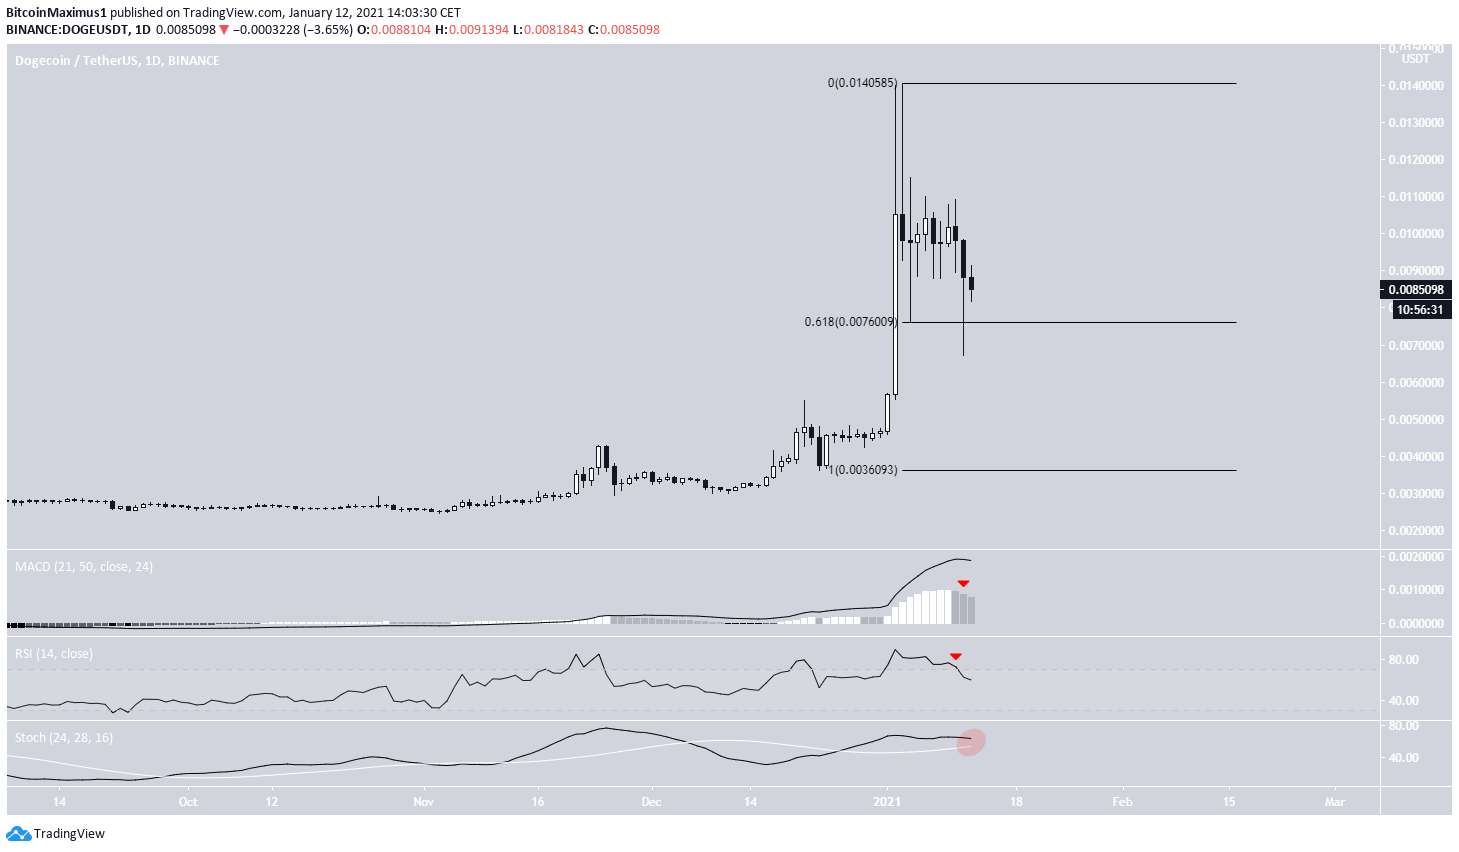
Daily Chart
The daily chart shows that DOGE has bounced at the 0.618 Fib retracement level, measuring from the Dec. 23 low.
The bounce and the long lower wick created at this level supports the possibility that DOGE is in a long-term bullish trend despite the ongoing decrease.
However, technical indicators in the daily time-frame have turned bearish. The MACD has created successive lower momentum bars and the RSI has crossed below 70 — both normal signs of a trend reversal. If the Stochastic oscillator were to make a bearish cross, it would likely confirm the bearish trend.
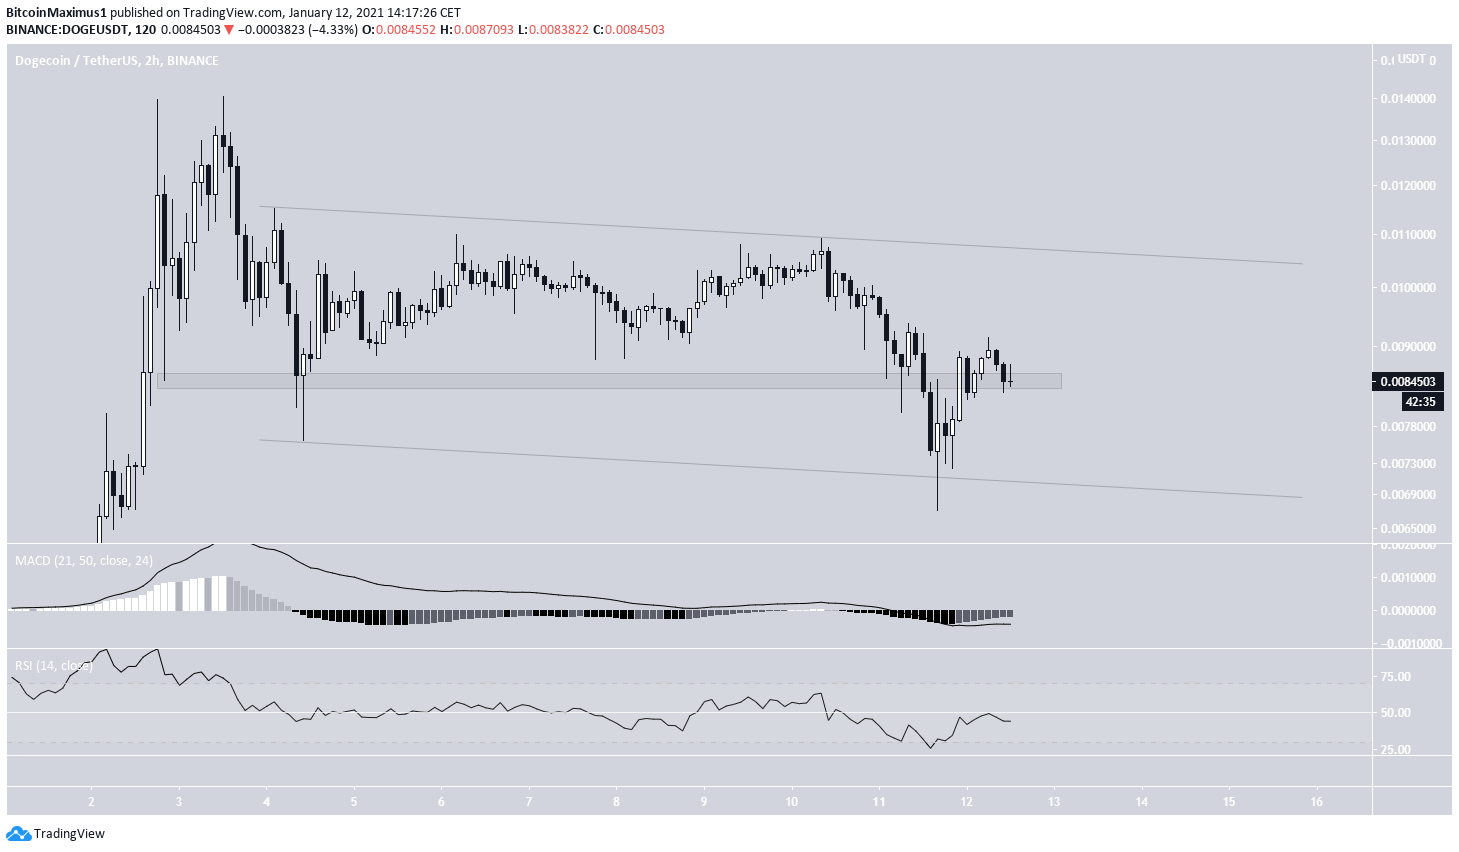
The two-hour time-frame shows that DOGE is possibly trading inside a parallel descending channel, which is a sign of a corrective movement. This further supports the possibility that the current decrease is corrective and that DOGE will eventually move higher.
The MACD is moving upwards, as is the RSI. An RSI cross above the 50-line would further support the bullish trend.
If DOGE creates a higher low and manages to stay above the $0.0084 support, it would likely confirm that the short-term trend is bullish.
DOGE Wave Count
The wave count suggests that DOGE is in an extended wave 3 (shown in white below) of a bullish impulse that began in March 2020.
A preliminary target for the top of wave 3 is found between $0.0198-$0.0213, which would take DOGE to a new all-time high.
DOGE appears to be in sub-wave 3 (orange).
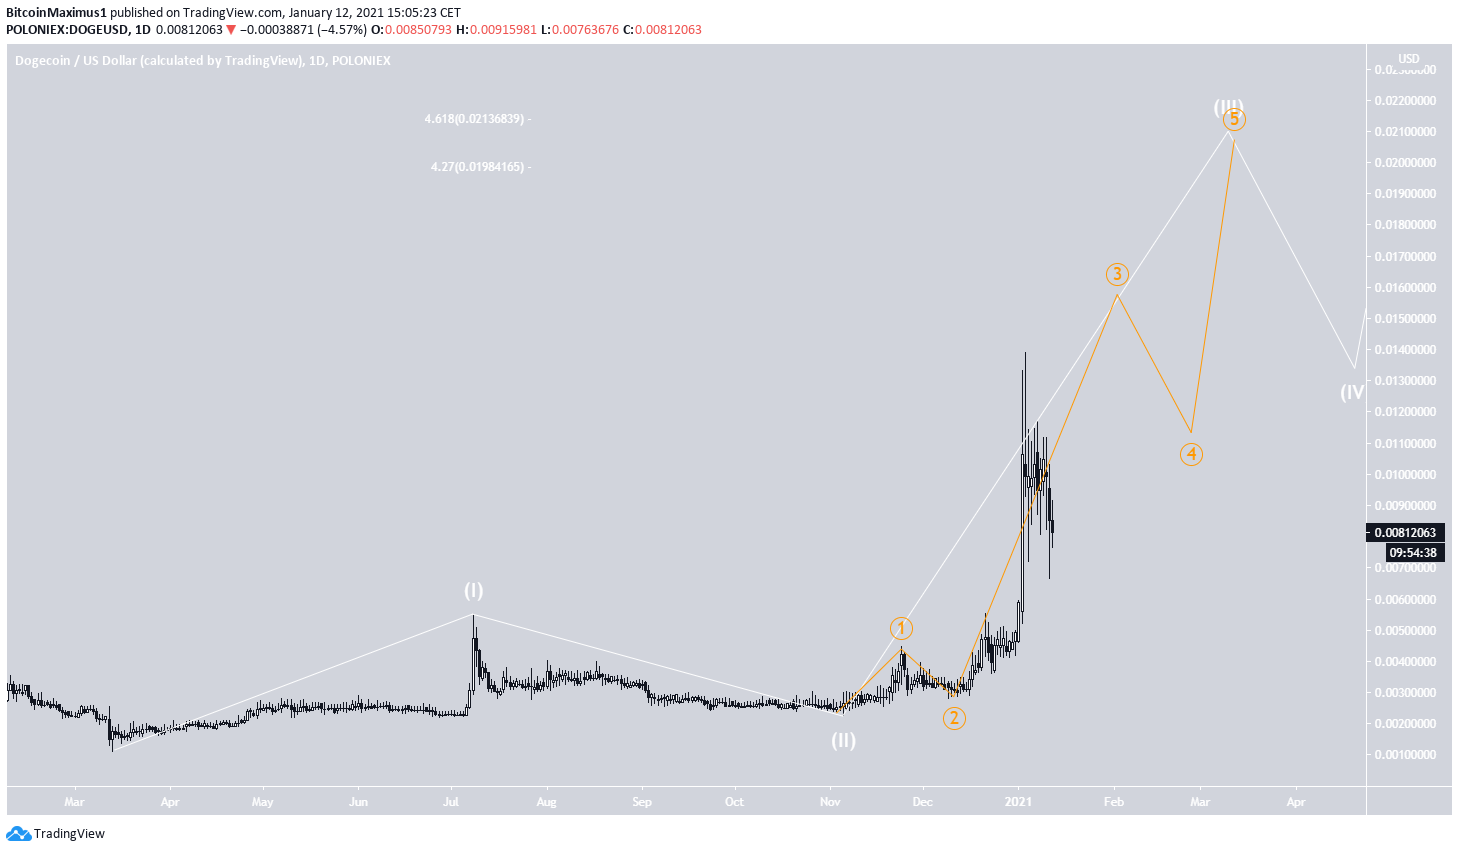
A closer look reveals that DOGE has likely completed minor sub-wave 4 in what is possibly a fourth wave pullback.
If this is true, it will likely soon begin sub-wave 5, which is expected to end between $0.0176-$0.0183. This target was found by projecting the length of minor sub-waves 1-3 and using an external retracement on minor sub-wave 4.

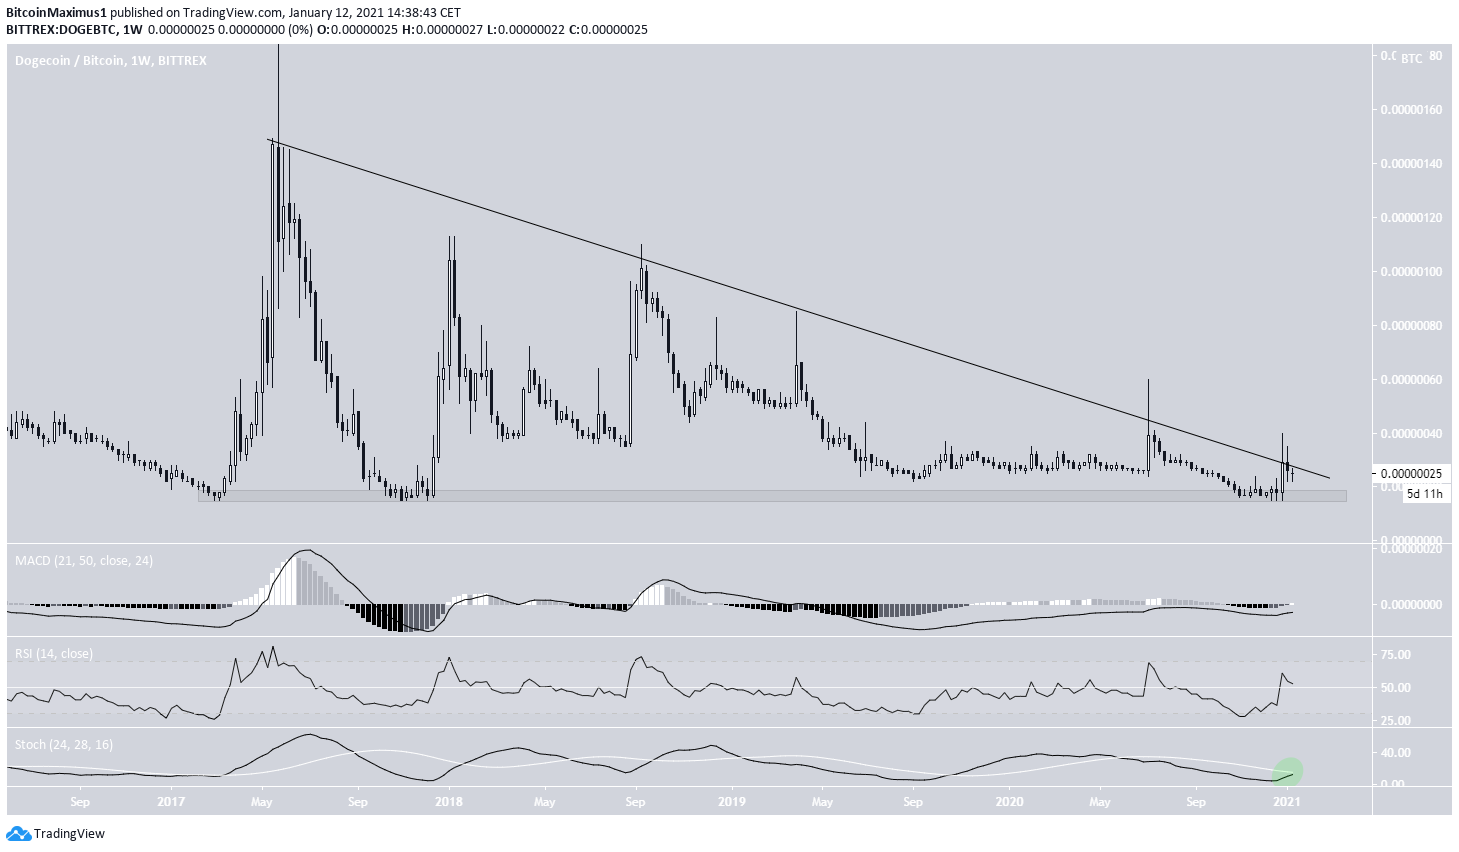
DOGE/BTC
Cryptocurrency trader @Ultra_KZ outlined a DOGE/BTC chart and stated that they are expecting an upward move to begin soon.
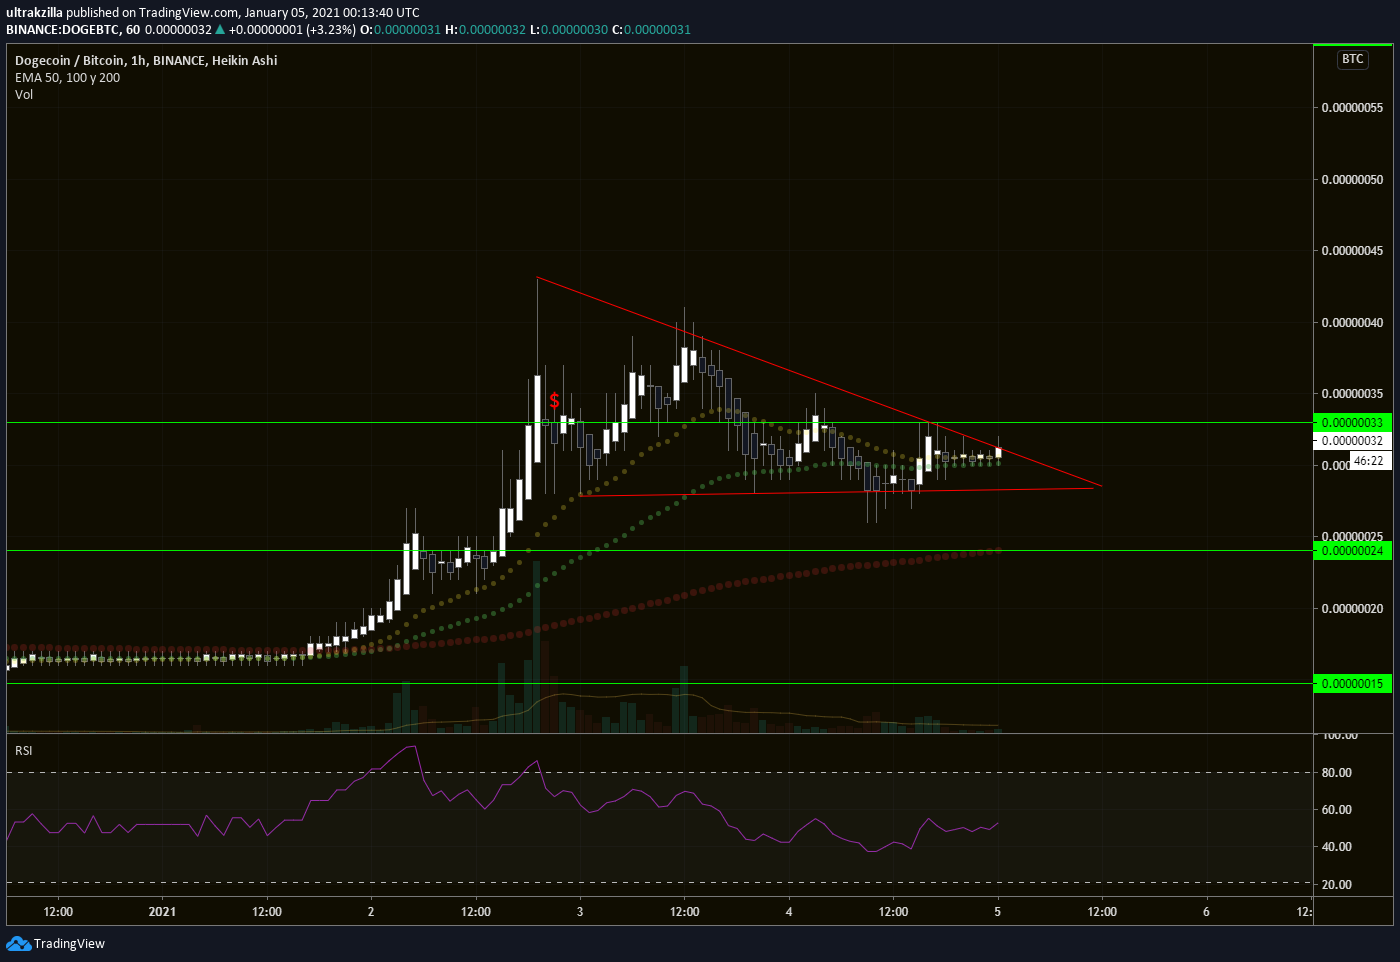
The DOGE/BTC chart shows that DOGE has bounced at the 17 satoshi support area and is currently trading at a descending resistance line that’s been in place since the 2017 all-time highs.
Technical indicators are also bullish. The MACD is increasing and the RSI has crossed above 50. A bullish cross in the Stochastic oscillator would likely confirm that the long-term trend is bullish.
Conclusion
The DOGE/USD pair is expected to soon resume its upward movement and eventually move towards the $0.0176-$0.0183 region.
The DOGE/BTC pair is very close to breaking out from a long-term descending resistance line. This is a move that could potentially be the catalyst for a significant price increase.
For BeInCrypto’s latest Bitcoin (BTC) analysis, click here!
Disclaimer: Cryptocurrency trading carries a high level of risk and may not be suitable for all investors. The views expressed in this article do not reflect those of BeInCrypto.
Trusted
Disclaimer
In line with the Trust Project guidelines, this price analysis article is for informational purposes only and should not be considered financial or investment advice. BeInCrypto is committed to accurate, unbiased reporting, but market conditions are subject to change without notice. Always conduct your own research and consult with a professional before making any financial decisions. Please note that our Terms and Conditions, Privacy Policy, and Disclaimers have been updated.
