At BeInCrypto, we perform technical analysis of some of the most relevant digital assets in order to predict short-term price fluctuations. In our April 16 analysis of DOGE/USD, we predicted that Dogecoin would initiate an upward move. At the time of writing, we are still awaiting the movement. Today, we are performing an analysis of Dogecoin using both a DOGE/USD and DOGE/BTC pair. In the case of BTC, we will be measuring the price of DOGE in satoshis where 1 satoshi = 0.00000001 Bitcoin.
On Apr 4, 2019, the price of Dogecoin (DOGE) reached a high of $0.0041 and 85 satoshis. It has been gradually decreasing since, recently reaching lows of $0.0027 and 52 satoshis.
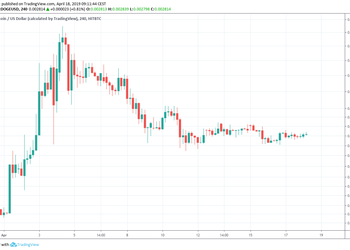
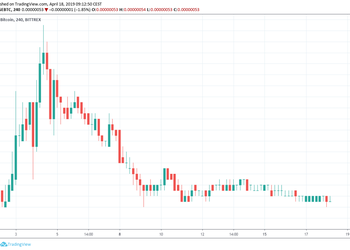
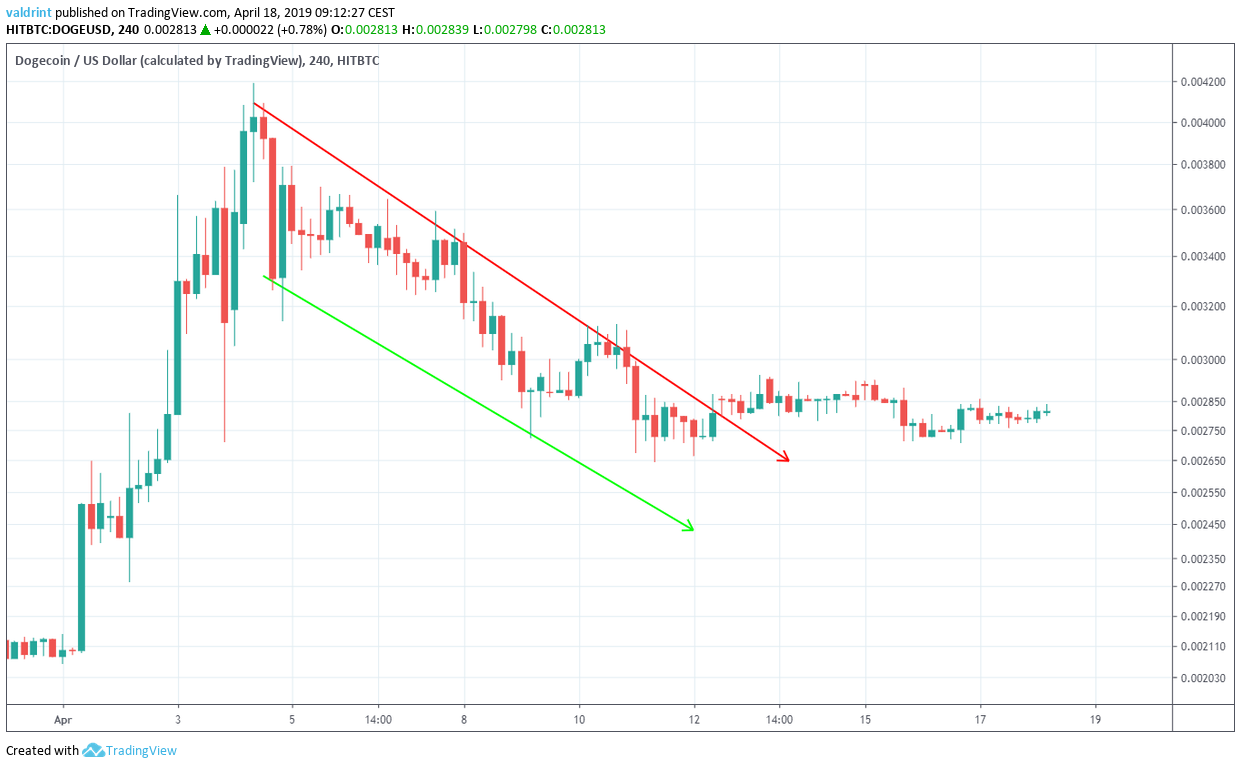
DOGE/USD Prices: Apr 1 – Apr 18DOGE/BTC Prices: Apr 1 – Apr 18
Will prices continue dropping or can we expect a reversal to bring gains back to Dogecoin?
Let’s find out!
Dogecoin (DOGE): Key Trends And Highlights For April 18, 2019
The price of DOGE/USD began an uptrend on Apr 1.
Dogecoin reached a high on Apr 4.
It broke out from a descending wedge on Apr 13.
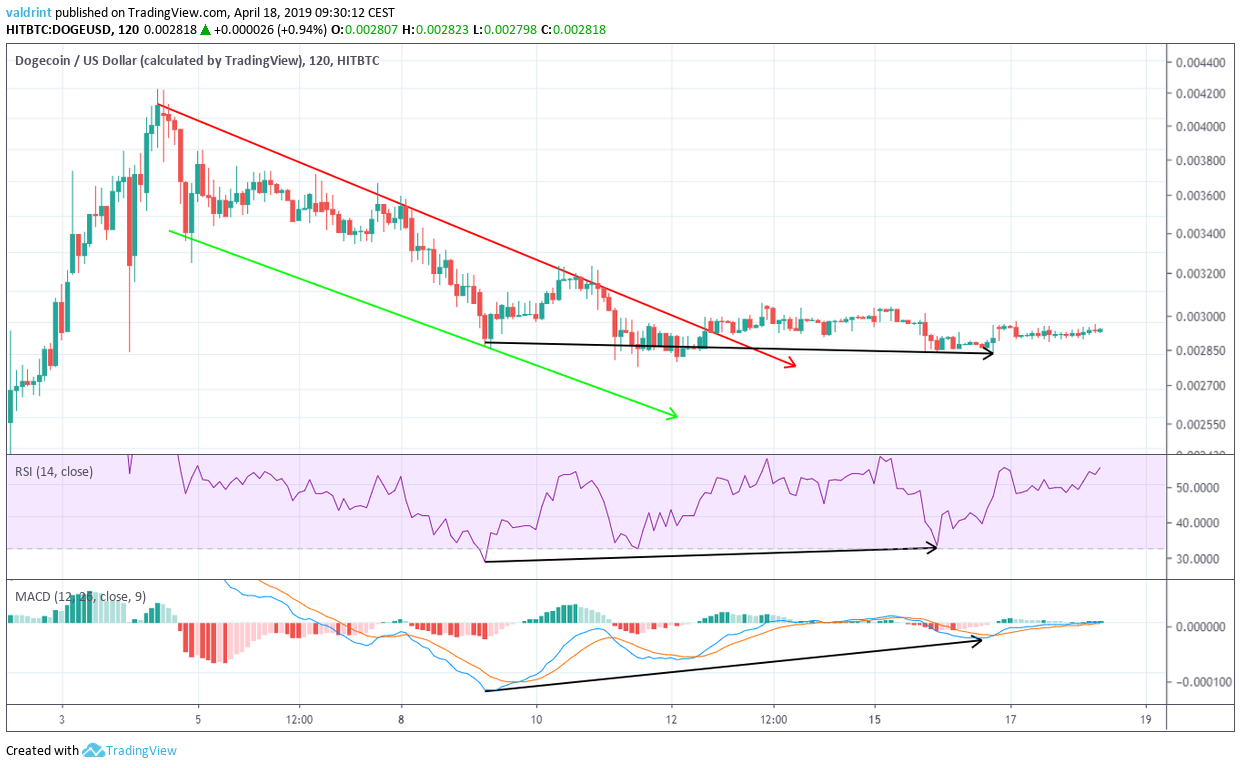
Slight bullish divergence is developing in the RSI and the MACD.
There is resistance near $0.0036 and 60 satoshis.
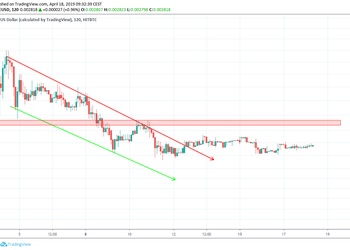
Descending Wedge
The price of DOGE/USD is analyzed at two-hour intervals from Apr 1 to Apr 18 using data from HitBTC. This is done in order to trace Dogecoin’s current trading pattern. In order not to create confusion, we will not be using images of the BTC pair until the summary, where the relevant resistance and support areas will be shown in satoshis.
On Apr 4, the price made a low of $0.0031. A gradual increase was followed by a decrease. The price made a lower low on Apr 9.
Tracing these lows gives us a descending support line:
On Apr 4, the price made a low of $0.0041. Since then, several market cycles have been completed with each high being lower than the previous one.
Tracing these highs gives us a descending resistance line:
The support and resistance lines combine to create a descending wedge:
The price broke out from the wedge on April 13.
To assess future price fluctuations, we need to take a look at some technical indicators.
Technical Indicators
We begin with the MACD and RSI.
The moving average convergence divergence (MACD) is a trend indicator that shows the relationship between two moving averages (long and short-term) and the price. It is used to measure the strength of a move.
The relative strength index (RSI) is an indicator which calculates the size of the changes in price in order to determine oversold or overbought conditions in the market.
Combining MACD and RSI bullish/bearish divergence with support/resistance essentially predicts price fluctuations.
On Apr 9, the price made a low of $0.00272. It reached another low of $0.00270 on Apr 16.
Similarly, the RSI and the MACD reached the first low on Apr 9. However, they have proceeded to generate higher values.
This is known as bullish divergence and often precedes price increases.
The level of divergence is not very significant. However, we believe it gains validity since it is occurring after the breakout from a bullish pattern.
Using these indicators, we believe that the price of Dogecoin will increase in the future. However, the increase may take a long time to materialize.
Possible Reversal
To determine future areas of reversal, we incorporate resistance areas into the analysis.
Resistance areas are created when the price visits the same level several times. They can provide reversal areas in case a breakout or breakdown occurs.
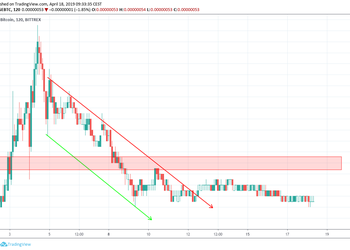
A resistance area is shown for both DOGE/USD and DOGE/BTC below:
DOGE/BTC ResistanceDOGE/USD Resistance
The closest resistance area is found near $0.0036 and 60 satoshis. We believe that the price will eventually reach these areas.
Sponsored
Sponsored
Summary of Analysis
Based on our analysis, the price of DOGE is likely to increase toward the resistance areas outlined above.
Do you think Dogecoin will initiate an upward move? Let us know your thoughts in the comments below!
For long-term price predictions of DOGE/USD, click on the green button below:
Disclaimer: This article is not trading advice and should not be construed as such. Always consult a trained financial professional before investing in cryptocurrencies, as the market is particularly volatile.
In line with the Trust Project guidelines, this price analysis article is for informational purposes only and should not be considered financial or investment advice. BeInCrypto is committed to accurate, unbiased reporting, but market conditions are subject to change without notice. Always conduct your own research and consult with a professional before making any financial decisions. Please note that our Terms and Conditions, Privacy Policy, and Disclaimers have been updated.
Valdrin discovered cryptocurrencies while he was getting his MSc in Financial Markets from the Barcelona School of Economics. Shortly after graduating, he began writing for several different cryptocurrency related websites as a freelancer before eventually taking on the role of BeInCrypto's Senior Analyst.
(I do not have a discord and will not contact you first there. Beware of scammers)


 On Apr 4, the price made a low of $0.0041. Since then, several market cycles have been completed with each high being lower than the previous one.
Tracing these highs gives us a descending resistance line:
The support and resistance lines combine to create a descending wedge:
On Apr 4, the price made a low of $0.0041. Since then, several market cycles have been completed with each high being lower than the previous one.
Tracing these highs gives us a descending resistance line:
The support and resistance lines combine to create a descending wedge:
 The price broke out from the wedge on April 13.
To assess future price fluctuations, we need to take a look at some technical indicators.
The price broke out from the wedge on April 13.
To assess future price fluctuations, we need to take a look at some technical indicators.